Sharif University of Technology
Scientia IranicaTransactions A: Civil Engineering www.scientiairanica.com
Dynamic load testing of a railway masonry arch bridge:
A case study of Babak Bridge
Sh. Ataei, A. Miri
and M. Tajalli
School of Railway Engineering, Iran University of Science and Technology, Narmak, Tehran, Iran. Received 8 November 2015; received in revised form 28 February 2016; accepted 10 May 2016
KEYWORDS Dynamic load test; Railway masonry arch bridge;
Numerical modeling; Abaqus;
Ultimate load carrying capacity;
Ring.
Abstract. Health monitoring of masonry bridges is vital due to their long life in service and an increasing need for higher axle loads. Results of feasibility study of applying an increased axle load of 25 tons to an old masonry bridge are presented in this paper. Babak Bridge is located in north western zone of Iranian railway network and has been in service for more than 70 years. It consists of stone masonry blocks, has three long spans of 21.5 m, 7 spans of 10 m, and a total length of 270 m. Response of the bridge subjected to predened train loading by 15 sensors, including deection meters, accelerometers, and strain gauges, is recorded. A total of 37 tests are carried out on Babak Bridge, and the results are used to calibrate the nite-element model of the bridge, which is developed by Abaqus software. The numerical model is then used to determine the weak spots of bridge due to subjection of higher axle loads for a possible strengthening procedure. Ultimate load-carrying capacity of the bridge is also assessed by Ring software, which suggests a minimum adequacy factor of 1.25 for an axle load of 25 tons.
© 2017 Sharif University of Technology. All rights reserved.
1. Introduction
Aiming at increasing the throughput of the network, railway administrators seek out new solutions, such as increasing the axle load or operational speed of trains, to allow more trains in the network. One major obstacle in doing so is the limited capacity of existing structures in the network such as bridges. In this regard, evaluating the performance of such structures subjected to dierent loading schemes and operational speeds seems to be the prerequisite of increasing the axle load.
Iranian railway organization has started a project of increasing the axle load of its railway network from the current 20 tons to 25 tons. One major problem is the existence of old masonry bridges in the network
*. Corresponding author. Tel.: +98 21 55128289 E-mail addresses: ataei@iust.ac.ir (Sh. Ataei); amin.miri.iust@gmail.com (A. Miri);
M tajalli@rail.iust.ac.ir (M. Tajalli)
such as Babak Bridge that is a masonry arch bridge built more than 70 years ago. The problem with evaluating the performance of such structures is the complexity of Masonry Bridge's behavior, which has been of great debate during recent years.
There are a number of methods proposed for the evaluation of load-carrying capacity of ma-sonry bridges, including empirical methods such as MEXE [1], yield design-based methods [2,3], ber beam elements method [4], and those employing a scaled model of the bridge [5,6].
Recently, a number of studies have successfully assessed the load-carrying capacity of masonry bridges by 2D and 3D nite-element models [7-12]. Caligyan et al. [11] conducted static and dynamic tests on a concrete arch bridge and used test results to calibrate the 3D model of the bridge. Marefat et al. [9] conducted static tests on a decommissioned masonry railway arch bridge. They concluded that despite initiation of cracks on the bridge structure, the bridge sustained loads much higher than the service load. Brencich and
Sabia [12] conducted dynamic tests on a bridge with 18 spans of 10 m. They used the test results to determine mode shapes and natural frequencies of the bridge, and concluded that multiple spots on the bridge have to be instrumented in order to determine the mode shapes of the bridge by dynamic tests.
This paper aims at presenting the result of eld tests carried out on one of the oldest masonry arch bridges of Iranian railway network to determine whether it is possible to increase the currently 20-ton axle load applied to the bridge or not. For this purpose, a 3D element model is developed in Abaqus nite-element software and calibrated to conform to test results.
2. Bridge characteristics
Babak Bridge is a masonry arch bridge built more than 70 years ago in north western part of Iranian railway network. The bridge consists of 3 long spans of 21.5 m, and 7 spans of 10 m, totaling a length of 270 m. The superstructure consists of U33 rails, wooden sleepers, and K fasteners and accommodates a single railway track of 20 tons. Maximum allowable speed on the bridge is 60 km/h. In order to have the characteristics of the material used in building the bridge, a series of tests have been conducted. Cores from various segments of the bridge are taken to a lab and tested to determine the compressive strength of the material. According to test results, compressive strength of stone segments is 12 MPa. Compressive strength of mortar is assumed to be 5 MPa throughout the paper. Figure 1 shows a view of Babak Bridge.
3. Test instrumentation
The aim of eld tests is to determine the response of Babak Bridge to the passage of the test train. For this purpose, vertical deections and vibrations of three 21.5-m spans and a 10-m span are monitored. Since Babak Bridge is of heritage value, all sensors are mounted on plastic frames glued to the bridge surface, and later taken o.
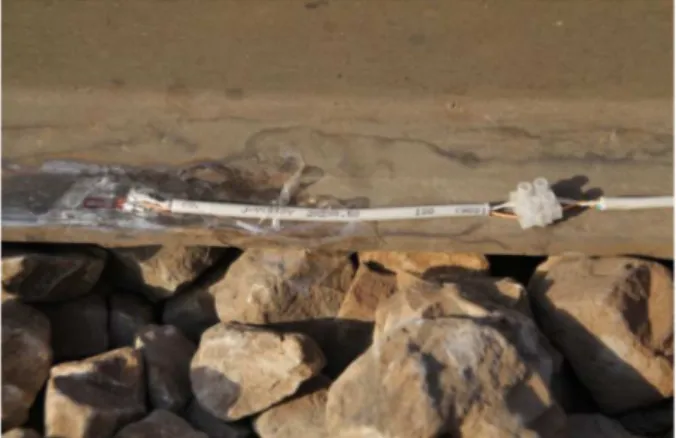
Deection of arch is supposed to be recorded with a frequency and accuracy of at least 20 Hz and 100 m, respectively. In order to record the deection of any spot on the arches of bridge with such standards, a reference point is needed on which the deection meter is xed and any displacement relative to the x point is recorded. For this purpose, a type of deection recording sensor called `Deected Cantilever Displacement Transducer', or simply `DCDT', is used. DCDTs come with a cable that is xed to a reference point. A steel sleeper is placed beneath the span and DCDT's cable is xed to the sleeper, as shown in Figure 2. DCDT sensor is capable of recording the
Figure 2. (a) DCDT sensor mounted in the middle of the span. (b) DCDT's cable xed to the steel sleeper placed beneath the span.
Figure 3. LVDT mounted on sleeper to determine the exact speed and location of test train axles.
Figure 4. Strain gauge mounted on rail heal to determine the exact speed and location of test train axles.
displacement in a range of 25 mm with accuracy of 10 m.
To determine the exact speed and location of test train on the bridge, a series of LVDT sensors and strain gauges are mounted on the rail, as shown in Figures 3 and 4. Furthermore, bridge vibrations due to test train loads are recorded by 7 accelerometers. Overall, 15 sensors are mounted on Babak Bridge as depicted in Figure 5. Data are recorded with a frequency of 2 kHz throughout the tests.
Three 6-axle locomotives and ve 4-axle freight wagons are used to form the test train. Four dierent train formations are considered throughout the tests: full train consisting of 3 locomotives and 5 freight wag-ons (TF1), three locomotives (TF2), two locomotives (TF3), and a single locomotive (TF4). Axle spacing and loads are presented in Figure 6, schematically. Dynamic tests are repeated for each train formation with speeds ranging from 10 to 65 km/h, totaling 37 dynamic tests.
4. Field test results
Figure 7 presents the response of the bridge in terms of vertical deection of the middle of the rst span in both
northern and southern sides. Since no super elevation exists on bridge superstructure, DCDT signatures on both sides are almost identical. Figure 8 presents the maximum recorded deections of all spans, due to the passage of test train with varying speeds. According to Figure 8, the 4th span has the least deection among the monitored spans, which coordinates with the fact that the 4th span is more rigid due to its smaller span length.
In order to compare the vibration levels in dier-ent spots of the bridge, root mean squares of recorded acceleration signatures are calculated and presented in Figure 9. Root mean square is determined using the following equation:
RMS = rP
a2 i
n ; (1)
where ai is the recorded acceleration value in time i,
and n is the number of recorded acceleration values during a single test. Figure 9 suggests that there is a positive correlation between RMS of acceleration signatures of all spans and speed of test train.
Figure 10 presents the recorded RMS of vertical acceleration in the middle of the rst span due to dierent loading schemes. The RMS of acceleration due to the loading scheme of TF1 is slightly higher than other loading schemes, while TF4 results in the least level of RMS of acceleration.
5. Numerical model of Babak Bridge
To study the possibility of increasing the allowable axle load of Babak Bridge, a linear 3D nite-element model of the bridge is developed in Abaqus software by 8-point solid elements and a maximum mesh size of 40 cm, which adds up to a total of 60860 elements and 75282 points (Figure 11). In order to set the ma-terial characteristics of the model, an initial equivalent module of elasticity is determined using the equations stated in UIC 778-3 [13] as follows:
E = 5000 + 300fb; (2)
where E is the equivalent elasticity modules of the masonry, and fb is the compressive strength of stone
masonry. According to material test results, a com-pressive strength of 12 MPa is considered as the stone's compressive strength. Hence, an initial module of elasticity of 8.6 GPa is determined for the masonry.
The nite-element model of the bridge is cali-brated to minimize the dierences between analytically and experimentally estimated modal properties by changing some uncertain modeling parameters such as material properties. Modulus of elasticity of masonry is used as a calibration parameter for each span and will be modied to make sure that the numerical model
Figure 5. Test instrumentation and span indexing of Babak Bridge.
Figure 6. Schematic plan of test train axles.
Figure 7. Vertical deection signature of northern and southern sides of the middle of the rst span due to the passage of TF1 with 63 km/h speed.
conforms to the response of Babak Bridge in terms of vertical deection as recorded during eld tests, as shown in Figure 12. Analytical natural frequencies are then compared to experimental ones for verication of the calibrated numerical model.
Calibrated modules of elasticity for each span is determined and presented in Table 1. It is also possible
Figure 8. Maximum recorded vertical deection
signatures of all spans due to the passage of test train TF1 with varying speeds.
to determine the compressive strength of masonry using the elasticity modulus of material, based on Eq. (3) presented in [14], as follows:
E = 1000fk; (3)
Figure 9. RMS of recorded accelerations in all spans of Babak Bridge due to the passage of test train TF1 with varying speeds.
Figure 10. RMS of acceleration in the middle of the rst span of Babak Bridge due to dierent loading schemes (m/s2).
Figure 11. Numerical model of Babak Bridge developed in Abaqus F.E. software.
Minimum compressive strength between Eq. (3) and material test is of interest, since the compressive strength calculated from Eq. (3) cannot be more than the one determined by material tests. Compressive strength of masonry is determined based on calibrated modulus of elasticity for each span, as presented in Table 1. The calibrated model is then used to derive
Figure 12. Calibration of numerical model of Babak Bridge with test results.
Table 1. Initial and calibrated elasticity modules and compressive strength of modeled material.
Span ID
Initial elasticity
modules (GPa)
Calibrated elasticity
modules (GPa)
Compressive strength
(MPa)
1st span 8.6 18.0 12.0
2nd span 8.6 12.0 12.0
3rd span 8.6 10.0 10.0
4th-10th span 8.6 4.0 4.0
Table 2. Natural frequencis of Babak Bridge derived form numerical model and eld tests (Hz).
Mode shapes 1st 2nd 3rd 4th 5th 6th 7th Numerical model 4.7 5.0 5.2 5.5 5.9 6.1 6.2 Field tests 3.9 { 4.9 { { { 6.8
the natural frequencies and modal shapes of the bridge, presented in Table 2 and Figure 13, respectively. Free vibration of acceleration signatures is considered in calculating the natural frequencies of the eld test results.
6. Assessment of stress in serviceability limit state
According to BD 91/04 [15], the permissible compres-sion stresses due to a loading scheme of D + 1:2L in serviceability limit state shall not exceed 0.4 fk. The
BD91/04 standard also mandates that the eccentricity of the center of compression in the arch ring shall not exceed 0.25 h, in which `h' is the overall thickness of the arch.
The proposed loading scheme of `UIC 776-1 guide-line' (LM71) [16] with an axle load of 25 tons is considered in analysis, which is presented in Figure 14. This loading scheme is similar to that proposed by 139 guidelines of Iranian railway. Stresses in the middle and quarter of the rst four spans of Babak Bridge are calculated as LM71 applied to the bridge and presented
Figure 14. The proposed loading scheme of `UIC 776-1 guideline' with an axle load of 25 tons (LM71).
Table 3. Tensions and eccentricity of the center of compression in the arch ring in dierent spots of Babak Bridge due to applying LM71 (values marked by red exceed the allowable limit).
Span# Position S (MPa) h e e=h
Allowable Calculated (mm) (mm)
1st span
Middle span Top ber 4.8 {1.9 1000 183.24 0.18
Bottom ber 4.8 0.09
Quarter span Top ber 4.8 {0.8 1100 159.46 0.14
Bottom ber 4.8 {0.06
2nd span
Middle span Top ber 4.8 {1.77 1000 202.63 0.2
Bottom ber 4.8 0.17
Quarter span Top ber 4.8 {0.97 1100 57.29 0.05
Bottom ber 4.8 {0.51
3rd span
Middle span Top ber 4 {1.78 1000 182.75 0.18
Bottom ber 4 0.08
Quarter span Top ber 4 {0.91 1100 19.72 0.02
Bottom ber 4 {0.73
4th span
Middle span Top ber 1.6 {0.42 750 302.98 0.4
Bottom ber 1.6 0.17
Quarter span Top ber 1.6 {0.13 800 {49.6 {0.06
Bottom ber 1.6 {0.28
in Table 3, along with permissible values. Positive values correspond to tensional stresses, while negative values indicate compression stresses. Table 3 suggests that compression stresses in all spans are in allowable thresholds. Unloading is not an issue in three larger spans, but exceeds the allowable limit in the middle of the 4th span.
7. Assessing the bridge in ultimate limit state The Ultimate Load-Carrying capacity (ULC) is ex-pressed in terms of a load factor, which is the ratio between the collapse load and live load. This study uses the Ring software, which is designed to calculate the ultimate load-carrying capacity of masonry arch bridges. Ring integrates the rigid block limit analysis method where single- and multi-ring arches are mod-eled as in-plane structures and arches as assemblages of rigid blocks. Through such modeling, it is possible to determine the collapse load and mechanism.
It is obvious that for each possible location of the moving vehicle, there is a specic load factor. Hence, the LM71 is applied in the quarter and middle
of each span, and collapse load and mechanism are determined. The results of both span lengths of 21.5 and 10 m are presented in Table 4. Due to stocky piers of 21.5-m span, failure mechanism of 21.5-m span is separated from other spans, and 4-hinge mechanism determines the ultimate load carrying capacity of 21.5-m spans. On the other hand, failure 21.5-mechanis21.5-m of 10-m spans occurs in both the arch structure and piers between 10-m spans. The failure mechanism of 10m spans is, therefore, a combination of 4-hinge and sliding mechanisms. According to Table 4, the load factor for the whole bridge is 1.25, since the minimum value of all possible factors is the one of interest.
8. Conclusion
Results of eld tests carried out on Babak Bridge are presented in this paper. Having the bridge instru-mented with deection meters and accelerometers, the response of bridge to three dierent loading schemes is recorded. The main advantage of using NDT sensors over conventional DT tests, such as core sampling, is reecting the general behavior of the bridge. While
Table 4. Ultimate load carrying capacity in 21.5- and 10-m span, due to the application of LM71.
Span length (m) Quarter-span Middle-span
21.5
ULC (tons) 1.43 1.25
10
ULC (tons) 2.24 2.19
core sampling results in local material properties, the NDT method employed in this paper takes the general response of bridge and uses it to calibrate the nite-element model of the bridge.
To assess the possibility of increasing the allow-able axle load of bridge, a 3D nite-element model is developed, which is calibrated using the results of eld dynamic loading tests. Module of elasticity of masonry is used as the calibration parameter and is modied until the analytical and experimental deections of 4 keystones of the bridge are almost identical. To verify the calibrated nite-element model of the bridge, experimental and analytical natural frequencies are compared, and it is shown that the two are almost identical.
Dynamic analyses are carried out on the numer-ical model of the bridge, and stresses in the middle and quarters of the rst four spans of the bridge are calculated and compared to allowable values stated by guideline. Results suggest that compression stresses in the rst three spans are in allowable thresholds, while the eccentricity of the center of compression in the arch of 4th span exceeds the allowable limit.
The ultimate load-carrying capacity of the bridge is also determined using the Ring software. The results suggest a load-carrying capacity of 1.25, which occurs as the LM71 is applied in the middle of 21.5-m span. According to the results of numerical model, 4-hinge mechanism is the failure mechanism of 21.5-m span, while a combination of 4-hinge and sliding mechanisms is the failure mechanisms of 10-m span. In other words, in 21.5-m span, all 4 hinges occur in the arch itself, while for 10-m span, three hinges occur in the arch and one other hinge occurs in the pier's bottom.
Acknowledgment
The authors would like to thank the nancial support from Nasran group under project number 94-15388
with Industrial Cooperation Oce of Iran University of Science and Technology.
References
1. Department of Transport \The Assessment of highway bridges and structures", Design Manual for Roads and Bridges, 3, Sec. 4, Part 4, London, UK (1997).
2. Havey, W. \Application of the mechanism analysis to masonry arches", ASCE Journal of Structural Engi-neering, 66(5), pp. 77-84 (1988).
3. Clemente, P., Occhiuzzi, A. and Railthel, A. \Limit behavior of stone arch bridges", ASCE Journal of Structural Engineering, 121(7), pp. 1045-50 (1995).
4. Felice, G. \Assessment of the load-carrying capacity of multi-span masonry arch bridges using ber beam elements", Journal of Engineering Structures, 31, pp. 1634-1647 (2009).
5. Prentice, D.J. and Ponniah, D. \Testing of multi-span model of masonry arch bridges", Proceeding Centenary Year Bridge Conference, Cardi (UK), Elsevier Sci-ence, pp. 169-174 (1994).
6. Cancelliere, I., Imbimbo, M. and Sacco, E. \Exper-imental tests and numerical modeling of reinforced masonry arches", Journal of Engineering Structures, 32, pp. 776-792 (2010).
7. Bayraktar, A., Altunisik, A., Birinci, F., Sevim, B. and Turker, T. \Finite-element analysis and vibration testing of a two-span masonry arch bridge", ASCE Journal of Performance of Constructed Facilities, 24, pp. 46-52 (2010).
8. Chandra, J.M., Ramaswamy, A. and Manohar, C.S. \Safety assessment of a masonry arch bridge: Filed testing and simulations", ASCE Journal of Bridge Engineering, 18, pp. 162-171 (2013).
9. Marefat, M., Ghahremani, E. and Ataei, S. \Load test of a plain concrete arch railway bridge of 20-m span", Journal of Construction and Building Materials, 18, pp. 661-667 (2004).
issues and ultimate load capacity of masonry arch bridges from the northwest iberian peninsula", Journal of Engineering Structures, 32, pp. 3955-3965 (2010).
11. Caglayan, B.O., Ozakgul, K. and Tezer, O. \As-sessment of a concrete arch bridge using static and dynamic load test", Journal of Structural Engineering and Mechanics, 41(1), pp. 83-94 (2012).
12. Brencich, A. and Sabia, D. \Experimental identi-cation of a multi-span masonry bridge: The tanaro bridge", Journal of Construction and Building Mate-rial, 22, pp. 2087-2099 (2007).
13. UIC 778-3, 2nd Edition, Recommendations for the Inspection, Assessment and Maintenance of Masonry Arch Bridges (2011).
14. Building Construction Under Seismic Conditions in the Balkan Region, United Nations Industrial Devel-opment Organization (1984).
15. Code BD 91/04 \Design manual for roads and
bridges", Unreinforced Masonry Arch Bridges (2004).
16. UIC 776-1,5th Edition, Loads to Be Considered in Railway Bridge Design (2006).
Biographies
Shervan Ataei has been an Assistant Professor of School of Railway Engineering since 2006. He received his BSc in Civil Engineering from University of Tehran
in 1998, his MSc in Structural Engineering from Uni-versity of Tehran in 2000, and his PhD in Structural Engineering from Tarbiat Modares University in 2006. His research interest includes dynamic eld testing of railway bridges and long-term monitoring of infrastruc-tures.
Amin Miri is currently a Researcher in `Intelligent Monitoring of Infrastructures Laboratory'. He received his BSc degree in Railway Engineering from Iran Uni-versity of Science and Technology in 2013. He received his Master of Civil Engineering from Sharif University of Technology in 2015. His current research is focused on safety and health monitoring of masonry bridges, bridge management systems, and sustainability and preservation of historical structures.
Mosab Reza Tajalli is currently a PhD student of Railway Engineering in `Iran University of Sci-ence and Technology'. He received his BSc degree in Civil Engineering from Shiraz University in 2009. He received his Master of Civil Engineering from University of Tehran in 2012. His expertise is in bridge design and train-bridge interaction. His current research is focused on safety and health monitor-ing of masonry bridges, bridge management systems, and sustainability and preservation of historical struc-tures.