ABSTRACT: Database plays very crucial role in software development. A well-organized database provides a back-end with correct access of information and least possibility of failure. Software development can be accomplished with Quality Function Deployment for better results. Application of Quality Function Deployment will assist in identification and rectification of problems and improvement of software product quality. Employing traditional Quality Function Deployment has a major drawback as it works on a crisp approach. A wrong conclusion can easily be drawn out since the nature of linguistic terms is disregarded. Integration of Fuzzy with Quality Function Deployment can be of great use to overcome this issue. As Quality Function Deployment matrix calculations are very complicated to handle manually, thus database is sturdily required. This will help database designer in understanding the formation of software tool to improve the quality of software product using Fuzzy Quality Function Deployment. This paper presents the literature of the pertaining topic followed by the brief discussion on Quality Function Deployment and Fuzzy Quality Function Deployment. Software database formation and workings are presented. Here the value chain needed is presented. Followed by the flow chart which shows how the process will be carried out. Then the detailed database tables are discussed. At last we have presented the entity-relationship diagram which relates each entity with other.
Keywords: Database, Database design, Quality Function Deployment, Fuzzy Quality Function Deployment, Software.
Received: 1 March 2015, Revised 28 March 2015, Accepted 3 April 2015 © 2015 DLINE. All Rights Reserved
1. Introduction
An elegant database is very important in the development of efficient software. A database is a collection of related data, which are organized so that useful information may be extracted from it [1]. Designing and implementing database in a systematic manner is very much required so as to acquire valuable and reliable software. Good database design helps to obtain a sound, consistent database, and in turn these are the best way to achieve the right design[2]. Once the database is designed properly software will never tend to be fail and thus will provide with access to the latest and correct information.
Developing new software products brings into equation a lot of challenges because a software product is characterized by invisibility, flexibility and complexity [3]. Hence for the convenience and appropriate software, database plays a key role. Development of software has to follow certain processes which can be better achieved using Software Engineering (SE). SE is
Database Design for Software Tool to Improve the Quality of Software Product
using Fuzzy Quality Function Deployment
Swati Bhatia, Ashish Sharma M.I.E.T, Gondia
India
is “the application of a systematic, disciplined, quantifiable approach to the development, operation, and maintenance of
software” [4]. Since errors at the beginning stage propagates through the development process and is the hardest to repair later. Therefore it is necessary to elicit requirements in priority basis[5]. This will help in providing good quality software. There were many methods that were applied for the development of software but the considerable rise in the failure rate of software product was noticed. This led to adopt a new method for developing software. It was noted that software failure were taking place because the requirements were not analyzed properly. For this researchers found the solution that QFD method can be used as a tool that will analyze the requirements in a proper way with the help of customer’s voice. QFD identifies what customer wants from the product and translates it into appropriate design requirements. It helps in identifying and rectifying the existing process problem and improves the quality of software product. Although the quality of a product can be dramatically improved through a QFD exercise, the traditional crisp scoring approach has a major drawback. A wrong conclusion can be easily produced since the fuzzy nature of linguistic correlation terms from evaluation members is ignored [6]. To overcome this problem QFD is integrated with Fuzzy to obtain the accurate results. Fuzzy set theory provides a strategy to develop a new product that involves the vagueness or linguistic value. FQFD is able to handle and get better quality of the product by taking note of the customer’s voice. Thus the development of Fuzzy Quality Function Deployment driven software tool will efficiently evaluate the customer requirements involved in the process which in turn will lead to improvement in software quality. Development of FQFD driven software tool to improve the quality of software product will require maintaining database for making data management easy. QFD uses huge amount of data and its calculations are very complicated. Therefore recording QFD matrix manually is very tedious and thus database is needed. This gives rise to design database. Appropriate organization and mechanism of databases is required to develop a software tool to improve the quality of software product using FQFD. Understanding the arrangement of this software tool database will help the designers successfully develop and uphold the software.
This paper presents literature review, followed by brief discussion on Quality Function Deployment and Fuzzy Quality Function Deployment then designing of the database in which value chain is explained followed by the flow chart, tables of database, and E-R Diagram and finally the paper is concluded.
2. Literature Review
Quality function deployment was conceived by Yoji Akao in Japan, in the late 1960s. Quality Function deployment (QFD) is a useful method for optimizing products. It converts the voice of customer i.e. customer requirement into product and service designs. QFD started off with manufacturing, but over the time, has found wide acceptance in several distinct areas and has been better applied in software development. One of the application areas for QFD is software development. Much work has been done in this area. Yang, Wang, Low and Goh addressed the challenge of developing an intelligent decision support system (DSS) for constructible designs within a concurrent engineering environment. They adopted quality function deployment (QFD) to communicate, analyze and satisfy the integrated requirements of design teams’ [7]. Ioannou, Pramataris and Prastacos addressed how QFD helps to capture and integrate the customer requirements into technical measures of a web site. They proposed how QFD plans, develop and make dynamic changes for the web site to expose and trace the level of satisfactions of customer needs [8]. Abyaneh, Nojehdehi and Alem-Tabriz developed a combined QFD and AHP approach in EPC projects as a novel deployment in customer services. QFD has been used to transform the engineering requirements (ERs), a novel kind of services, in EPC Project Company with respect to the owner needs (ONs) and aggregates the ERs ratings to get relative importance scores of ERs [9]. Ontiveros, Soto, Wolomberg and Martinez have introduced the purpose of QFD to propose Educational Intranet so that student’s requirements can be obtained and then translated those needs into characteristics about a product or service, also to develop and implement the plan to deliver the enhanced Network Computer course timely in an on-line format [10]. Okonta, Emmanuel, Ojugo, Arnold, Raphael and Dele have focused on how customers’ voice can be heard in order to reduce development and manufacturing costs, improve product quality, provide features that satisfy customer needs, and reduce development time. They adopted a new approach by extending the Quality Function Deployment matrix beyond the House of Quality [11]. Herzwurm, Reib and Schockert have identified QFD software tools and reviewed them on the basis of customer statements. They concluded that the customer satisfaction with the used QFD software tools is rare high [12]. Kivinen uses QFD to get better requirements and plan the supervision in small-scale software projects [13].
But the traditional QFD approach, evaluates the crisp procedure so it is difficult to reflect the vagueness or linguistic problem. To overcome this problem QFD is integrated with Fuzzy to obtain the accurate results. FQFD is a strategic management tool, which is capable of managing and improving the quality of the product design process by listening to the customer’s voice [14]. In FQFD approach, crisp values are translated into fuzzy numbers, which can be considered as probability distribution used to test the significance of the coefficients [15]. To quantify the linguistic variables used in QFD, the fuzzy set theory is an excellent
tool to help a design team to select proper alternatives in an uncertainty environment [6]. Fuzzy sets or subset is a generalization of an ordinary or crisp set. It deals with imprecise data and problems that have many solutions rather than one. The fuzzy logic is close to the functioning of the human thought. A lot of work has been done in this area. Tripathy, Gaur, Sharma and Virdi uses an intelligent wireless sensor network (WSN) to monitor the environment of interest and empowered each sensor node by Fuzzy Logic System to monitor environment, so that a sensor is in sleep mode when there is no data to transmit. They studied the behavior of Hybrid network topology to make the system energy efficient and have property of liveness, soundness, without any deadlock state during execution [16]. Balanica, Dumitrache, Caramihai proposed a fuzzy logic technique for the prediction of the risk of breast cancer based on a set of judiciously chosen fuzzy rules utilizing patient age and automatically extracted tumors features [17]. Mamat deal with a Fuzzy Logic Controller (FLC) for an automated car breaking system. This controller was made to break a car when the car approaches for an obstacle at a specific range. They design Fuzzy Logic Controller using the Fuzzy Logic Toolbox in MATLAB. Output of the controller determines the force of car break [18]. Kurnaz, Cetin, Kaynak proposed an independent routine controller for Unmanned Aerial Vehicles (UAVs) using fuzzy logic to control the speed, altitude and the route of air vehicle [19].
The development of fuzzy QFD (FQFD) driven software tool will efficiently evaluate the customer requirements involved in the process which in turn will lead to improvement in software quality. For storing the data of software database is required. This database needs to be designed to obtain reliable database. The literature on database designing is surveyed and presented. Jingda Yang designed the hotel management system. The system used use case diagram and introduced the three layers of frame structure, and the database design [20]. M.A. Casanova, S.D.J. Barbosa, K.K. Breitman, A.L. Furtado presented a research on database design at PUC-Rio from the early development of the relational model to recent applications of semiotic concepts to the design and specification of information systems [21]. Harsh Dev and Amit Seth proposed a new design of banking Database system of a bank using the modern MDA approach of software engineering to improve the maintainability, portability and flexibility [22]. Uduak A. Umoh, Enoch O. Nwachukwu, Augustine A. Umoh, and Etebong B Isong designed, implemented and analyzed a web-based database management system: an Industrial application. They developed the system based on MySQL DBMS, Java web server and Netbeans as the GUI builder [23]. Isaac Adusei, Ognjen Kuljaca and Kwabena Agyepong outline the architectural design for the CAD/CADx system and then designed and modeled the mammography database. The database design combined two standards, the Breast Imaging Reporting and Data System (BI-RADS) [24]. Rosina Surovi Khan and Mohammad Saber outlined complete database design for the entire Bangladesh Institute of Research and rehabilitation in Diabetes, Endocrine and Metabolic (BIRDEM) hospital in which data maintenance and retrieval are in perfect harmony and speedy. They also demonstrated sample SQL-based queries executed on the designed system [25]. Judith Bayard Cushing, Nalini Nadkarni, Michael Finch, Anne Fiala, Emerson Murphy-Hill, Lois Delcambre and David Maier designed component-base end user database for ecologists and suggested ways in which communities might share database components and how components might be used to foster easier data integration to solve new ecological problems [26]. Eric Jui-Lin Lu and Yung-Yuan Cheng designed and implemented a mobile database system for Java phones. They adopted XML to describe the databases [27]. Il-Yeol Song, Kyu-Young Whang discussed the structure and components of databases for real-world e-commerce systems. They illustrated a detailed design of an e-commerce transaction processing system and comment on a few design considerations specific to e-commerce database systems, such as the primary key, foreign key, outer join, use of weak entity, and schema partition [28]. Dennis R. McCarthy, Umeshwar Dayal has proposed Event-Condition-Action (ECA) rules as formalism for active database capabilities [29]. S. Finkelstein, M. Schkolnick, P. Tiberio described the concepts used in the implementation of Database Design (DBDSGN), an experimental physical design tool for relational databases developed at the IBM San Jose Research Laboratory [30]. Esther Kwan developed a customized SAS/AF application to facilitate the design of a large research database which has to be applicable in three software systems [31]. Inci Sentarli, Adnan Erdursun, Deha Caman presented the quality cost database management system along with its entity relationship, described the workflow behind the system being design and also showed the repetitive part of the client/server multilayer architecture in an application [32]. Li Ying, Cheng Li Ling constructed a fundamental spatial database system for Tibet province using Geodatabase model of the ArcSDE and the Oracle database management system [33].
3. Quality Function Deployment
Quality Function Deployment is an incessant development technique. QFD was originally developed and implemented in Japan at the Kobe Shipyards of Mitsubishi Heavy Industries in 1972. QFD was introduced by Yoji Akao in Japan in 1966. It is a strategic management tool that presents an ordered means for service providers to guarantee quality and customer satisfaction while maintaining a sustainable competitive advantage. “QFD in general is a concept that provides a way of converting customer requirements into the suitable design requirements at every stage of product development and production”. It focuses on
satisfying the consumer and then translating the consumer’s requirements into design targets. It is a customer driven process so it focuses on customer requirements, it diminishes execution time, avoids future development redundancies, recognizes future application occasions, it endorses teamwork and provide documentations. QFD is an illustration connective process that helps teams focus on the needs of the customers all the way through the total development cycle. QFD usually requires four matrices. These are product planning, product design, process planning, and process control, respectively. Product planning matrix also called as House of Quality (HOQ) translates customer requirements into design requirements; product design matrix translates important design requirements into product/part characteristics; process planning matrix translates important product/ part characteristics into manufacturing operations; process control matrix translates important manufacturing operations into day-to-day operations and controls [34]. Figure 1 shows the phases of QFD.
3.1 House of Quality
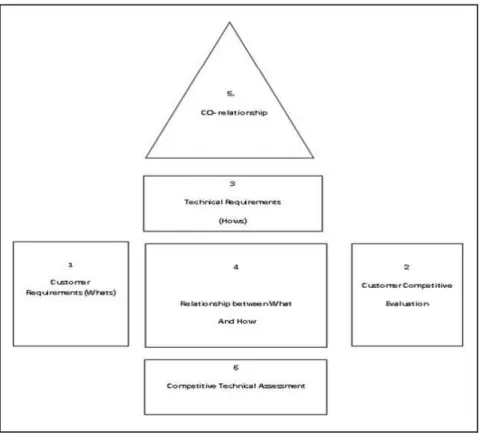
The tool which is engaged in QFD is called as “House of quality matrix”. It is the most accepted and broadly used form of QFD. House of Quality (HOQ) defines the relationship between customer requirement and product capabilities. To relate what customer wants and how the firm will meet those needs planning matrix is used. The fundamental organization is a table with “Whats” labeled on the left and “Hows” diagonally on the top. The roof is a diagonal matrix of “Hows vs. Hows” and its body is a matrix of “Whats vs. Hows”. Rankings based on the Whys and the correlations can be used to calculate priorities for the Hows. There are different types of HOQ one of them is six step HOQ model.
HOQ has horizontal and vertical way. The horizontal refers to WHAT part of QFD. The first step is “Identify Customer Requirements”. It identifies what customer wants i.e. customer requirement from consumer product. Once requirements are gathered they are compared with its competitors. This is the second step of HOQ “Customer Competitive Evaluation”. It is divided into several columns. An organization cannot satisfy all customer requirements at the same time. Hence they need to prioritize those requirements. This phase is known as “Importance Rating” and is placed in column 1. Next column i.e. column 2 shows how product A is performing currently considering its quality characteristics. Column 3, 4 and 5 represents the rating of competitor’s product. After that, column 6 shows the position of the consumer product against its competitors. After the product is compared with its competitors the company comes to know what improvement they need in the product. This is called as “Improvement Ratio” which is obtained by dividing the planned quality target levels by the current quality levels. Column 8 shows which feature of the product make sure competitive advantage for the company against its competitor and is named as “Sales Point”. Finally the requirements are prioritized and the relative weight is calculated in column 9. It is calculated as Relative weight = Importance Rating * Improvement Ratio * Sales Point.
i.e. column 1 * column 7 * column 8. In the last column demand weight is determined by converting the relative weight to the percentage. And in this manner the horizontal way works.
The vertical way of QFD refers to HOW part. It works as follows. To satisfy the customer requirements they are translated into appropriate design requirements. So the third step of HOQ is “Identifying Design Requirements”. Each deign requirement should satisfy the customer requirement. It is very important to have a relationship between customer requirements and design requirements. Thus they are interrelated and so “Relationship between What and How” is the fourth step. The roof of the house is designed to cross correlate the “hows” against each other known as “Co-relationship between design requirements” and is the fifth step. Finally in the sixth step “Priority Score” is calculated. This shows which design requirement is important to improve first i.e. the design requirements are prioritized. How 6-step HOQ is carried out is shown below in Figure 2.
Figure 2. House of Quality
4. Fuzzy Quality Function Deployment
Fuzzy logic was established by Professor L.A.Zadeh in 1965. It helps in handling problems with imprecise, vague and incomplete data. It uses human linguistics (word or sentences) understanding to express the knowledge of a system. This knowledge consists of facts, concepts, theories, procedures, and relationships and is expressed in the form of IF X AND Y THEN Z rules to describe desired system response in terms of linguistic variables rather than mathematical formula. Linguistic variables are exemplified by vagueness and diversity of meaning [15].Fuzzy logic system solves under defined or ill defined problems so that accurate solutions can be obtain. It is also used in decision making problems. It does not require specific inputs, and are inherently robust. It is the basic concept where the decisional criteria are difficult to find the aim and to make decision more precise and clear.
Integrating QFD with fuzzy will assist in dealing with the imprecise data. Sohn and Choi proposed a fuzzy-QFD model that conveys fuzzy relationship between CRs and DRs. FQFD has become a widely used tool in the development of products and services. Here the crisp values are translated into fuzzy numbers, which can be considered as probability distribution and used to test the significance of the coefficients. It helps design teams in gathering customer requirements and organizes these requirements. By paying attention to the customer’s voice it manages and improves the quality of the product design process. Fuzzy QFD can prove highly productive in software development.
5. Database Designing
Database is very important part of software development. It not only stores data but also arrange them in an organized way so that useful information can be extracted from it when needed. To haul out appropriate information it is essential to design the database. Database designing produces a detailed data model of a database. A good database design starts with a list of the data that to be included in database. Database design offers a structured mechanism for storing, managing and retrieving information. There are two ways to design database, graphical and relational notational. Graphical way includes Entity - Relationship diagram and use case diagram. An Entity-Relationship diagram is crucial to creating a good database design [35]. It relates each entity with other. Use case diagram describes actions that system can perform with one or more external user. They are employed in UML (Unified Modeling Language). Relational notation transforms E-R diagram into easily readable diagram. It orders each table and its attribute in a specific manner. It also makes easy for an individual to normalize and denormalize any given table in the schema and can also restore to E-R diagram format [36].
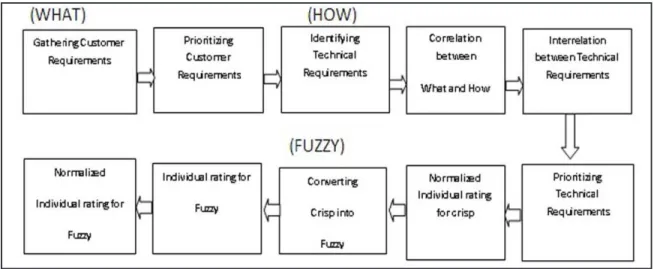
Here, Figure 3 shows the value chain required for FQFD software tool. This value chain will help in understanding the process. The flow chart is represented in Fig 4. This shows the flow of action or steps to be carried out during the entire process. Then the tables are described along with their attributes. There are total 19 tables present. Each table functions differently. Fig 5 presents entity-relationship diagram showing relation between one entity with other.
5.1 Value Chain
Figure 3. Value Chain
Figure 3 presents a more detailed value chain that consists of ten processes. Here, it is important to identify customer requirement. Therefore they are gathered from customer in the form of customer voice or through any organization. Since all the requirements cannot be satisfied at the same time thus they are prioritized to know which one is highly demanded. Then the technical requirements are identified to fulfill customer requirements and each technical requirement must have some relation with the customer requirement. Correlation between customer and technical requirement will help in prioritizing the technical requirement. Normalized Individual Rating is the result for crisp approach. Since QFD uses crisp approach so for better results it is integrated with fuzzy. Normalized individual rating is the result of fuzzy approach.
5.2 Flow Chart
Refer figure No. 4
5.3Tables Description
1. Tbl_Login (User_Name , Password)
2. Tbl_Product (Product_code, Product_Name)
Product information will be stored in this table. Product id will be stored in Product_code which is the primary key and its name in Product_Name which will hold text as its data type.
3. Tbl_Customer (Cust_code, Cust_name)
This table will store the data of customer. Here Cust_code will contain the id of customer which is the primary key and name in Cust_name. Cust_code and Cust_name will hold text as its data type.
4. Tbl_Customer_requirement (CR_code, CR_name)
The requirements given by the customers will be maintained by this table. CR_code is the primary key and will store the id of customer requirement and CR_name will store the name of customer requirements. Both CR_code and CR_name will have textas its data type.
5. Tbl_Competitor_Master (Compet_code, Compet_name)
The number of competitors to be compared with owns product will be stored in this table. Compet_code and Compet_name will Figure 4. Flow Chart
store the id and name of competitors respectively. Compet_code is the primary key and will hold text value and Compet_name will also hold text value.
6. Tbl_Input_Rating (Product_code, Cust_code, CR_code, Rating, Importance_Rating)
This table will store the rating given by the customers to customer requirements. Product_code, Cust_code, CR_code will store the id of product, customer and customer requirement respectively and all will hold text as its data type. Importance_Rating will store the average of these rating and will store number as its data type.
7. Tbl_Compet_input ( Product_code, Cust_code, CR_code, Compet_code, Rating 1)
This table will store the rating given by customers to each customer requirement. Product_code, Cust_code, CR_code will store the id of product, customer and customer requirement respectively which will hold text value. Rating 1 will store the rating given by customers to competitors for each customer requirement which will hold number value.
8. Tbl_Compet_avg (Product_code, Cust_code, CR_code, Compet_code, Avg_compet, Rating 1)
This table will store the average of the competitors rating by the customers to each customer requirement. Product_code, Cust_code, CR_code and Compet_code will store the id of product, customer, customer requirement and competitors respectively and all will hold text as its data type. Rating 1 will store the rating given by customers to competitors for each customer requirement. Avg_compet will store the average of these ratings. Rating 1 and Avg_compet will hold number as its data type. 9. Tbl_Compute_Improvement_Ratio (Product_code, Avg_compet, Cust_code, CR_code, Impr_ratio, Sales_pt, Goal)
This table will store the computed value of improvement ratio. Product_code, Cust_code and CR_code will store the id of product, customer, and customer requirement respectively and will have text as its data type. Avg_compet will store the average of own’s competitor rating. Impr_ratio, Sales_pt and Goal will store improvement ratio, sales point of the product and the company’s goal to achieve the target respectively. Avg_compet, Impr_ratio, Sales_pt and Goal will have number as its data type. 10. Tbl_Final_IR (Final_IR_code, Product_code, Cust_code, CR_code, Impr_ratio, Sales_pt, Goal, Relative_Wt, Demand_Wt,) This table will accumulate the prioritized value of customer requirements. Final_IR_code, Product_code, Cust_code and CR_code will store the id of prioritized customer requirements, product, customer, and customer requirement respectively whose data type will be text. Final_IR_code is the primary key. Impr_ratio, Sales_pt and Goal will store improvement ratio, sales point of the product and the company’s goal to achieve the target respectively and will have number as its data type. Relative_Wt will store the prioritized value of customer requirement. Demand_Wt will store the individual prioritized weight of customer requirement. Relative_Wt and Demand_Wt will hold number as its data type.
11. Tbl_Design_master (DR_code, DR_name)
Design requirements required to fulfill customer requirements are maintained in this table. DR_code stores the id of design requirement and is a primary key. While DR_name stores the name of the design requirement. Both will hold text as its data type. 12. Tbl_Correlation (Co_code, Product_code, CR_code, DR_code, Rating 3)
Relation between customer requirement and design requirement is stored in this table. Co_code stores the id of correlation. Product_code, CR_code and DR_code will store the id of product, customer requirement and design requirement respectively. Rating 3 will store the rating of correlation between customer requirement and design requirement. Co_code, Product_code, CR_code and DR_code will hold text as its data type and Rating 3 will hold number as its data type.
13. Tbl_Final_DR (Product_code, CR_code, DR_code, Co_code, IR_code, Priority_Score_Wt)
will store the id of product, customer requirement, design requirement, correlation and final prioritized value of customer requirement respectively and will hold text value. Priority_Score_Wt will store the prioritized value of design requirement and will hold number value.
14. Tbl_QFD_Norm_Rating (Product_code, DR_code, Priority_Score_Wt, Normalized_Rating)
This table will store the QFD normalized rating. Product_code, DR_code, Priority_Score_Wt will store product code, design requirement code and priority score of design requirement respectively. Normalized_Rating will store the normalized individual rating of QFD. Product_code and DR_code will hold text value. Priority_Score_Wt and Normalized_Rating will hold number value.
15. Tbl_Fuzzy_Master (Fuzzy_code, Fuzzy_comment)
Fuzzy_code and Fuzzy_comment will be accumulated in this table. Fuzzy_code will store id of fuzzy entries. Fuzzy_comment will store the relationship comments such as strong, moderate and weak. Both Fuzzy_code and Fuzzy_comment will hold text as its data type.
16. Tbl_Fuzzy_entry (Fuzzy_code, Min, Max)
The minimum and maximum range will be stored in this table. Fuzzy_code will store id of fuzzy entries and will hold text value. Min will store the minimum value of a relationship. Max will store the maximum value of a relationship. Min and Max will hold number as its data type.
17. Tbl_Fuzzy_Rating (Product_code, Cust_code, DR_code, Fuzzy_code, Avg_compet, Min, Max, Final_IR_code, Fuzzy_comment)
This table will store the fuzzy rating. Product_code, Cust_code, DR_code, Fuzzy_code, and Final_IR_code will store the id of product, customer, design requirement, fuzzy and final importance rating and the data type of all these is text. Avg_compet will store the average of competitors rating. Min will store the minimum value of a relationship. Max will store the maximum value of a relationship. Avg_compet, Min, Max will hold number as its data type. Fuzzy_comment will store the relationship comments such as strong, moderate and weak and will hold text as its data type..
18. Tbl_Fuzzy_Individual_Rating ( Individual_Rating, Product_code, Cust_code, DR_code, Fuzzy_code, Avg_compet, Min, Max, Final_IR_code, Fuzzy_comment)
Individual rating of fuzzy will be maintained by this table. Individual_Rating will store the rating of each fuzzy rating and will hold number as its data type.. Product_code, Cust_code, DR_code, Fuzzy_code, and Final_IR_code will store the id of product, customer, design requirement, fuzzy and final importance rating and will hold text as its data type. Avg_compet will store the average of competitors rating. Min will store the minimum value of a relationship. Max will store the maximum value of a relationship. Avg_compet, Min, Max will hold number as its data type. Fuzzy_comment will store the relationship comments such as strong, moderate and weak and will hold text as its data type.
19. Tbl_Fuzzy_Normalized_Rating (Normalized_Rating, Individual_Rating, Product_code, Cust_code, DR_code, Fuzzy_code, Avg_compet, Min, Max, Final_IR_code, Fuzzy_comment)
Normalized rating of fuzzy will be maintained by this table. Normalized_Rating will maintain the normalized rating of fuzzy. Individual_Rating will store the rating of each fuzzy rating. Both Normalized_Rating, Individual_Rating will have number value. Product_code, Cust_code, DR_code, Fuzzy_code, and Final_IR_code will store the id of product, customer, design requirement, fuzzy and final importance rating will have text value. Avg_compet will store the average of competitors rating. Min will store the minimum value of a relationship. Max will store the maximum value of a relationship. Avg_compet, Min, Max will hold number as its data type. Fuzzy_comment will store the relationship comments such as strong, moderate and weak and will hold text as its data type.
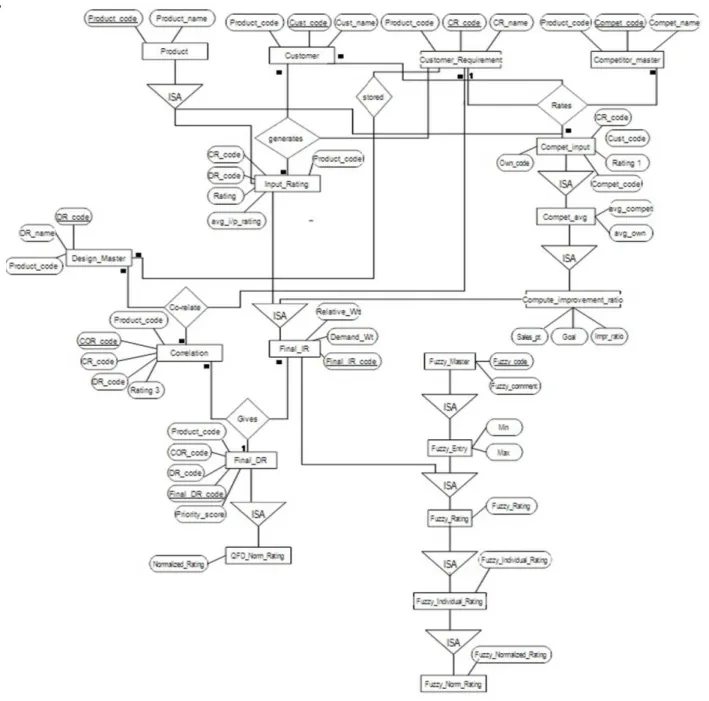
An entity-relationship diagram is a graphical representation of entities and their relationship to each other. Drawing an E-R Diagram aids understanding the data required and serves as a schema diagram. The above figure shows the E-R Diagram of Fuzzy Quality Function Deployment software tool and gives the relationship of one entity with the other either it is one-to-many,
many-to-one or many-to-many.
Here, we have entities- product, customer, Customer_Requirement, Competitor_Master, Input_ Rating, Avg_input_rating, compit_input, compit_avg, Own_compit_analysis, Own_avg, input_improvement_ratio, Design_Master, Correlation, Final_IR, Final_DR, QFD_Norm_Rating, Fuzzy_Master, Fuzzy_entry, Fuzzy_rating, Fuzzy_individual_rating, Fuzzy_normalized_rating. Relationship exists between these entities, which connect all the entities in the diagram. For ex, entity customer is related to Customer_Requirement via relationship Rate CR. In other words, we can say that many customers can rate one customer requirement. Similarly, customer, Customer_Requirement and compit_input are connected via relationship Rates. It means that many customers rate many compit_input for one Customer_Requirement. Analogously other entities are associated through relationships in a significant way.
6. Conclusion
Technology has been advanced due to which information storage has become easy. As system has been computerized through database, it has become easy to keep track of all the information needed. As QFD is a customer driven process it needs to record huge amount of data, what customer wants and how to fulfill it. It is tedious to keep it manually. Thus this database will help the designer to keep track of these records. This paper presents designing of the database for Fuzzy Quality Function Deployment tool follows as FQFD value chain, flow chart, schema for FQFD and entity-relationship diagram. Understanding the arrangement of FQFD database system will help the database designers successfully develop and uphold the system and thus will speed up the development of FQFD tool.
References
[1] Wiederhold, G. (1980). Databases in healthcare. Computer science department, Stanford University. [2] Badia, A., Lemire D. (2011). A call to arms: revisiting database design. SIGMOD Record, 40(3).
[3] Brad, S. (2007). Quality planning and innovation for competitive design of a software tool. Economy Informatics, 1(4). Retrieved on 4 November 2014, from www.softwareengineering/wikipedia/encyclopedia.html .
[4] Rajagopal, P., Lee, R., Ahlswede, T., Chiang, C. C., Karolak, D. (2005). A new approach for software requirements elicitation.
In: Proceedings of the Sixth International Conference on Software Engineering, Artificial Intelligence, Networking and Parallel/ Distributed Computing and First ACIS International Workshop on Self-Assembling Wireless Networks (SNPD/SAWN’05) 0-7695-2294-7/05 IEEE.
[5] Lin, M. C., Tsai, C. Y., Cheng, C. C., Chang, C. A. (2004). Using fuzzy QFD for design of low-end digital camera. International Journal of Applied Science and Engineering, 2 (3) 222-233.
[6] Yang, Y. Q., Wang, S. Q., Low, S. P., Goh, B. H. (2003). Adaptations of QFD for constructable designs within a concurrent construction environment: an information modeling approach.
[7] Ioannou, G., Pramataris, K.C., Prastacos G. P. (2014). A quality function deployment approach to web site development: applications for electronic retailing. Retrieved on 2 November, from http://www.decision.aueb.gr.
[8] Moghadam-Abyaneh, P. M., Nojehdehi, R. R., Alem –Tabriz, A. (2012). Quality function deployment in engineering, procurement and construction projects. Journal of Basic and Applied Scientific Research, 2 (4) 4167-4173.
[9] Ontiveros, B., Soto, I., Wolomberg, M. L., Martinez, L. M. (2014). Quality function deployment applied to the design of educational intranet. Retrieved on 25 October from http://math.unipa.it/~grim/Jsoto.PDF.
[10] Okonta., Emmanuel, O., Ojugo., Arnold, A., Raphael, W. U., Dele, A. (2013). Embedding quality function deployment in software development: a novel approach. West African Journal of Industrial & Academic Research, 6 (1).
[11] Herzwurm, G., ReiB, S., Schockert, S. The support of quality function development by the customer orientated evaluation of software tools. Retrieved on 10 November 2014, from http://www.wi.uni-stuttgart.de.
[12] Kivinen, T. (2008). Applying QFD to improve the requirements and project management in small-scale project. Retrieved on 1 December 2014, from http://www.cs.uta.fi/research/theses/masters/Kivinen_Terhi, 2008.
[13] Allahham, J. (2010).Vocational educational facility design: a fuzzy QFD approach.
[14] Zaim, S., Sevkli, M. (2002). The methodology of quality function deployment with crisp and fuzzy approaches and an application in the turkish shampoo industry, Journal of Economic and Social Research, 4 (1) 27-53.
[15] Tripathy, M. R., Gaur, K., Sharma, S., Virdi, G. S. (2010). Energy efficient fuzzy logic based intelligent wireless sensor network. In:Progress in Electromagnetic Research Symposium Proceedings, Cambridge
[16] Balanica, V., Dumitrache, I., Caramihai, M. (2011). Evaluation of breast cancer risk by using fuzzy logic. U.P.B. Sci. Bull., Series C, 73 (1).
[17] Mamat, M. B. Automated car breaking system using fuzzy logic controller. Retrieved on 4 December 2014, from http:// umpir.ump.edu.my/74/, 2007.
[19] Kurnaz,S., Cetin O.,Kaynak O.(2009). Fuzzy logic based approach to design of flight control and navigation tasks for autonomous unmanned aerial vehicles, J Intell Robot System.
[20] Yang, J. (2013). Research and Design of Hotel Management System Model, International Conference on Education Technology and Information System (ICETIS).
[21] Casanova, M. A., Barbosa, S. D. J., Breitman K. K., Furtado, A. L. (2012). Three Decades of Research on Database Design at PUC-Rio, Journal of Information and Data Management, 3 (1) 19–34.
[22] Dev H., Seth, A. (2012). MDA based approach towards design of database for banking system. International Journal of Computer Applications, 49 (16) 0975 –8887.
[23] Umoh, U. A., Nwachukwu, E. O., Umoh, A. Isong, E. B. (2012). A web-based database system: an industrial application. Research Journal in Engineering and Applied Sciences, 1(3) 203-208.
[24] Adusei, I., Kuljaca, O., Agyepong, K. (2010). Intelligent mammography database management system for a computer aided breast cancer detection and diagnosis. International Journal of Managing Information Technology (IJMIT), 2(2), May 2010. [25] Khan, R. S., Saber, M. (2010). Design of a hospital-based database system (a case study of BIRDEM). International Journal on Computer Science and Engineering (IJCSE), 2 (8) 2616-2621.
[26] Cushing, J. B., Nadkarni, N., Finch, M., Fiala, A., Murphy-Hill, E., Delcambre L., Maier, D. (2007). Component-Based End-User Database Design for Ecologists, J Intell Inf Syst.
[27] Jui-Lin Lu, E., Cheng, Y. Y. (2004). Design and implementation of a mobile database for java phones. Computer Standards & Interfaces, 26, p. 401–410, 2004.
[28] Song, I. Y., Whang, K. Y. (2000). Database design for real-world e-commerce systems. IEEE Computer Society Technical Committee on Data Engineering, 23 (1) 23-28.
[29] McCarthy, D. R., Dayal, U. (1989). The architecture of an active database management system. ACM SIGMOD international conference on Management of data, 18 (2) 215-224.
[30] Finkelstein, S., Schkolnick, M., Tiberio, P. (1988). Physical database design for relational databases. ACM Transactions on Database Systems (TODS), 13 (1) 91-128.
[31] Kwan, E. Designing databases using a customized SAS/AF® frame entry application.
[32] Sentarli, I., Erdursun, A., Caman, D. Development of a database management system design involving quality related costs. Lund University, Campus Helsingborg.
[33] Li Ying., Cheng Li Ling., Research on Spatial Database Design and Tuning Based on Oracle and ARCSDE.
[34] Karsak, E. (2004). Fuzzy multiple objective programming framework to prioritize design requirements in quality function deployment. Computers & Industrial Engineering, 47, p. 149–163.
[35] Retrieved on 5 December 2014, from www.techopedia.com/entity-relationship-diagram-erd. [36] Retrieved on 8 December 2014, from databasemanagement.wikia.com/wiki/Relational notation
![Figure 1. Phases of Quality Function Deployment [34]](https://thumb-us.123doks.com/thumbv2/123dok_us/8688905.2350595/4.918.334.600.279.660/figure-phases-of-quality-function-deployment.webp)