Data Visualization Using Google Maps:
the Hard Way and the Easy Way
Shailesh Shrestha a* and Franz-Josef Behr b a
Photogrammetry and Geoinformatics, University of Applied Sciences Stuttgart Schellingstraße 24, D-70174 Stuttgart (Germany), [email protected]
b
Department of Geomatics, Computer Science and Mathematics, University of Applied Sciences Stuttgart
Schellingstraße 24, D-70174 Stuttgart (Germany), - [email protected]
KEYWORDS:
Data Visualization, Google Maps API, Google Fusion Table
ABSTRACT:
Commercial mapping tools and Geographic Information Systems (GIS) are often quite costly and out of reach of many Non Governmental Organisations (NGOs) which operate on low budget. However, emergence of freely available spatial tools over past few years has propagated the use of spatial information to a broad range of users. One of these tools, Google Map API has revolutionized online mapping service to display and integration of spatial data in a lot of different ways. But it is still a daunting task to display spatial data in Google Map for people who do not have knowledge about programming languages.
This paper aims to introduce Google's Fusion Table, cloud-based service for data management and integration, as an easy tool to visualize data quickly and easily without almost any prior programming knowledge required. At the beginning, brief description of displaying point data with the use of Google Maps API based on Flash will be given which is followed by much simple and straight forward method using Google Fusion Table visualization approach.
There are some limitations associated with Fusion Table but this is not a hindrance for people who are happy to visualize the data with few clicks in a graphical way with no database setup costs. Therefore Google Fusion Table can be especially advantageous for people with no programming experience and for organizations operating on low budget.
1 Introduction
Commercial mapping tools and Geographic Information Systems (GIS) are often quite costly and therefore out of reach of many Non Governmental Organisations (NGOs) which operate on low budget. However, the emergence of freely available spatial tools and web mapping applications over the past few years has propagated the use of spatial information to a broad range of users. Nowadays, there are several free tools and so-called mash-ups (Purvis et al. 2006, Udell 2008) exposing their application development interface (API), which can be utilized for disseminating and processing of spatial information. One of these tools, Google Maps API has revolutionized online mapping service to display and integration of spatial data in a lot of different ways. It allows users to embed Google Map in own websites and with some programming knowledge opens a wide array of possibilities to create robust and interactive maps.
Users and developers have widely embraced this API according to their requirements and hence Google Map has established itself as a pioneer among the online mapping service. Since its inception, Google Maps API makes use of JavaScript as a scripting language for programming. In Nov 2008, Google has released new version of Google Maps API based on Flash (http://code.google.com/intl/en-EN/apis/maps/documentation/flash/) which uses XML based vocabulary language named MXML and ActionScript. But it is still a daunting task to display spatial data in Google Map for people who do not have knowledge about programming languages.
This paper aims to introduce Google's Fusion Table (http//tables.googlelabs.com/), a cloud-based service for data management and integration, as an easy tool to visualize data quickly and easily without almost any prior programming knowledge required. Google Fusion Table is a cloud based data management and integration service supporting collaboration among multiple users and has since received considerable use (Gonzalez et al.,
2010). The term cloud computing denotes the concept to use different kinds of computing resources (e.g., services, storage …) through the web1.
For the examples provided here, a text file in CSV format is used containing information about 76 points of interest (POIs) around the Stuttgart University of Applied Sciences containing attributes such as latitude, longitude, address, website and type of place.
2
Data visualization using Google Maps API for Flash
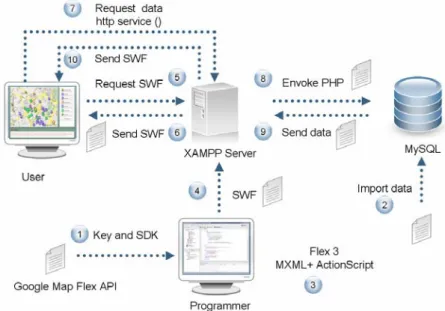
The Google Map API for Flash (http://code.google.com/intl/en-EN/apis/maps/documentation/flash/) allows users to add more dynamic and interactive mapping application to their website. To use Google Maps API for Flash, users must obtain a mandatory API Key from Google. The process is rather simple and straight forward. Users need to provide the URL of the site that would use the application to be developed and need to have a Google account. After this process, SDK was downloaded from Google’s website which contains all necessary class libraries (ActionScript library made of public class of Maps API as SWC file) necessary to develop application utilizing the Flash environment. For development of simple interface and embedding of Google Maps API for Flash, Flex Builder 3 software was used. It provides WYSIWYG type of design interface where lots of pre-built components can be simply drag and drop to create an interface. It uses the XML based mark-up vocabulary MXML for creating interface and the programming language called ActionScript for capturing user interaction and response. A good introduction to develop application with Flex can be found in Cole (2008). The overall steps for creating a simple application using Flex Builder 3 utilizing Google Maps API for Flash is shown in figure 1. Each communication is denoted by sequential numbering in which it takes place.
Figure 1: Steps in preparing simple webage with Google Maps API for Flash with MySQL backend
2.1 Establishment of XAMPP and MySQL Database
The web server tier is established by downloading XAMMP installer (http://www.apachefriends.org/en/xampp-windows.html) which is a free and open source cross-platform webserver package. The XAMMP package comes with MySQL database management system and PHPMyAdmin. Before importing data in the MySQL database, it is very important to set up a structure of a table specifying the data types for each column. Afterwards the data were imported into MySQL database.
2.2 Outputting Data as XML with PHP
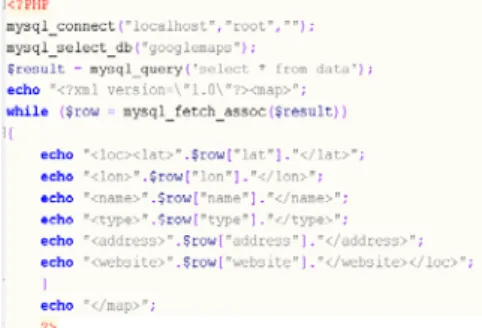
To retrieve the data from MySQL database, a PHP script was written. For the Flex environment, it is only possible to pass external data as XML format. Creating a XML format data from the database is possible either
using server’s PHP dom_xml functionality which will result in saved XML data or using PHP’s echo function. The second method was chosen over the first one because of familiarity of the author with the second method. A PHP file was created utilizing simple mysql_connect, mysql_select_db and my_sql_query commands of PHP.
Figure 2: PHP file to extract data from MySQL database
2.3 Initialization of Map
A single panel was created in Flex Builder, and Google Map was added as child of application tag (see Fig. 3) . A namespace was assigned so that to link with ActionScript. The height and width attributes of the map child were set. The displayed map is still conveying standard data layers.
Figure 3: Embedding map (MXML) and initializing map with added controls (ActionScript)
To extract the data from the server and display those data as custom markers, a httpservice ( ) function of Flex which allows to communicate with the server was defined. With this service, the application calls the PHP file described above to access the data residing in the MySQL database which returns an array of data as output. To loop through that array and extract the data, a function which reads the array line by line and stores the required values in a variable was written. For the purpose of displaying markers as different recognizable icon based on type, some images were downloaded from a website maintained by Mollet and Stasiak (2010) which contains huge collection of beautiful custom markers and were embedded in Flex as an object array. A custom function named createMarkes ( ) which takes five parameters of different types as input and actually is used to create the markers. In additions, it creates the information window that will pop-up if a mouse click event occurs on the marker (see Fig. 4 and Fig. 5).
Figure 5: Google Map displaying different places of interest in custom icons
As shown above each marker is displayed with a custom icon indicating the corresponding category of the POI. For example, bars are represented by a blue icon containing a glass full of beer, and libraries are represented by an orange icon containing stacks of books etc.
As can be seen, displaying point data with Google Maps API for Flash encompasses several steps and is not an easy and straight forward process. One must be familiar with different programming language like PHP, MXML and ActionScript together with server side technology, e.g., Apache HTTP server and MySQL database management system. Many experts from field of Geoinformatics may be familiar with these technologies, whereas for a person working in a NGO with limited educational background, such concepts might be too complex.
In the following sections, data visualization of same point data is shown but now with a simple and straightforward process with Google Fusion Table.
3
Data visualization using Google Fusion Table
Google Fusion Table is the newest addition in the wide range of already available Google's Geo Tools. With the introduction of this approach in June 2009 by Google Labs, Google has opened its computing capabilities for web based data management system. User can upload their data and can instantly create business graphics like bar charts, pie charts, timeline etc. and other map visualization to display spatial datasets on Google Maps. Primarily developed as a data management system it enables collaboration among different organizations and facilitates integration of data from multiple resources by means of joining tables to gain new insight into already existing data. In current version of Google Fusion Table, user can upload data up to 100 MB per data set limited to 250 MB per user (Halevy 2009).
3.1 Uploading the Data
The first step is to upload the data in the Google Fusion Table. For this, users need to have a Google account. After logging in users have an opportunity to upload data in various formats like xls, xlsx, csv, ods and kml. The limit for file size is different for each format, ranging from 1 MB for ods, xls and xlsx to 100 MB for kml and CSV data type. Our data which is in CSV format can be easily loaded in Google Fusion Table. The snap shot of loaded data in Google Fusion Table is shown in figure 6. After loading the data, users can instantly visualize data in different charts form using different columns of the data. It is also possible to merge the data with already existing data that are shared by other people. These parts are not covered in this paper.
Figure 6: Importing data into Google Fusion Table
3.2 Column Configuration
Next step is to do some configuration that Google Fusion Table knows which column is used to geocode the POIs. In most cases, Google Fusion Table automatically detect when a column contains information that specifies location information such as latitude-longitude pair or an address. But it is always good to manually define columns which have location information or at least to cross check. In our case, we have location information in two different columns named Longitude and Latitude. To define these columns as location information, Modify column from Edit menu is clicked and Longitude and Latitude columns are assigned as type
location (c.f. figure 7Figure ). Since location information in the form of addresses is also available, we can also use that information to geocode instead. However for that purpose the address information has to be in one column such that street, city and zip information are separated by space. This can be easily achieved in Microsoft Excel by using concatenate function. For example, formula concatenate ( E2, " ", F2) will concatenate the text in column E and F with a space in between.
3.3 Visualize the Map
Now everything is set for visualizing the data. Directly The graphical user interface allows the immediate visualization of the POIs including controls such as zooming, panning and layer selection. Points are displayed as default red markers. When clicked, all the information associated with that markers pop up. With few clicks, without use of any programming knowledge and short time, users now have a tool at their disposal which can be used for different purposes. However it has to be realized that it has some limitations such as it cannot be customized as in a way which is possible in Google Maps API and Google Map API for Flash. For example user cannot choose a specific point as centre of map display and specify different types of markers for different objects as shown in Figure . Nevertheless most often people are more than happy to have an ability to display spatial data in the form as shown in figure 8. With the map, user can control the information to be displayed in
Info Window by using six inbuilt templates by using Configure Info Window or user can easily get embedding code by clicking Get Embeddable Link or user can export it as a KML (Keyhole Markup Language) to view the data in Google Earth and perform some customization such as changing the icon type and adding organization's logo as static layer.
Figure 7: Configure columns in Fusion Table Figure 8: Visualization in Google Map using Fusion Table
3.3.1 Configure Info Window
If a user is familiar with the HTML, many customizations can be done on Info Window of markers to display information once a marker is clicked. Wide array of possibilities are there such as adding descriptive text, link and images with little bit of HTML coding. All the columns in a table in Google Fusion Table are available as fields which can be initiated in the HTML code. A small customization example is given in figure 9. With few HTML tags, only Name, Type and Website information as hyperlink are displayed in the Info Window. If we have a column containing images location associated with markers that are available through internet, then it could be easily incorporated in the Info Window with single addition of HTML tag <img src="{Image}" alt="{Name}"/>.
Figure 9: Customization of Info Window with HTML tags
3.3.2 Export to KML
There is an option for exporting the map created in the Google Fusion Table as KML which can be viewed on any computer with internet access with installed Google Earth application. Thus exported KML file can be easily viewed by just double clicking in the file and also can easily shared with other people. KML is an XML format originally created in 2001 which has since evolved as international standard for visualization of geographic data (Wernecke, 2008). With simple addition of few lines, user has the possibility of changing the marker type and adding institutional logo as overlay on Google Earth which is shown in figure 10. In the code HfTLogo.gif is a custom logo of HFT Stuttgart and info.png is a custom type marker downloaded from website maintained by
Mollet and Stasiak (2010). These files should reside within the same folder containing the KML file and can be zipped as KMZ file. Zipping as KMZ file ensures that every linked file with KML file is also transferred with the KMZ file. Wernecke (2008) gives excellent detailed information about KML with amazing things that can be achieved with KML.
Adding custom instutional logo and custom marker Visualization of KML export from Google Fusion Figure 10: Little customization in the KML
3.3.3 Get embedded link and integrate with user website
After creating map with Google Fusion Table, it is very easy to embed it into own website. It is enough just to copy ethe URL from the Get Embeddable Link and paste it in a desired website. The example of an embedded map, presented in figure 11, can be seen online by visiting http://shreshai.blogspot.com/2010/07/embedded-link.html. Such a blogging facility can be convenient for inexperienced users – the time needed for basic setup of the blog and to incorporate the embed link is less than five minutes.
3.4 Visualization with Google Fusion Table Choropleth
Choropleth, which are frequently used in cartography, is a colour coded map comparing region with each other. With Google Fusion Table, it is possible to display a choropleth map and embed it in a website with ease. Choropleth for the whole world or for a particular country can be created. Basically, the name of the country or states is used for the geocoding purpose. For the illustration purpose, data related to area of each states of the Germany which is available at http://www.citypopulation.de/Deutschland-Agglo.html#Land was directly accessed from Microsoft Excel with From Web tool (xls file format). The file was uploaded to Google Fusion Table and visualized as intensity map. Data can be displayed as Regions or as Markers as shown in Figure. Both choropleths can be viewed on the authors blog mentioned above.
Data displayed as regions Data displayed as markers Figure 11: Choropleth map made with Google Fusion Table
In such maps, user can hover each region and instantly view the data associated. Some inaccuracies were observed in the both maps. In the region based choroplethmap, one state was not geocoded at all whereas when the same data is displayed as markers, three states (!) were geocoded within the state of Bavaria. However such discrepancies were not observed when choropleth maps in the global scale were made.
If such a choropleth map should be made in Google Maps API for Flash using scripting language, the developer should be highly proficient in MXML and ActionScript as well. In addition, it would also take considerable long time. Process of making choropleth using Google Fusion Tables is very easy. Nevertheless, it is sad that Google has not provided option of selecting different colour scheme. It always use default green colour scheme. Moreover, legends which are visible when visualizing in Google Fusion table vanishes when the embedded code is copied and pasted in user’s own website.
4
Issue of data security and state of Google Fusion Table
Initial step for visualizing own data is to upload the data in the Google Fusion Table. It can be shared to public or can be shared to limited people desired by the up loader. User can later delete the data however data might never be deleted from the Google database. Hence, there is a prime concern about the data security issue and many people are often reluctant to use such services. Therefore it is wise not to use Google Fusion Table for visualization of very confidential data. In addition when requesting for embeddable link, it is mandatory to choose visibility option of the table as Public or Unlisted. In the Unlisted mode only person who has link of the table (Fusion Table provides link for each table) can access the data but there is still a risk that a person with link can forward that to an unauthorized person.
As mentioned in the introduction, Google Fusion Table was released by Google Labs, which is a platform to test different ideas by Google Engineers. Hence it is officially in “Beta Version”. Therefore it is suggested not to plan big projects using Google Fusion Table. There is a possibility that any of the experiments may be unavailable in near future or even removed completely.
5 Conclusion
Developing Google Map applications using either Flex or Javascript involves different programming languages. However it offers much more customization possibilities than with Google Fusion Table. There is also no concern about the data security when using Google Map API as the data resides on the local server. On the other hand Google Fusion Table offers a simple and straight forward interface to create interactive maps for non-programmers with no need of database setup. There are some limitations associated with Fusion Table, but this is not a hindrance for people who are happy to visualize the data with few clicks in a graphical way at no cost. Therefore Google Fusion Table can be especially advantageous for people with no programming experience and for organizations operating on low budget. Really cool applications can be made by just using the graphical interface of Fusion Table. However it is possible to integrate Fusion Table with Google Maps API and Google Maps API for flash through Google Fusion Table API. But doing so, Fusion Table will also be yet another "rocket science for non programmers". Since, Google Fusion Table is still in the development stage, there are some deficiencies as illustrated by the chloropleth map of states of Germany.
References:
Cole, A., 2008. Learning Flex 3: Getting Up to Speed with Rich Internet Applications. O’Reilly Media, First edition
Gonzalez, Alon Y. Halevy, Christian S. Jensen, Anno Langen, Jayant Madhavan, Rebecca Shapley, Warren Shen, Jonathan Goldberg-Kidon 2010: Google Fusion Tables: Web-Centered Data Management and Collaboration. http://www.google.com/buzz/goog.research.buzz/3Nf2QjBos2s/Google-Fusion-Tables-Web-Centered-Data-Management [2010-07-22]
Halevy, A., 2009. Google Fusion Tables, User Experience
http://googleresearch.blogspot.com/2009/06/google-fusion-tables.html [20 July 2010] Mollet, N. and Stasiak, M., 2010. Google - Maps-icons.
http://code.google.com/p/google-maps-icons/ [accessed 20 July 2010]
Purvis M., Sambells J., Turner C., 2006: Beginning Google Maps Applications with PHP and Ajax: From Novice to Professional. Apress
Udell S., 2008: Beginning Google Maps Mashups with Mapplets, KML, and GeoRSS: From Novice to Professional. Apress
Wernecke, J., 2008. The KML Handbook: Geographic Visualization for the Web. Addison-Wesley Professional, First edition