EDUCATION
Trends in salaries of obstetrics-gynecology
faculty, 2000-01 to 2008-09
William F. Rayburn, MD, MBA; Anne M. Fullilove, MIS; James A. Scroggs, MHA; Ronald M. Schrader, PhD
OBJECTIVE:We sought to determine whether downward trends in in-flation-adjusted salaries (1989-99) continued for obstetrics and gyne-cology faculty.
STUDY DESIGN:Data were gathered from the Faculty Salary Survey from the Association of American Medical Colleges for academic years 2001 through 2009. We compared median physician salaries adjusted for inflation according to rank and specialty.
RESULTS:While faculty compensation increased by 24.8% (2.5% an-nually), change in salaries was comparable to the cumulative inflation rate (21.3%). Salaries were consistently highest among faculty in
gyne-cologic oncology (P⬍.001), next highest among maternal-fetal medi-cine specialists (P⬍.001), and were not significantly different between general obstetrics-gynecology and reproductive-endocrinology-infertil-ity. Inflation-adjusted growth of salaries in general obstetrics-gynecol-ogy was not significantly different from that in general internal medicine and pediatrics.
CONCLUSION:Growth in salaries of physician faculty in obstetrics and gynecology increased from 2000-01 through 2008-09 with real pur-chasing power keeping pace with inflation.
Key words:compensation, faculty, salaries
Cite this article as: Rayburn WF, Fullilove AM, Scroggs JA, et al. Trends in salaries of obstetrics-gynecology faculty, 2000-01 to 2008-09. Am J Obstet Gynecol 2011;204:82.e1-6.
P
atient care– generated revenue at ac-ademic health centers is important to any clinical department, especially those such as obstetrics and gynecology that depend heavily on clinical rather than on research or educational dollars. Since the mid-1990s, intensified price competition by payers has led to a flat-tening or decline in reimbursementsfrom both public and private payers.1 Any reduced reimbursement per unit of service can be detrimental to faculty re-cruitment and retention and to certain mission-based activities with fixed costs. In light of changes in patient care re-imbursement, we may expect to see little growth in the salaries of academic physi-cians. A report by the Association of American Medical Colleges (AAMC) found that overall growth rates of clinical faculty salaries increased slightly above inflation from 1988 through 1998.2Of particular importance was the finding that departments of obstetrics and gyne-cology lost the most ground in total compensation during this time. While actual average salaries did not decline, they did not keep pace with inflation. No explanation was provided in that report for this decline.
The objective of the present investiga-tion was to examine trends in salaries of academic obstetrician-gynecologists since that report. An extensive salary database was used to determine whether downward trends in faculty salaries and differences in salary growth rates across specialty groups continued or were reversed. We also exam-ined whether changes in total compensa-tion for general obstetrician-gynecologists
varied from general faculty in other core teaching specialties.
M
ATERIALS ANDM
ETHODSThe conduct of this investigation was approved by our 2 institutional re-view boards (University of New Mexico Human Research Review Committee no. 08-442; American College of Obstetri-cians and Gynecologists institutional re-view board no. IRB00003428). Data were obtained using the Faculty Salary Survey of the AAMC. Since the early 1960s, the survey has been the most comprehensive source of the total compensation attrib-uted to teaching, patient care, and re-search by faculty in MD-granting ac-credited allopathic schools in the United States. This survey includes full-time fac-ulty at university-based programs and private programs with university affilia-tions. Data for total salaries of the board-certified subspecialties (gynecologic on-cology, maternal-fetal medicine, and reproductive endocrinology) were first published in the survey in 2002 for the academic year 2000-01.3
During the fall of every academic year (July 1 through June 30), the AAMC dis-tributes the same web-based survey to all accredited US medical schools.3 The principal business officer at each medical
From the Council of University Chairs of Obstetrics and Gynecology (Dr Rayburn) and the Health Economics Department (Mr Scroggs), American College of Obstetricians and Gynecologists, Washington, DC, and the Clinical Translational Science Center, University of New Mexico School of Medicine, Albuquerque, NM (Ms Fullilove and Dr Schrader).
Received May 7, 2010; revised July 2, 2010; accepted Aug. 24, 2010.
Reprints not available from the authors. This study was supported in part by the American College of Obstetricians and Gynecologists; Medical Applications of Research, National Institutes of Health; and Grant no. R60 MC 05674 from the Maternal and Child Health Bureau, Health Resources and Services Administration, Department of Health and Human Services, Washington, DC. 0002-9378/$36.00
© 2011 Mosby, Inc. All rights reserved. doi: 10.1016/j.ajog.2010.08.047
school, or his or her designees reports each faculty member’s pretax total com-pensation, along with the faculty mem-ber’s degree, academic rank, and pri-mary department/specialty affiliation. Real-time edit checks as well as post-up-load edit checks by the AAMC flag those salaries that fall outside the expected range for a particular combination of de-gree, department/specialty, and rank. These medical schools are requested to verify or correct the questionable com-pensation data. This salary information, gathered each October, is then summa-rized in tables in the annual Report on Medical School Faculty Salaries, which is distributed in January.4
Total compensation for every faculty member included the fixed or contrac-tual salary, variable (supplemental and bonus or incentive pay) components, and outside earnings, for consistency in making comparisons. Fixed or contrac-tual salary was compensation (exclusive of fringe benefits) that was set at the beginning of the fiscal year and
contrac-tually obligated assuming standard satis-factory performance. The medical prac-tice supplement was income that is not fixed at the beginning of the fiscal year but is directly tied to the amount of pro-ductivity during the year. Data on bonus or incentive pay, earned as a result of achieving specific performance goals, were collected on all eligible faculty. Outside earnings were self-reported and unregulated outside income related to the health professions (eg, patient ser-vices income, royalties, and consulting fees). Also reported were faculty contri-butions to salary reduction programs for retirement (eg, 403B/Tax Sheltered An-nuity plans). Employer contributions to retirement plans and additional benefits provided by the institution, such as tu-ition benefits and employer-paid health, life, and disability insurance, were ex-cluded. Salaries of new faculty whose ap-pointments began beyond the beginning of the academic year were converted to an annual equivalent.
This investigation examined pub-lished data on rank (assistant professor, associate professor, professor, chair) and discipline (general obstetrics-gynecol-ogy, gynecologic oncolobstetrics-gynecol-ogy, maternal-fe-tal medicine, reproductive endocrinol-ogy). The AAMC Faculty Salary Survey has not yet distinguished the evolving specialty urogynecology from general obstetrics-gynecology because of the lack of board certification. We included only full-time faculty at university-based or university-affiliated departments who were MDs, MD equivalents (eg, DOs), and MD/PhDs. PhD faculty in obstet-rics-gynecology were excluded because they constituted a small percentage of the total faculty, and their salaries were more consistent with those in basic sci-ence departments. As a result of these ad-justments, not all faculty were included (usually 70% from all schools), although we agree with Studer-Ellis et al2who crit-ically reviewed the AAMC Faculty Salary Survey and found the data to represent the faculty overall.
TABLE 1
Number of full-time obstetrics-gynecology faculty at all U.S. medical schools whose compensation was reported by division and rank, academic years 2000
Full-time faculty per academic years
Division/Rank 2000–01 2001–02 2002–03 2003–04 2004–05 2005–06 2006–07 2007–08 2008–09 General ob-gyn ... Assistant Professor 452 509 522 565 611 653 687 725 796 ... Associate Professor 230 202 199 235 252 257 283 304 312 ... Professor 163 157 141 155 156 145 155 166 168 ... Gynecologic-oncology ... Assistant Professor 53 54 58 82 85 84 74 76 74 ... Associate Professor 40 40 44 42 43 52 56 75 72 ... Professor 37 42 38 44 52 53 56 58 52 ... Maternal-fetal medicine ... Assistant Professor 109 115 129 123 144 151 152 155 181 ... Associate Professor 80 99 91 103 107 122 133 133 136 ... Professor 71 68 63 69 80 89 88 98 112 ... Reproductive-endocrinology ... Assistant Professor 42 57 54 47 45 48 52 61 72 ... Associate Professor 44 60 61 62 58 71 68 69 59 ... Professor 41 40 36 36 37 41 41 53 45 ...
Salaries for each faculty rank and de-partment/specialty were reported at the median or 50th percentile, which corre-sponded to the salary below which half of all salaries appeared. Median salaries were used rather than mean, since the median is less influenced by unusually high or low compensation outliers. We also assessed the percent change in me-dian salaries from year to year for faculty in general obstetrics-gynecology with general practitioners in other core clini-cal departments through which mediclini-cal students rotated during their initial clin-ical clerkships.
We examined compensation levels that were unadjusted and adjusted for inflation. The Consumer Price Index (CPI), an economic indicator deter-mined monthly by government econo-mists at the Bureau of Labor Statistics of the US Department of Labor, was used as a means of adjusting dollar values.5 While sometimes referred to as an index of inflation or cost of living, the CPI is actually a measure of the average change over time in the price paid by urban households for a set of consumer goods and services (real purchasing power). We used the CPI-U (CPI-urban), since it reflected the spending patterns of all-ur-ban consumers, which represent about 87% of the US population and most US medical school locations.5
Data from the AAMC Report on Medical School Faculty Salaries were entered into a spreadsheet and coded by academic year, designated AAMC geographic region (northeastern, south-ern, midwestsouth-ern, western), whether the school was public or private, and faculty rank and department division. Data were aggregated in such a way that it was pos-sible only to cross-classify by public/pri-vate and rank or by geographic region and rank. Data included the number of schools, mean, median, and quartiles in each aggregate. SDs were not available in the data but were estimated using the consistent estimator for normal distri-butions defined by (interquartile range)/ 1.35. Multiple comparisons employed Bonferroni adjustments. Student t test was used to establish differences between faculty salaries in 2000-01 and 2008-09.
Statistical significance was set at the␣⫽ 0.05 level.
R
ESULTSThe number of full-time faculty in ob-stetrics-gynecology for each academic year is shown in theTableaccording to division and rank. The number of faculty rose steadily in each division, most nota-bly in general obstetrics-gynecology. There was a 51.0% growth during this period among general obstetrics-gyne-cology faculty, being heavily weighted on assistant professors (76.1% growth) vs professors (4.4% growth).
During the 9-year period beginning in academic year 2000-01, faculty salaries in obstetrics-gynecology rose by 24.8% overall. This increase in compensation averaged to be 2.5% annually (account-ing for compound(account-ing), which was high-est in academic year 2002-03 and lowhigh-est in 2008-09. The cumulative inflation rate during this period was 21.3%, so the net
change in salaries was only 3.5% above inflation during this 9-year period.
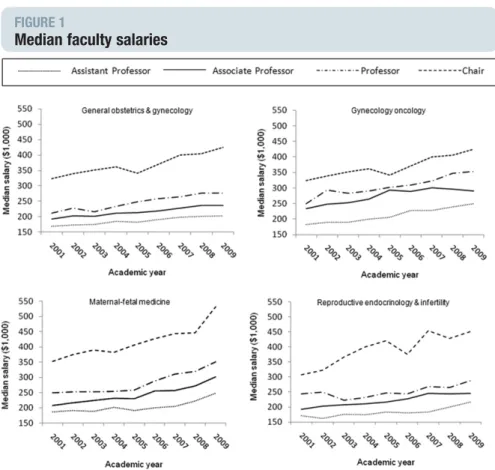
Figure 1displays median salaries, un-adjusted for inflation, for each academic year for every specialty according to fac-ulty rank. While salaries increased over-all in each specialty throughout the ranks, this growth was lowest in general obstetrics-gynecology and in reproduc-tive endocrinology. Gynecologic on-cologists consistently had the highest compensation rates. The greatest ranges in median salaries between assistant and full professors were in gynecologic-on-cology and maternal-fetal medicine, and least in general obstetrics and gynecol-ogy. Nearly all chairs were professors. A large difference in median salaries ex-isted between chairs and professors, re-gardless of specialty (Figure 1).
Figure 2 displays the average annual change in compensation for each obstet-rics-gynecology specialty during this 9-year period after adjusting for infla-FIGURE 1
Median faculty salaries
Trends in median salaries of obstetrics-gynecology faculty for all US medical schools from academic years 2000-01 through 2008-09, according to their rank and specialty.
tion. Compensation rates for faculty in general obstetrics-gynecology and in re-productive endocrinology were not sta-tistically different from the inflation rate. The change in adjusted compensation was slightly below inflation for assistant professors in general obstetrics-gynecol-ogy and for professors in reproductive endocrinology, although not signifi-cantly different from the 0 baseline (inflation rate). Compared with salaries of their counterparts in general obstet-rics-gynecology, a significantly greater change (P⬍.05) was seen among assis-tant professors in gynecologic-oncology and maternal-fetal medicine and associ-ate professors in massoci-aternal-fetal medi-cine. These differences did not, however, meet the multiple comparison criterion for significance.
Changes in compensation for faculty in general obstetrics and gynecology were similar to changes for generalists in other core clinical teaching depart-ments. Figure 3 compares average an-nual changes in inflation-adjusted com-pensation from academic year 2000-01 through 2008-09 for those departments. Only faculty in psychiatry and general surgery saw median salary increases above the inflation rate. The growth in faculty salaries of general obstetricians-gynecologists did not differ significantly from the inflation rate, and only family medicine saw a significant loss of pur-chasing power during this 9-year period.
C
OMMENTThis investigation was undertaken in re-sponse to a concern about the reported rapid turnaround in salaries of physician faculty in obstetrics and gynecology.2No explanation was given for this decline during the 1990s decade. Data reported here for the 2000s suggest that overall faculty salaries in obstetrics and gynecol-ogy increased at a rate comparable or slightly better than inflation. Change in compensation was also similar to general faculty in other core specialties. These findings reported will serve faculty, chairs, and deans in planning future in-centive– based compensation plans and in recruitment initiatives. We found that actual average salaries did not decline, FIGURE 2
Change in inflation-adjusted compensation for ob-gyn faculty
Average annual change in inflation-adjusted compensation from academic years 2000-01 through 2008-09 for obstetrics-gynecology (ob-gyn) faculty according to specialty and rank (*P ⬍.05 compared with cumulative rate of inflation using Bonferroni correction).
MFM, maternal-fetal medicine;REI, reproductive-endocrinology-infertility.
Rayburn. Salaries of faculty. Am J Obstet Gynecol 2011.
FIGURE 3
Change in inflation-adjusted compensation for faculty
Average annual change in inflation-adjusted compensation from academic years 2000-01 through 2008-09 for faculty in general obstetrics-gynecology (ob-gyn) and for general faculty in other core teaching specialties (*P⬍.05 compared with cumulative rate of inflation using Bonferroni correction).
and that adjusted compensation for gen-eral obstetrics-gynecology and repro-ductive-endocrinology kept pace with inflation. Any faculty compensation be-low the inflation rate reported during this time, such as for professors in repro-ductive endocrinology, may have resulted from reduced physician service, fewer sur-geries, more faculty turnover, and profit-able assisted reproductive technology moving to the private sector.1,2
A growing body of anecdotal evidence suggests that clinical faculty are spending more time in patient care (at the expense of time for teaching and research) to maintain strained departmental bud-gets.6It could be argued that growth in salaries during this period would be less than shown here if faculty members and institutions were not making these ad-justments.7 This coincides with a time in which department sizes are growing, mostly with physician faculty who are pre-dominantly generalists.8 Performance-based incentive compensation plans that prevail in industry are gaining more atten-tion at academic health centers.9
The change in adjusted compensation was lower than desired for assistant pro-fessors in general obstetrics-gynecology. A “revolving door” phenomenon is of-ten seen wherein recent residency grad-uates are retained temporarily. It may also represent general obstetrician-gyne-cologists leaving private practice and joining faculty positions secondary to economic and medicolegal pressures. Entry-level faculty replacements were not guaranteed to receive the same or higher adjusted income. The data indi-cate the relative worth of faculty posi-tions in aggregate over time. Salaries of individual faculty include income from promotion, merit raises, and time spent in patient care activities. Each of these factors was not studied independently by the AAMC. Furthermore, we examined rank only and could not determine the change in salary satisfied by either years of practice or the faculty member’s age.
Faculty members may view with cyni-cism the finding that their salaries are quite less and that their salary growth rate was lower than that for department chairs. The roles of a department chair as a chief financial officer and labor market
pressures to adequately compensate top administrators may be dictating these salary increases.9,10Demands of manag-ing medical school clinical departments appear to be more difficult than ever. The rising cost of recruiting and the shorter tenure of contemporary chairs remain challenges at all schools.11
A few limitations are noteworthy about the survey. It does not include tu-ition remissions, fringe benefits, and professional liability insurance to con-trol for variability between medical schools. Tuition benefits are readily documented in the Institutional Policies Search Tool (http://www.aamc.org/ members/facultyaffairs/resources.html). Professional liability costs are not intended to be part of the compensation determina-tion, although it is an important consider-ation in recruitment and in determining overall costs of maintaining a proper fac-ulty size. The Facfac-ulty Salary Survey reports only total compensation, and fixed vs vari-able salary components. While gender eq-uity issues are important, the survey does not collect such data at the national level. Outside earnings were self-reported and may be a significant source of variability. Physicians with higher academic rank are more likely to have this additional income and may not report it. Lastly, the inclusion of urogynecology, a primarily surgical spe-cialty, into the general obstetrics-gynecology faculty group could skew the presentation of the salaries.
The selection of time periods to study is one of many possible constructions. We acknowledge that changing the start-ing years, the endstart-ing years, or both, as well as the number of years covered, can affect salary growth determinations. We chose to investigate the 2000 through 2009 period because that was when the AAMC Faculty Salary Survey started to collect subspecialty data in obstetrics-gy-necology. This period also permitted us to use the most recent salary data for more than a standard time period (9 years rather than 5 years).
The finding that faculty salaries in all specialties in obstetrics and gynecology kept pace with or were slightly greater than inflation is encouraging. From 1995 through 2003, a private practitioner’s av-erage net income declined by 6-7% after
adjusting for inflation according to na-tional studies from the Nana-tional Bureau of Economic Research and the Center for Studying Health System Change.1,12 Among different types of community physicians, primary care providers fared the worst with a 10.2% decline in infla-tion-adjusted income and general sur-geons’ real income declined by 8.2% during this period. Flat or declining fees from both public and private payers were a leading factor underlying declining real incomes for physicians.1Since the mid-1990s this downward trend in incomes is likely to be an important reason for any mounting unwillingness by physicians to undertake pro bono work, including charity care and serving on hospital committees, which are common respon-sibilities of faculty.
In conclusion, trends in salary growth rates of faculty in obstetrics and gynecol-ogy from 2000 through 2009 revealed a reversal of downward trends previously reported. Median salaries increased for both generalist and specialist faculty. Al-though minimal when considered on an annual basis, growth in purchasing power was seen in maternal-fetal medi-cine and gynecologic-oncology but not for general obstetrics and gynecology and reproductive endocrinology. Over-all change in adjusted compensation in general obstetrics and gynecology is sim-ilar to general practitioners in other core clinical departments. Findings reported here serve faculty, chairs, and deans in planning future incentive-based com-pensation plans and in recruitment ini-tiatives. During this time of economic unrest, we plan to examine these trends more closely and compare salary levels of academic physicians by specialty with salaries of their counterparts in private practice. The role, if any, of factors such as gender, race, tenure, years since ap-pointment, and part-time status on sal-ary determinations will be explored. f
ACKNOWLEDGMENTS
We acknowledge Hershel Alexander, PhD, at the Association of American Medical Colleges for a comprehensive explanation of the Faculty Salary Survey and for his critical review of this document.
REFERENCES
1.Tu HT, Ginsburg PB. Losing ground: physi-cian income, 1995-2003. Tracking Rep 2006; 15:1-2.
2.Studer-Ellis E, Gold JS, Jones RF. Trends in US medical school faculty salaries, 1988-1989 to 1998-1999. JAMA 2000;284:1130-5. 3.Report on medical school faculty salaries, 2000-2001. Washington, DC: Association of American Medical Colleges; 2002.
4.Report on medical school faculty salaries, 2008-2009. Washington, DC: Association of American Medical Colleges; 2010.
5.Consumer Price Index-Urban (CPI-U), Bu-reau of Labor Statistics table, annual percent
changes from 1914 to present. Available at: http://inflationdata.com/inflation/inflation_Rate/ HistoricalInflation.aspz?dsinflation_currentpage ⫽0.Accessed Feb. 28, 2010.
6.Krakower JY, Williams DJ, Jones RF. Review of US medical school finances, 1997-1998. JAMA 1999;282:847-54.
7.Implications of the evolving health care sys-tem for academic medicine. Washington, DC: AssociationofAmericanMedicalColleges;1998.
8.Rayburn WF, Anderson BL, Johnson JV, McReynolds MA, Schulkin, J. Trends in the ac-ademic workforce of obstetrics and gynecol-ogy. Obstet Gynecol 2010;115:141-6.
9.Reece EA, Nugent O, Wheeler RP, Smith CW, Hough AJ, Winter C. Adapting
industry-style business model to academia in a system of performance-based incentive compensation. Acad Med 2008;83:76-84.
10.Lively K. (2000, February 25). Administra-tors’ pay increase is biggest in 9 years. Chron-icle of Higher Education, vol. 46, Issue 25:A46.
11.Rayburn WF, Alexander H, Lang J, Scott JL. First-time department chairs at US medical schools: a 29 year perspective in recruitment and retention. Acad Med 2009;84:1336-41.
12.Staiger DO, Auerbach DI, Buerhaus PI. Trends in the work hours of physicians in the United States. JAMA 2010;303:747-53.