Quarterly Schedule of Portfolio Holdings
March 31, 2016
Schedule of Investments
(a)March 31, 2016 (Unaudited)
See accompanying notes which are an integral part of this schedule. Invesco Small Cap Equity Fund
Shares ________________________________________________________________Value Common Stocks & Other Equity Interests–95.25%
Air Freight & Logistics–0.93%
Forward Air Corp. 271,456 $ 12,302,386
Alternative Carriers–0.93%
Iridium Communications Inc. (b)(c) 1,561,205 12,286,683
Apparel, Accessories & Luxury Goods–1.26%
Columbia Sportswear Co. 275,744 16,569,457
Application Software–4.60%
Blackbaud, Inc. 230,292 14,483,064
Bottomline Technologies (de), Inc. (c) 402,013 12,257,376
MicroStrategy Inc. -Class A (c) 73,682 13,242,129
SS&C Technologies Holdings, Inc. 194,714 12,348,762
Verint Systems Inc. (c) 245,470 8,193,789
________________________________________________________________60,525,120
Asset Management & Custody Banks–1.14%
Janus Capital Group Inc. 1,028,980 15,053,977
Biotechnology–0.61%
AMAG Pharmaceuticals, Inc. (b)(c) 211,012 4,937,681
Retrophin, Inc. (c) 227,834 3,112,212
________________________________________________________________8,049,893
Broadcasting–0.86%
Nexstar Broadcasting Group, Inc. -Class A (b) 255,073 11,292,082
Building Products–2.49%
Apogee Enterprises, Inc. 395,285 17,349,059
Trex Co., Inc. (c) 323,060 15,484,266
________________________________________________________________32,833,325
Casinos & Gaming–1.17%
Boyd Gaming Corp. (c) 747,842 15,450,416
Communications Equipment–0.17%
ARRIS International PLC (c) 99,745 2,286,155
Construction & Engineering–2.71%
Dycom Industries, Inc. (c) 370,122 23,935,790
Primoris Services Corp. 482,239 11,718,408
________________________________________________________________35,654,198
Construction Materials–0.90%
Eagle Materials Inc. 168,275 11,797,760
Shares _______________________________________________________________Value
Data Processing & Outsourced Services–2.24%
DST Systems, Inc. 127,362 $ 14,362,613
Jack Henry & Associates, Inc. 178,473 15,093,461
_______________________________________________________________29,456,074
Diversified REIT's–1.08%
Cousins Properties, Inc. 1,374,100 14,263,158
Diversified Support Services–0.91%
Mobile Mini, Inc. 363,963 12,018,058
Electrical Components & Equipment–1.20%
EnerSys 264,365 14,730,418
Generac Holdings, Inc. 30,122 1,121,743
_______________________________________________________________15,852,161
Electronic Components–0.84%
Belden Inc. 180,824 11,098,977
Electronic Equipment & Instruments–0.77%
Coherent, Inc. (c) 110,068 10,115,249
Environmental & Facilities Services–2.20%
Team, Inc. (c) 296,553 9,009,280
Waste Connections, Inc. 308,827 19,947,136
_______________________________________________________________28,956,416
Gas Utilities–1.05%
UGI Corp. 341,783 13,770,437
Health Care Equipment–3.81%
Analogic Corp. 172,859 13,657,589
Globus Medical, Inc. -Class A (c) 564,453 13,405,759
Hill-Rom Holdings, Inc. 310,622 15,624,287
Wright Medical Group N.V. (c) 451,203 7,489,970
_______________________________________________________________50,177,605
Health Care Facilities–1.21%
Community Health Systems Inc. (c) 170,624 3,158,250
LifePoint Health, Inc. (c) 184,422 12,771,224
_______________________________________________________________15,929,474
Health Care Services–0.78%
Team Health Holdings, Inc. (c) 244,263 10,212,636
Health Care Supplies–0.63%
Alere, Inc. (c) 164,686 8,334,759
Health Care Technology–0.70%
See accompanying notes which are an integral part of this schedule.
Shares ________________________________________________________________Value
Home Entertainment Software–1.15%
Take-Two Interactive Software, Inc. (c) 403,060 $ 15,183,270
Home Furnishings–0.99%
La-Z-Boy Inc. 484,761 12,962,509
Homebuilding–0.42%
Beazer Homes USA, Inc. (c) 632,452 5,514,981
Household Appliances–1.34%
Helen of Troy Ltd. (c) 170,432 17,672,094
Industrial Machinery–2.12%
Albany International Corp. -Class A 380,525 14,303,935
Watts Water Technologies, Inc. -Class A 246,688 13,599,909
________________________________________________________________27,903,844
Investment Banking & Brokerage–2.27%
E*TRADE Financial Corp. (c) 686,889 16,821,911
Evercore Partners Inc. -Class A 253,389 13,112,881
________________________________________________________________29,934,792
IT Consulting & Other Services–1.06%
CACI International Inc. -Class A (c) 43,107 4,599,517
Luxoft Holding, Inc. (c) 169,897 9,349,432
________________________________________________________________13,948,949
Leisure Facilities–1.46%
Vail Resorts, Inc. 143,862 19,234,349
Life & Health Insurance–1.04%
CNO Financial Group, Inc. 766,600 13,737,472
Life Sciences Tools & Services–1.07%
Bio-Techne Corp. 149,449 14,125,920
Multi-Line Insurance–1.74%
American Financial Group, Inc. 230,758 16,238,441
Horace Mann Educators Corp. 210,960 6,685,322
________________________________________________________________22,923,763
Office Services & Supplies–0.94%
Pitney Bowes Inc. 572,225 12,325,727
Oil & Gas Drilling–0.50%
Precision Drilling Corp. (Canada) 1,569,354 6,591,287
Oil & Gas Equipment & Services–0.90%
Forum Energy Technologies Inc. (c) 676,888 8,934,922
Helix Energy Solutions Group Inc. (c) 513,972 2,878,243
________________________________________________________________11,813,165
Oil & Gas Exploration & Production–0.90%
Newfield Exploration Co. (c) 356,358 11,848,904
Shares _______________________________________________________________Value
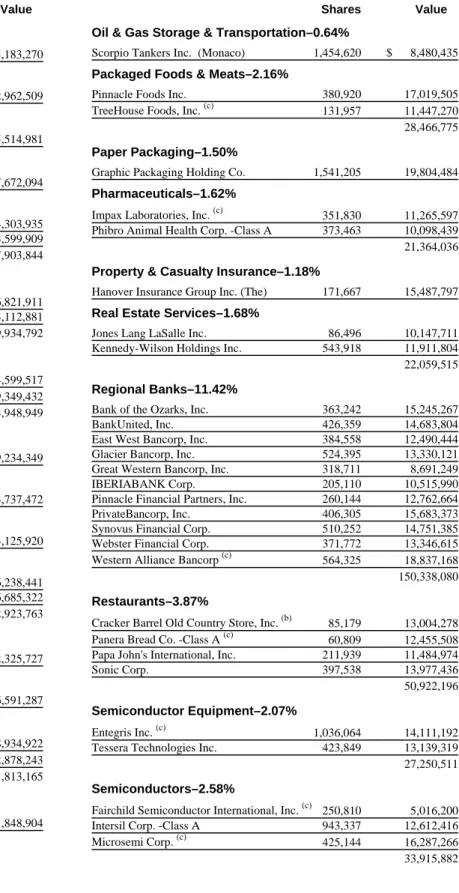
Oil & Gas Storage & Transportation–0.64%
Scorpio Tankers Inc. (Monaco) 1,454,620 $ 8,480,435
Packaged Foods & Meats–2.16%
Pinnacle Foods Inc. 380,920 17,019,505
TreeHouse Foods, Inc. (c) 131,957 11,447,270
_______________________________________________________________28,466,775
Paper Packaging–1.50%
Graphic Packaging Holding Co. 1,541,205 19,804,484
Pharmaceuticals–1.62%
Impax Laboratories, Inc. (c) 351,830 11,265,597
Phibro Animal Health Corp. -Class A 373,463 10,098,439
_______________________________________________________________21,364,036
Property & Casualty Insurance–1.18%
Hanover Insurance Group Inc. (The) 171,667 15,487,797
Real Estate Services–1.68%
Jones Lang LaSalle Inc. 86,496 10,147,711
Kennedy-Wilson Holdings Inc. 543,918 11,911,804
_______________________________________________________________22,059,515
Regional Banks–11.42%
Bank of the Ozarks, Inc. 363,242 15,245,267
BankUnited, Inc. 426,359 14,683,804
East West Bancorp, Inc. 384,558 12,490,444
Glacier Bancorp, Inc. 524,395 13,330,121
Great Western Bancorp, Inc. 318,711 8,691,249
IBERIABANK Corp. 205,110 10,515,990
Pinnacle Financial Partners, Inc. 260,144 12,762,664
PrivateBancorp, Inc. 406,305 15,683,373
Synovus Financial Corp. 510,252 14,751,385
Webster Financial Corp. 371,772 13,346,615
Western Alliance Bancorp (c) 564,325 18,837,168
_______________________________________________________________150,338,080
Restaurants–3.87%
Cracker Barrel Old Country Store, Inc. (b) 85,179 13,004,278
Panera Bread Co. -Class A (c) 60,809 12,455,508
Papa John's International, Inc. 211,939 11,484,974
Sonic Corp. 397,538 13,977,436
_______________________________________________________________50,922,196
Semiconductor Equipment–2.07%
Entegris Inc. (c) 1,036,064 14,111,192
Tessera Technologies Inc. 423,849 13,139,319
_______________________________________________________________27,250,511
Semiconductors–2.58%
Fairchild Semiconductor International, Inc. (c) 250,810 5,016,200
Intersil Corp. -Class A 943,337 12,612,416
Microsemi Corp. (c) 425,144 16,287,266
See accompanying notes which are an integral part of this schedule.
Invesco Small Cap Equity Fund
Shares ________________________________________________________________Value
Specialized REIT's–2.25%
CubeSmart 543,502 $ 18,098,617
Geo Group Inc. (The) 333,199 11,552,009
________________________________________________________________29,650,626
Specialty Chemicals–3.05%
Minerals Technologies Inc. 244,063 13,874,981
PolyOne Corp. 374,676 11,333,949
Sensient Technologies Corp. 235,545 14,947,686
________________________________________________________________40,156,616
Specialty Stores–3.22%
GNC Holdings, Inc. -Class A 385,761 12,247,912
Michaels Cos., Inc. (The) (c) 610,227 17,068,049
Sally Beauty Holdings, Inc. (c) 405,347 13,125,136
________________________________________________________________42,441,097
Technology Distributors–1.30%
Tech Data Corp. (c) 223,051 17,123,625
Technology Hardware, Storage & Peripherals–1.05%
Cray, Inc. (c) 329,818 13,822,672
Trucking–2.57%
Celadon Group, Inc. 574,950 6,025,476
Heartland Express, Inc. 591,215 10,967,038
Old Dominion Freight Line, Inc. (c) 241,103 16,785,591
________________________________________________________________33,778,105
Total Common Stocks & Other Equity Interests
(Cost $1,105,998,381) 1,254,217,428
________________________________________________________________
Shares _______________________________________________________________Value Money Market Funds–3.23%
Liquid Assets Portfolio –Institutional
Class, 0.45% (d) 21,245,095 $ 21,245,095
Premier Portfolio –Institutional
Class, 0.40% (d) 21,245,094 21,245,094
Total Money Market Funds
(Cost $42,490,189) 42,490,189
_______________________________________________________________ TOTAL INVESTMENTS (excluding investments purchased
with cash collateral from securities on loan)–98.48%
(Cost $1,148,488,570) 1,296,707,617
_______________________________________________________________ Investments Purchased with Cash Collateral from
Securities on Loan
Money Market Funds–2.38%
Liquid Assets Portfolio -Institutional Class, 0.45%
(Cost $31,277,710)(d)(e) 31,277,710 31,277,710
TOTAL INVESTMENTS–100.86%
(Cost $1,179,766,280) 1,327,985,327
_______________________________________________________________ OTHER ASSETS LESS LIABILITIES–(0.86)%_______________________________________________________________ (11,281,996)
NET ASSETS–100.00% $1,316,703,331
Investment Abbreviations:
REIT —Real Estate Investment Trust
Notes to Schedule of Investments:
(a) Industry and/or sector classifications used in this report are generally according to the Global Industry Classification Standard, which was developed by and is
the exclusive property and a service mark of MSCI Inc. and Standard & Poor's. (b)
All or a portion of this security was out on loan at March 31, 2016. (c)
Non-income producing security.
(d) The money market fund and the Fund are affiliated by having the same investment adviser. The rate shown is the 7-day SEC standardized yield as of
March 31, 2016.
(e) The security has been segregated to satisfy the commitment to return the cash collateral received in securities lending transactions upon the borrower's return of
Notes to Quarterly Schedule of Portfolio Holdings
March 31, 2016 (Unaudited)
NOTE 1 -- Significant Accounting Policies
A. Security Valuations – Securities, including restricted securities, are valued according to the following policy.
A security listed or traded on an exchange (except convertible securities) is valued at its last sales price or official closing price as of the close of the customary trading session on the exchange where the security is principally traded, or lacking any sales or official closing price on a particular day, the security may be valued at the closing bid price on that day. Securities traded in the over-the-counter market are valued based on prices furnished by independent pricing services or market makers. When such securities are valued by an independent pricing service they may be considered fair valued. Futures contracts are valued at the final settlement price set by an exchange on which they are principally traded. Listed options are valued at the mean between the last bid and asked prices from the exchange on which they are principally traded. Options not listed on an exchange are valued by an independent source at the mean between the last bid and asked prices. For purposes of determining net asset value ("NAV") per share, futures and option contracts generally are valued 15 minutes after the close of the customary trading session of the New York Stock Exchange (“NYSE”).
Investments in open-end and closed-end registered investment companies that do not trade on an exchange are valued at the end-of-day net asset value per share. Investments in open-end and closed-end registered investment companies that trade on an exchange are valued at the last sales price or official closing price as of the close of the customary trading session on the exchange where the security is principally traded.
Debt obligations (including convertible securities) and unlisted equities are fair valued using an evaluated quote provided by an independent pricing service. Evaluated quotes provided by the pricing service may be determined without exclusive reliance on quoted prices, and may reflect appropriate factors such as institution-size trading in similar groups of securities, developments related to specific securities, dividend rate (for unlisted equities), yield (for debt obligations), quality, type of issue, coupon rate (for debt obligations), maturity (for debt obligations), individual trading characteristics and other market data. Debt obligations are subject to interest rate and credit risks. In addition, all debt obligations involve some risk of default with respect to interest and/or principal payments.
Foreign securities' (including foreign exchange contracts) prices are converted into U.S. dollar amounts using the applicable exchange rates as of the close of the NYSE. If market quotations are available and reliable for foreign exchange-traded equity securities, the securities will be valued at the market quotations. Because trading hours for certain foreign securities end before the close of the NYSE, closing market quotations may become unreliable. If between the time trading ends on a particular security and the close of the customary trading session on the NYSE, events occur that the Adviser determines are significant and make the closing price unreliable, the Fund may fair value the security. If the event is likely to have affected the closing price of the security, the security will be valued at fair value in good faith using procedures approved by the Board of Trustees.
Adjustments to closing prices to reflect fair value may also be based on a screening process of an independent pricing service to indicate the degree of certainty, based on historical data, that the closing price in the principal market where a foreign security trades is not the current value as of the close of the NYSE. Foreign securities' prices meeting the approved degree of certainty that the price is not reflective of current value will be priced at the indication of fair value from the independent pricing service. Multiple factors may be considered by the independent pricing service in determining adjustments to reflect fair value and may include information relating to sector indices, American Depositary Receipts and domestic and foreign index futures. Foreign securities may have additional risks including exchange rate changes, potential for sharply devalued currencies and high inflation, political and economic upheaval, the relative lack of issuer information, relatively low market liquidity and the potential lack of strict financial and accounting controls and standards.
Securities for which market prices are not provided by any of the above methods may be valued based upon quotes furnished by independent sources. The last bid price may be used to value equity securities. The mean between the last bid and asked prices is used to value debt obligations, including corporate loans.
Securities for which market quotations are not readily available or became unreliable are valued at fair value as determined in good faith by or under the supervision of the Trust’s officers following procedures approved by the Board of Trustees. Issuer specific events, market trends, bid/asked quotes of brokers and information providers and other market data may be reviewed in the course of making a good faith determination of a security’s fair value.
The Fund may invest in securities that are subject to interest rate risk, meaning the risk that the prices will generally fall as interest rates rise and, conversely, the prices will generally rise as interest rates fall. Specific securities differ in their sensitivity to
Invesco Small Cap Equity Fund
A. Security Valuations – (continued)
changes in interest rates depending on their individual characteristics. Changes in interest rates may result in increased market volatility, which may affect the value and/or liquidity of certain Fund investments.
Valuations change in response to many factors including the historical and prospective earnings of the issuer, the value of the issuer's assets, general economic conditions, interest rates, investor perceptions and market liquidity. Because of the inherent uncertainties of valuation, the values reflected in the financial statements may materially differ from the value received upon actual sale of those investments.
B. Securities Transactions and Investment Income – Securities transactions are accounted for on a trade date basis. Realized gains or losses on sales are computed on the basis of specific identification of the securities sold. Interest income (net of
withholding tax, if any) is recorded on the accrual basis from settlement date. Dividend income (net of withholding tax, if any) is recorded on the ex-dividend date.
The Fund may periodically participate in litigation related to Fund investments. As such, the Fund may receive proceeds from litigation settlements. Any proceeds received are included in the Statement of Operations as realized gain (loss) for investments no longer held and as unrealized gain (loss) for investments still held.
Brokerage commissions and mark ups are considered transaction costs and are recorded as an increase to the cost basis of securities purchased and/or a reduction of proceeds on a sale of securities. Such transaction costs are included in the
determination of net realized and unrealized gain (loss) from investment securities reported in the Statement of Operations and the Statement of Changes in Net Assets and the net realized and unrealized gains (losses) on securities per share in the Financial Highlights. Transaction costs are included in the calculation of the Fund's net asset value and, accordingly, they reduce the Fund’s total returns. These transaction costs are not considered operating expenses and are not reflected in net investment income reported in the Statement of Operations and the Statement of Changes in Net Assets, or the net investment income per share and the ratios of expenses and net investment income reported in the Financial Highlights, nor are they limited by any expense limitation arrangements between the Fund and the investment adviser.
The Fund allocates income and realized and unrealized capital gains and losses to a class based on the relative net assets of each class.
C. Country Determination – For the purposes of making investment selection decisions and presentation in the Schedule of Investments, the investment adviser may determine the country in which an issuer is located and/or credit risk exposure based on various factors. These factors include the laws of the country under which the issuer is organized, where the issuer maintains a principal office, the country in which the issuer derives 50% or more of its total revenues and the country that has the primary market for the issuer’s securities, as well as other criteria. Among the other criteria that may be evaluated for making this determination are the country in which the issuer maintains 50% or more of its assets, the type of security, financial guarantees and enhancements, the nature of the collateral and the sponsor organization. Country of issuer and/or credit risk exposure has been determined to be the United States of America, unless otherwise noted.
D. Securities Lending – The Fund may lend portfolio securities having a market value up to one-third of the Fund’s total assets.
Such loans are secured by collateral equal to no less than the market value of the loaned securities determined daily by the securities lending provider. Such collateral will be cash or debt securities issued or guaranteed by the U.S. Government or any of its sponsored agencies. Cash collateral received in connection with these loans is invested in short-term money market
instruments or affiliated money market funds and is shown as such on the Schedule of Investments. The Fund bears the risk of loss with respect to the investment of collateral. It is the Fund’s policy to obtain additional collateral from or return excess collateral to the borrower by the end of the next business day, following the valuation date of the securities loaned. Therefore, the value of the collateral held may be temporarily less than the value of the securities on loan. When loaning securities, the Fund retains certain benefits of owning the securities, including the economic equivalent of dividends or interest generated by the security. Lending securities entails a risk of loss to the Fund if, and to the extent that, the market value of the securities loaned were to increase and the borrower did not increase the collateral accordingly, and the borrower failed to return the securities. The securities loaned are subject to termination at the option of the borrower or the Fund. Upon termination, the borrower will return to the Fund the securities loaned and the Fund will return the collateral. Upon the failure of the borrower to return the securities, collateral may be liquidated and the securities may be purchased on the open market to replace the loaned securities. The Fund could experience delays and costs in gaining access to the collateral and the securities may lose value during the delay which could result in potential losses to the Fund. Some of these losses may be indemnified by the lending agent. The Fund bears the risk of any deficiency in the amount of the collateral available for return to the borrower due to any loss on the collateral
invested. Dividends received on cash collateral investments for securities lending transactions, which are net of compensation to counterparties, are included in Dividends from affiliated money market funds on the Statement of Operations. The aggregate value of securities out on loan, if any, is shown as a footnote on the Statement of Assets and Liabilities.
NOTE 2 -- Additional Valuation Information
Generally Accepted Accounting Principles ("GAAP") defines fair value as the price that would be received to sell an asset or paid to transfer a liability in an orderly transaction between market participants at the measurement date, under current market conditions. GAAP establishes a hierarchy that prioritizes the inputs to valuation methods, giving the highest priority to readily available unadjusted quoted prices in an active market for identical assets (Level 1) and the lowest priority to significant unobservable inputs (Level 3), generally when market prices are not readily available or are unreliable. Based on the valuation inputs, the securities or other investments are tiered into one of three levels. Changes in valuation methods may result in transfers in or out of an investment’s assigned level:
Level 1 – Prices are determined using quoted prices in an active market for identical assets.
Level 2 – Prices are determined using other significant observable inputs. Observable inputs are inputs that other market participants may use in pricing a security. These may include quoted prices for similar securities, interest rates, prepayment speeds, credit risk, yield curves, loss severities, default rates, discount rates, volatilities and others. Level 3 – Prices are determined using significant unobservable inputs. In situations where quoted prices or observable inputs
are unavailable (for example, when there is little or no market activity for an investment at the end of the period), unobservable inputs may be used. Unobservable inputs reflect the Fund’s own assumptions about the factors market participants would use in determining fair value of the securities or instruments and would be based on the best available information.
As of March 31, 2016, all of the securities in this Fund were valued based on Level 1 inputs (see the Schedule of Investments for security categories). The level assigned to the securities valuations may not be an indication of the risk or liquidity associated with investing in those securities. Because of the inherent uncertainties of valuation, the values reflected in the financial statements may materially differ from the value received upon actual sale of those investments.
NOTE 3 -- Investment Securities
The aggregate amount of investment securities (other than short-term securities, U.S. Treasury obligations and money market funds, if any) purchased and sold by the Fund during the three months ended March 31, 2016 was $61,147,765 and $113,282,872, respectively.
Cost of investments on a tax basis includes the adjustments for financial reporting purposes as of the most recently completed federal income tax reporting period-end.
Unrealized Appreciation (Depreciation) of Investment Securities on a Tax Basis
Aggregate unrealized appreciation of investment securities $ 254,060,305
Aggregate unrealized (depreciation) of investment securities (106,065,168)
Net unrealized appreciation of investment securities $ 147,995,137