704
L
ow socioeconomic position (SEP) is associated withan increased risk of cardiovascular disease (CVD), and social inequities exist also in the treatment of CVD and asso-ciated outcomes.1–4 According to a recent American Heart Association policy statement, the greatest opportunity for reducing death and disability from CVD lies in dealing with their social determinants (including SEP).5
Statins reduce all-cause mortality and major vascular events in the primary prevention of CVD.6 However, many patients who are prescribed statins, especially those in pri-mary prevention, do not adhere to the treatment.7 Low SEP is one of the predictors of nonadherence to preventive therapies, including statins, although previous research has reported varying results on the strength of this association.7,8 Several
studies,7,9–12 yet not all,13 have found low income to predict statin nonadherence. Results on the association between edu-cation and statin nonadherence are mixed: low eduedu-cation level has been associated with statin nonadherence,9,10 but higher education has also been found to predict statin nonadher-ence9,11,13 or there has been no association.14
Research on the association between SEP and statin adherence has mainly defined adherence through measures that reduce longitudinal medication-taking behavior into a single number,12,13 such as the proportion of days covered (PDC).7,9 Although this simplification is appealing, it leads to loss of information on medication-taking patterns over time. Group-based trajectory modeling (GBTM)15 offers an alterna-tive method for summarizing longitudinal data on medication
Background—Previous research shows that low socioeconomic position (SEP; especially low income) is associated with statin nonadherence. We investigated the relationship between SEP and statin adherence in a country with universal coverage using group-based trajectory modeling in addition to the proportion of days covered.
Methods and Results—Using data from Finnish healthcare registers, we identified 116 846 individuals, aged 45 to 75 years, who initiated statin therapy for primary prevention of cardiovascular disease. We measured adherence as proportion of days covered over an 18-month period since initiation and identified different adherence patterns based on monthly adherence with group-based trajectory modeling. When adjusted for age, marital status, residential area, clinical characteristics, and copayment, low SEP was associated with statin nonadherence (proportion of days covered <80%) among men (eg, lowest versus highest income quintile: odds ratio, 1.41; 95% confidence interval, 1.32–1.50; basic versus higher-degree education: odds ratio, 1.18; 95% confidence interval, 1.13–1.24; unemployment versus employment: odds ratio, 1.17; 95% confidence interval, 1.10–1.25). Among women, the corresponding associations were different (P<0.001 for sex-by-income quintile, sex-by-education level, and sex-by-labor market status interactions) and mainly nonsignificant. Results based on adherence trajectories showed that men in low SEP were likely to belong to trajectories presenting a fast decline in adherence.
Conclusions—Low SEP was associated with overall and rapidly increasing statin nonadherence among men. Conversely, in women, associations between SEP and nonadherence were weak and inconsistent. Group-based trajectory modeling provided insight into the dynamics of statin adherence and its association with SEP. (Circ Cardiovasc Qual Outcomes. 2016;9:704-713. DOI: 10.1161/CIRCOUTCOMES.116.002728.)
Key Words: cardiovascular diseases ◼ income ◼ medication adherence ◼ primary prevention
◼ sex ◼ socioeconomic position
© 2016 American Heart Association, Inc.
Circ Cardiovasc Qual Outcomes is available at http://circoutcomes.ahajournals.org DOI: 10.1161/CIRCOUTCOMES.116.002728
Received March 3, 2016; accepted August 31, 2016.
From the Department of Clinical Pharmacology, Tykslab, Turku University Hospital, Finland (E.A., R.H.); School of Pharmacy, University of Eastern Finland, Kuopio, Finland (E.A., J.M.); Department of Health Policy and Management, School of Public Health (A.N.W.) and Division of Pharmaceutical Outcomes and Policy, Eshelman School of Pharmacy (M.J.K.), University of North Carolina at Chapel Hill; Department of Pharmacology, Drug Development and Therapeutics (R.H., M.J.K.) and Department of Public Health (J.V., M.J.K.), University of Turku, Finland; and Turku University Hospital, Finland (J.V.).
The Data Supplement is available at http://circoutcomes.ahajournals.org/lookup/suppl/doi:10.1161/CIRCOUTCOMES.116.002728/-/DC1.
Correspondence to Emma Aarnio, MSc, University of Eastern Finland, School of Pharmacy, P.O. Box 1627 (Yliopistonranta 1), 70211 Kuopio, Finland. E-mail [email protected]
Socioeconomic Inequalities in Statin Adherence
Under Universal Coverage
Does Sex Matter?
Emma Aarnio, MSc; Janne Martikainen, PhD; Aaron N. Winn, MPP;
Risto Huupponen, MD, PhD; Jussi Vahtera, MD, PhD; Maarit J. Korhonen, PhD, LicSc
adherence. GBTM accounts for the dynamic nature of adher-ence and identifies long-term patterns of the repeatedly measured adherence and groups of individuals with simi-lar patterns.16,17 Statin adherence trajectories have also been shown to predict cardiovascular events.18
Despite the universal healthcare, socioeconomic dispari-ties in CVD have been documented also in Finland: lower SEP has been associated with higher CVD morbidity and mortality, lower use of statins, and lower revascularization rates.3,19–21 The aim of our study was to determine the associa-tion of SEP with nonadherence and adherence trajectories in Finnish patients initiating statin therapy for primary preven-tion of CVD. To refine the estimapreven-tion of the effect of SEP on statin nonadherence, we measured adherence as 18-month adherence trajectories in addition to a conventional dichoto-mous measure (PDC <80% versus ≥80%). These associations were analyzed separately among men and women because there are reports of sex differences in associations between SEP and statin use.4,9,21 We focused on primary prevention where the associations between SEP and statin adherence are poorly known because published studies have been mainly among secondary prevention or mixed cohorts including both primary and secondary prevention patients.7,10–14
Methods
Data SourcesOur study was based on data extracted from administrative healthcare databases, and registers maintained by Statistics Finland. Statistics Finland provided information on marital status and SEP and linked the data from different registers through unique personal identifica-tion numbers. We had access to deidentified data only.
The Prescription Register, maintained by the Social Insurance Institution of Finland since 1994, is a pharmacy claims database that includes records of all medication dispensations reimbursed to noninstitutionalized residents of Finland.22 For each dispensation,
the register contains data on the medication (eg, the Anatomical Therapeutic Chemical classification code,23 dispensation and
pre-scription dates, dispensed quantity, cost, and copayment) and on the patient (eg, sex, birth, and death dates). During long-term
institutionalizations (>90 consecutive days) and hospital stays, pa-tients are not eligible for drug reimbursement, and their medica-tion use is not recorded in the Prescripmedica-tion Register. The Social Insurance Institution of Finland maintains also the Special Refund Entitlement Register that includes records of patients entitled to a higher medication reimbursement because of certain severe chron-ic diseases, such as diabetes mellitus, hypertension, and coronary heart disease (CHD).
The hospital discharge register is maintained by the National Institute for Health and Welfare.24 Covering all Finnish hospitals, it
includes data on discharge diagnoses (the International Classification
of Diseases, Tenth Revision codes since 1996), procedure codes, and admission and discharge dates.
Cohort
All noninstitutionalized, 45- to 75-year-old residents of Finland ini-tiating statin therapy between January 1, 2001, and December 31, 2004, were identified. A new statin user was defined as a patient with no previous statin dispensations in the Prescription Register since 1994. To enhance patient confidentiality, an 85% random sample of these initiators was included in our study. The date of the first statin dispensation was used as the index date (ie, the date of cohort entry).
For reliable identification of covariates, individuals institutional-ized for long-term during 3 years before statin initiation were exclud-ed. We also excluded patients who were dispensed lipid-modifying drugs other than statins within 3 years preceding the cohort entry and those initiating treatment with cerivastatin (withdrawn from the mar-ket in 2001).
We focused on primary prevention of atherosclerotic CVD. Therefore, we excluded patients in secondary prevention defined as hospitalization for CHD (International Classification of Diseases, Tenth Revision codes I20–I25), cerebrovascular diseases (I60–I66, I68, I69, G45, and G46), atherosclerosis (I70), aneurysm (I71), or any medical procedure related to CHD, cerebrovascular diseases, or peripheral artery disease within 3 years before the index date. Dispensations of nitrates during 3 years preceding and the entitlement to special refund because of CHD at statin initiation were also used for defining secondary prevention. We excluded patients aged <45 year as their proportion of statin initiators was low and those aged >75 years because the benefits of statin therapy in this age group are unclear.25
Patients were followed-up for 18 months since the index date. We excluded patients who died or were institutionalized for long-term during the follow-up or were hospitalized for 30 days in any of the follow-up months.
Details of the exclusion criteria are presented in Table I in the Data Supplement.
No ethics committee approval was required because we used only deidentified patient data and did not contact any patients. The Social Insurance Institution of Finland, the National Institute for Health and Welfare, and Statistics Finland granted us permission to use their reg-ister data.
Adherence
We identified statin dispensations during 540 days since the index date. Based on these dispensations, we defined for each patient whether statin was available on each day during the follow-up. Because the Prescription Register has no data on dosages or days’ supply, we assumed a dosage of 1 statin tablet per day.26 If there was
overlapping refills, we assumed that the patient finished the previous supply before the use of the new supply. Switching between statins was not considered as treatment discontinuation.
The PDC27 for the whole 540-day follow-up was obtained by
di-viding the number of days covered by the number of nonhospitalized days during the follow-up. For GBTM, we calculated the PDC for every 30-day period (18 in total) by dividing the number of days cov-ered by the number of nonhospitalized days during each period to cre-ate monthly binary indicators for adherence and to obtain adherence patterns for each patient. Nonadherence was defined as PDC <80%28
for the whole follow-up and the monthly indicators.
WHAT IS KNOWN
• Negative effects of low SEP on adherence to statins have been previously reported; however, less is known about these associations in primary preven-tion populapreven-tions and their variapreven-tion by sex.
WHAT THE STUDY ADDS
• Low SEP is associated with statin nonadherence, especially rapid decline in adherence, among men. • Among women, the relationship between SEP and
statin nonadherence is not obvious.
• These associations were documented in a primary prevention population in a country with universal healthcare and drug reimbursement systems, using three indicators of SEP and two adherence measures: the proportion of days covered and adherence trajec-tories modeled by group-based trajectory modeling.
Socioeconomic Position
We used 3 SEP indicators: income, education level, and labor market status (Table II in the Data Supplement). All of these variables were measured in the year of statin initiation. If data were missing in that year, the previous year’s data were used. Personal taxable income was divided into quintiles in the whole cohort (ie, not sex-specific). Education level refers to the highest completed education/degree and had 3 categories: basic, secondary (high school and vocational qualifications), and higher-degree level (university or college educa-tion). Labor market status was categorized as employed, unemployed, retired, and outside the labor market (eg, students, caregivers, and homemakers).
Covariates
We obtained information on sociodemographic factors, cardiac and noncardiac comorbidities, and copayments. These covariates were selected based on their potential connection with statin adherence or cardiovascular risk.7,29 A comprehensive list of covariate definitions is
presented in Table II in the Data Supplement.
We included the following sociodemographic variables: age, sex, marital status, and residential area measured on the index year. If there were missing data about marital status, we used data from the previous year. Residential area refers to the 5 tertiary care catchment areas in Finland.
Most of the comorbidities were identified using discharge diag-noses (3 years preceding the index date), reimbursed medications (dispensed ≤1 year before or on the index date), and entitlements to special refund (valid at the index date).24 We identified the number of
hospital days in the year preceding the index date, and the number of different medications dispensed and total medication costs shared by the patient during the 120 days preceding statin initiation (including the index date). We did not have data on patients’ cholesterol or blood pressure levels or smoking to directly determine their CVD risk.
We also included variables related to statin initiation: time of initiation (quarter/yr), type, and intensity of the initial statin therapy (modified from Stone et al25), and copayment of the first statin
dispen-sation (per tablet). Time of statin initiation was included as a design variable to adjust for secular trends in statin prices (generic substitu-tion introduced in Finland in April 2003), prescribing practices, and possible changes in the coverage of the Prescription Register.
Age, number of hospital days, and copayment of the first statin were categorized to allow for nonlinear associations with adherence.
Statistical Analyses
Group-Based Trajectory Models
We modeled the monthly binary indicators as a longitudinal response in a logistic GBTM to classify patients by their statin adherence.15,17
GBTMs are an application of finite mixture models and they use the maximum likelihood method to estimate model parameters.15 These
parameters determine, for example, the shape of the trajectories and the estimated trajectory group sizes. The models also produce poste-rior probabilities of group membership that measure each individual’s likelihood of belonging to each of the trajectory groups given the in-dividual’s adherence pattern. According to the maximum posterior probability assignment rule, individuals are placed into the trajectory group with the highest posterior probability.
We tested models for the whole cohort using 2 to 6 groups. As documented in the previous work, models with 6 groups were as-sumed to be too difficult to interpret.17 The selection of the final
mod-el was based on the Bayesian information criteria (value closest to 0 indicating the best-fitting model).15 Modeling was performed using
Proc Traj.30 SAS version 9.3 (SAS Institute Inc., Cary, NC) was used
for all statistical analyses.
Binary and Multinomial Logistic Regressions
We explored the associations between SEP and adherence with 4 different models: models including only one of the SEP indicators (income, education, or labor market status model), and a full model including all SEP indicators to see how the indicators influence each
other’s associations with nonadherence. The association between patients’ SEP and nonadherence was explored with binary logistic regression with nonadherence as the outcome (PDC <80% measured over the 540 days). The associations between SEP and membership in statin trajectory groups were estimated with multinomial logistic regression models. We observed significant interactions between sex and each SEP indicator (P<0.001 for interaction terms sex×income quintile, sex×education level, and sex×labor market status in separate SEP models based on the whole cohort), which supported our deci-sion to stratify the data by sex.
In total, 576 individuals (0.5%) in our final cohort had missing data (480 on income, 50 on labor market status, 50 on marital sta-tus, and 154 on residential area). These individuals were included in GBTM but not in the logistic regressions. Because of the low rate of missingness, we did not impute missing data.
Results
CohortOur original sample included 174 496 new statin users. The final cohort included 116 846 primary prevention patients with full adherence data (51 590 men and 65 256 women; flow-chart of the cohort definition in Figure I in the Data Supple-ment). The baseline characteristics and adherence measures are displayed in Table 1. Men’s mean age was 58.0 years, and women’s mean age was 60.8 years. Men had distinctly higher income than women (men’s mean yearly income
€30 700 versus women’s €18 200). Most of men (40.7%) and women (49.2%) had only basic education. Of men, 52.0% were employed and 36.2% were retired. Conversely, 37.2% of women were employed and 49.0% were retired. Baseline characteristics according to adherence trajectories are dis-played in Tables III and IV in the Data Supplement.
Associations of SEP With Dichotomous Nonadherence
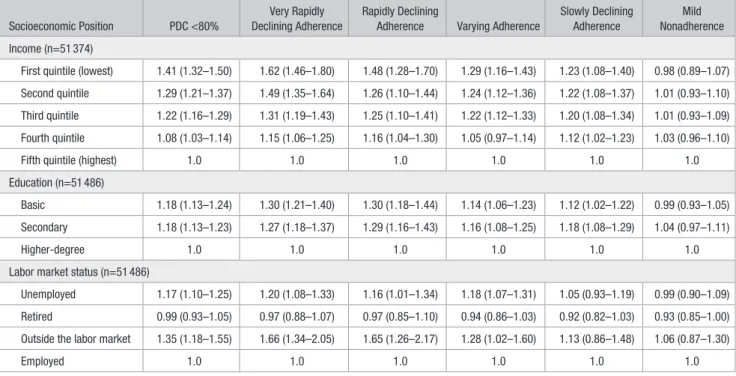
During the 18-month follow-up, 50.5% of the whole cohort were nonadherent (PDC <80%; 51.3% of men and 49.9% of women). In men, nonadherence was dependent on SEP. The association with income was monotonic: the lower the income, the higher the odds of nonadherence (test for trend:
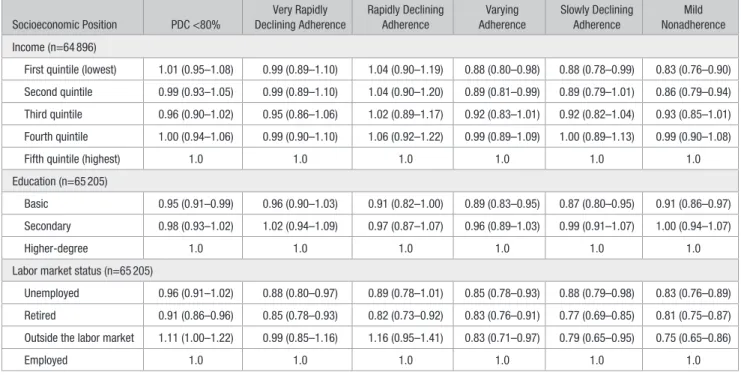
P<0.001; Table 2). Men with basic or secondary education were 1.18× as likely (95% confidence intervals, 1.13–1.24) as men with higher-degree education to be nonadherent; the corresponding odds ratios (ORs) were 1.17 (95% confidence interval, 1.10–1.25) for those unemployed and 1.35 (95% con-fidence interval, 1.18–1.55) for those outside the labor market compared with employed men. Among women, no clear asso-ciation between income or education and nonadherence was observed (Table 3). The OR of nonadherence was 1.11 (95% confidence interval, 1.00–1.55) for women outside the labor market compared with employed women.
Adherence Trajectories
Based on Bayesian information criteria values and model convergence, we selected the 6-group cubic model as the final GBTM (Table V in the Data Supplement). According to diagnostic criteria, the selected model performed adequately (Table VI in the Data Supplement). The estimated 6 trajec-tories and the averaged group data are presented in Figure 1. The following 6 adherence patterns were identified: (1) very
Charlson comorbidity index 0.2±0.5 0.2±0.5 0.2±0.5 No. of hospital days 2.1±7.9 2.1±7.0 2.1±7.4 Use of NSAIDs 25.2 32.1 29.1 Use of hormone therapy 0.0 35.8 20.0 No. of concurrent
medications 3.2±2.2 3.9±2.5 3.6±2.4
Total out-of-pocket costs of
medications, € 92.7±69.8 97.4±70.3 95.4±70.1
Statin factors
Year of statin initiation*
2001 21.3 21.6 21.4
2002 22.5 22.7 22.6
2003 24.7 24.5 24.6
2004 31.5 31.2 31.3
Statin at baseline
Simvastatin 38.1 40.0 39.2
Atorvastatin 37.3 34.8 35.9
Rosuvastatin 10.5 9.7 10.0
Fluvastatin 6.7 7.9 7.4
Pravastatin 6.0 5.8 5.9
Lovastatin 1.5 1.7 1.7
Intensity of statin therapy†
Low 26.7 32.2 29.8
Moderate 72.7 67.4 69.7
High 0.6 0.3 0.4
Copayment of first statin dispensation, euro cents/ tablet
68.8±25.9 67.2±25.7 67.9±25.8
Adherence
PDC during 1.5 y 67.8±31.3 69.0±30.9 68.5±31.1 PDC <80% during 1.5 y 51.3 49.9 50.5 Assignment to trajectories
Very rapidly declining
adherence 16.6 15.5 16.0
Rapidly declining
adherence 6.4 6.3 6.3
Varying adherence 17.4 17.0 17.2 Slowly declining
adherence 9.1 9.6 9.4
Mild nonadherence 29.3 27.9 28.6 Near-perfect adherence 21.2 23.6 22.5 Data are expressed as mean±SD or percentage.
COPD indicates chronic obstructive pulmonary disease; CV, cardiovascular; and PDC, proportion of days covered.
*Time of statin initiation was used as quarter/y in the logistic regressions. †Low intensity: F10–40, L10–20, P10–20, S5–10; moderate intensity: A10– 20, F80, S20–40, L40, P40–80, R10; and high intensity: A40–80, R20–40, S80. Table 1. Continued
Men (n=51 590)
Women (n=65 256)
All (n=116 846) Table 1. Baseline Characteristics and Adherence of Statin
Initiators
Men (n=51 590)
Women (n=65 256)
All (n=116 846) Socioeconomic and demographic factors
Taxable income, €/y 30 698± 27 662
18 154± 13 664
23 699± 21 937 Education level
Basic 40.7 49.2 45.4
Secondary 30.5 30.6 30.6
Higher-degree 28.8 20.2 24.0 Labor market status
Employed 52.0 37.2 43.7
Unemployed 9.9 11.1 10.6
Retired 36.2 49.0 43.4
Outside the labor market 1.9 2.8 2.4 Age, y 58.0±7.7 60.8±7.8 59.6±7.9 Marital status
Unmarried 8.3 7.4 7.8
Married 81.9 68.8 74.6
Divorced 7.9 11.9 10.2
Widowed 1.8 11.8 7.4
Geographical region of Finland
Southern 31.2 31.2 31.2
Southwestern 13.6 13.4 13.5
Central 22.5 23.1 22.8
Eastern 18.9 19.3 19.1
Northern 13.8 13.0 13.4
Cardiac comorbidities
Dyslipidemia 1.2 0.9 1.1
Diabetes mellitus 17.2 11.8 14.2
Hypertension 51.2 53.2 52.3
Cardiac insufficiency 1.5 1.0 1.2 Atrial fibrillation 4.1 2.0 2.9 No. of concurrent CV
medications 0.9±1.1 0.9±1.0 0.9±1.0
Noncardiac comorbidities and copayments
Dementia 0.3 0.4 0.4
Depression 7.0 11.5 9.5
Mental disorder 2.7 3.7 3.2
COPD and asthma 8.0 11.6 10.0
Cancer 3.1 4.3 3.7
Rheumatoid arthritis 1.8 3.1 2.5 Renal insufficiency 0.3 0.2 0.2
Obesity 0.6 0.6 0.6
Alcoholism/narcomania 1.0 0.4 0.7 (Continued )
rapidly declining adherence including individuals with virtu-ally no dispensations after initiation (estimated size 16.0% of the whole cohort), (2) rapidly declining adherence represent-ing rapid decline in statin use (6.3%), (3) varyrepresent-ing adherence representing fluctuating use across the follow-up (17.2%), (4) slowly declining adherence representing a steady decline in statin use (9.4%), (5) mild nonadherence including individu-als improving statin use after a slight decrease (28.6%), and (6) near-perfect adherence including individuals being nearly always adherent (22.5%).
Associations of SEP With Adherence Trajectories Figure 2A through 2F shows which adherence trajectories men and women were assigned to according to the 3 SEP indicators. Near-perfect adherence trajectory was over-repre-sented in men in the highest income quintile and with higher-degree education and in women in the lowest income quintile and with basic level education. A higher proportion of retired patients was assigned to the highest adherence trajectory compared with the other labor market status categories in both sexes.
We used the trajectory of near-perfect adherence as the reference in the multinomial logistic regressions. Results from these analyses were mostly in line with the results based on dichotomous nonadherence. Among men, lower income and education were associated with higher odds (ORs, 1.12– 1.62) of belonging to the 4 poorest adherence trajectories (Table 2). Unemployed men and men outside the labor mar-ket had higher odds (ORs, 1.16–1.60) of belonging to the 3 poorest adherence trajectories compared with employed men; retired men did not differ from the employed. The odds of
belonging to the trajectories of rapidly declining adherence were higher than the odds of belonging to the 3 other trajec-tories regardless of the SEP indicator used (except for unem-ployed men).
Among women, there were few significant associations between income and adherence trajectories, which supports the results based on dichotomized PDC (Table 3). Basic edu-cation was associated with smaller odds (ORs, 0.87–0.91) of belonging to the trajectories of varying or slowly declining adherence or mild nonadherence. Retired women had smaller odds (ORs, 0.77–0.85) of belonging to any of the nonadher-ence trajectories. In contrast to associations with dichotomized PDC, unemployed women had smaller odds (ORs, 0.83–0.88) of belonging to any of the nonadherence trajectories except rapidly declining adherence. Furthermore, women outside the labor market had smaller odds (ORs, 0.75–0.83) of belonging to the trajectories of varying or slowly declining adherence or mild nonadherence.
The results about the sex difference in the relationship between income and statin adherence did not depend on the use of nonsex-specific quintiles, because in sensitivity analy-ses using sex-specific quintiles, the sex differences remained (Table VII in the Data Supplement).
Full Models
When mutually adjusted for other SEP indicators, the SEP– nonadherence associations attenuated among men in both binary and multinomial logistic regressions (Table VIII in the Data Supplement). In women’s full models, the asso-ciations did not materially change (Table IX in the Data Supplement).
Table 2. Multivariable Odds Ratios* and 95% Confidence Intervals From Men’s Separate Socioeconomic Position Models for PDC <80% vs ≥80% and Nonadherence Trajectories vs Near-Perfect Adherence Associated With Income Level, Education Level, and Labor Market Status
Socioeconomic Position PDC <80%
Very Rapidly Declining Adherence
Rapidly Declining
Adherence Varying Adherence
Slowly Declining Adherence
Mild Nonadherence Income (n=51 374)
First quintile (lowest) 1.41 (1.32–1.50) 1.62 (1.46–1.80) 1.48 (1.28–1.70) 1.29 (1.16–1.43) 1.23 (1.08–1.40) 0.98 (0.89–1.07) Second quintile 1.29 (1.21–1.37) 1.49 (1.35–1.64) 1.26 (1.10–1.44) 1.24 (1.12–1.36) 1.22 (1.08–1.37) 1.01 (0.93–1.10) Third quintile 1.22 (1.16–1.29) 1.31 (1.19–1.43) 1.25 (1.10–1.41) 1.22 (1.12–1.33) 1.20 (1.08–1.34) 1.01 (0.93–1.09) Fourth quintile 1.08 (1.03–1.14) 1.15 (1.06–1.25) 1.16 (1.04–1.30) 1.05 (0.97–1.14) 1.12 (1.02–1.23) 1.03 (0.96–1.10)
Fifth quintile (highest) 1.0 1.0 1.0 1.0 1.0 1.0
Education (n=51 486)
Basic 1.18 (1.13–1.24) 1.30 (1.21–1.40) 1.30 (1.18–1.44) 1.14 (1.06–1.23) 1.12 (1.02–1.22) 0.99 (0.93–1.05) Secondary 1.18 (1.13–1.23) 1.27 (1.18–1.37) 1.29 (1.16–1.43) 1.16 (1.08–1.25) 1.18 (1.08–1.29) 1.04 (0.97–1.11)
Higher-degree 1.0 1.0 1.0 1.0 1.0 1.0
Labor market status (n=51 486)
Unemployed 1.17 (1.10–1.25) 1.20 (1.08–1.33) 1.16 (1.01–1.34) 1.18 (1.07–1.31) 1.05 (0.93–1.19) 0.99 (0.90–1.09) Retired 0.99 (0.93–1.05) 0.97 (0.88–1.07) 0.97 (0.85–1.10) 0.94 (0.86–1.03) 0.92 (0.82–1.03) 0.93 (0.85–1.00) Outside the labor market 1.35 (1.18–1.55) 1.66 (1.34–2.05) 1.65 (1.26–2.17) 1.28 (1.02–1.60) 1.13 (0.86–1.48) 1.06 (0.87–1.30)
Employed 1.0 1.0 1.0 1.0 1.0 1.0
PDC indicates proportion of days covered.
*All models were adjusted for the baseline characteristics (Table 1).
Discussion
In this study of 116 846 statin initiators in Finland, low SEP was associated with statin nonadherence in men regardless of the indicator used. Lower income and education predicted overall nonadherence (PDC <80%) and specifically a rapid decline in adherence, as indicated by the trajectory model-ing. In contrast, in women, income or education levels had no clear association with nonadherence. Also unemployment or being outside the labor market had stronger associations with nonadherence among men than among women. Conversely, being retired (versus employed) did not predict nonadher-ence in men, but among women it predicted decreased odds of nonadherence.
The results on the relationship between SEP indicators and adherence trajectories were mostly in line with those obtained using dichotomous nonadherence (PDC <80%). However, tra-jectory models allowed a more refined description of adher-ence. The overall rates of statin nonadherence in this study were comparable to recent estimates from Finland31 and those from other countries.7 Also our trajectories were similar to those presented in previous research.17,18
Our results accord with a previous Finnish study of patients with CHD where socioeconomic disparities were found in statin use only among men.21 The previously reported association between lower income and lower statin adher-ence7,9–12 was seen among men in our study. In line with our Table 3. Multivariable Odds Ratios* and 95% Confidence Intervals From Women’s Separate Socioeconomic Position Models for PDC <80% vs ≥80% and Nonadherence Trajectories vs Near-Perfect Adherence Associated With Income Level, Education Level, and Labor Market Status
Socioeconomic Position PDC <80%
Very Rapidly Declining Adherence
Rapidly Declining Adherence
Varying Adherence
Slowly Declining Adherence
Mild Nonadherence Income (n=64 896)
First quintile (lowest) 1.01 (0.95–1.08) 0.99 (0.89–1.10) 1.04 (0.90–1.19) 0.88 (0.80–0.98) 0.88 (0.78–0.99) 0.83 (0.76–0.90) Second quintile 0.99 (0.93–1.05) 0.99 (0.89–1.10) 1.04 (0.90–1.20) 0.89 (0.81–0.99) 0.89 (0.79–1.01) 0.86 (0.79–0.94) Third quintile 0.96 (0.90–1.02) 0.95 (0.86–1.06) 1.02 (0.89–1.17) 0.92 (0.83–1.01) 0.92 (0.82–1.04) 0.93 (0.85–1.01) Fourth quintile 1.00 (0.94–1.06) 0.99 (0.90–1.10) 1.06 (0.92–1.22) 0.99 (0.89–1.09) 1.00 (0.89–1.13) 0.99 (0.90–1.08)
Fifth quintile (highest) 1.0 1.0 1.0 1.0 1.0 1.0
Education (n=65 205)
Basic 0.95 (0.91–0.99) 0.96 (0.90–1.03) 0.91 (0.82–1.00) 0.89 (0.83–0.95) 0.87 (0.80–0.95) 0.91 (0.86–0.97) Secondary 0.98 (0.93–1.02) 1.02 (0.94–1.09) 0.97 (0.87–1.07) 0.96 (0.89–1.03) 0.99 (0.91–1.07) 1.00 (0.94–1.07)
Higher-degree 1.0 1.0 1.0 1.0 1.0 1.0
Labor market status (n=65 205)
Unemployed 0.96 (0.91–1.02) 0.88 (0.80–0.97) 0.89 (0.78–1.01) 0.85 (0.78–0.93) 0.88 (0.79–0.98) 0.83 (0.76–0.89) Retired 0.91 (0.86–0.96) 0.85 (0.78–0.93) 0.82 (0.73–0.92) 0.83 (0.76–0.91) 0.77 (0.69–0.85) 0.81 (0.75–0.87) Outside the labor market 1.11 (1.00–1.22) 0.99 (0.85–1.16) 1.16 (0.95–1.41) 0.83 (0.71–0.97) 0.79 (0.65–0.95) 0.75 (0.65–0.86)
Employed 1.0 1.0 1.0 1.0 1.0 1.0
PDC indicates proportion of days covered.
*All models were adjusted for the baseline characteristics (Table 1).
Figure 1. Adherence trajectories. Solid
lines present the predicted probability of being adherent (PDC ≥80%) in each group. Dashed lines present the observed proportion of adherent individuals in each group.
results, in a Danish study,9 the income–adherence association was stronger among men, and income had virtually no impact on nonadherence in women aged 65 to 84 years.
Previous research has reported conflicting results on the association between education and statin adherence.9–11,13,14
In a Danish study,10 higher education was associated with a lower risk of break in statin therapy among patients aged 30 to 64 years but not among patients aged 65 to 74 years. Most of these studies were based on cohorts including both men and women.10,11,13,14 In the study by Wallach-Kildemoes et al,9 Figure 2. Assignment to adherence trajectory groups by socioeconomic position indicator categories and sex: (A) men, income quintiles;
(B) men, education level; (C) men, labor market status; (D) women, income quintiles; (E) women, education level; and (F) women: labor
market status.
higher education was associated with a lower risk of nonad-herence among men but with a higher risk among women in whom the association was strengthened after adjustment for income. Our findings were similar to the preceding study although the slightly lowered risk of nonadherence among women with basic education (OR, 0.95) is not likely to be clinically significant. This finding highlights the need for future studies on the reasons for sex differences in effects of education on nonadherence. Potential reasons include engage-ment in unhealthy lifestyle in general32 and lower health lit-eracy among men with low education as lower health litlit-eracy has been linked with both male sex and low education.33 Conversely, the controversy about the risks and benefits of statins may specifically affect the adherence of better educated women as they seem to have the greatest interest in health information.34
Low income and education were especially associated with rapidly declining adherence among men in our study. Cost-related barriers, even under universal healthcare and drug reimbursement, are a likely explanation for nonadher-ence among men with low SEP in addition to the previously mentioned unhealthy lifestyle and lower health literacy. It seems that men with low SEP may need more support and more active follow-up especially at the beginning of treatment.
The reason for the absence of any clear association between SEP and statin adherence in women may be that there are other, stronger risk factors for women’s statin non-adherence that mask the SEP differences. One of these factors may be adverse effects because, compared to men, women are more likely to report statin-related adverse effects and to stop statin treatment because of them.35
Strengths and Limitations
Strengths of our study include the usage of trajectory analysis to depict the development of nonadherence in addition to the overall dichotomized PDC. GBTM accounts for the dynamic nature of adherence and is, therefore, suitable for distinguish-ing between different adherence behaviors because individuals with different behaviors may have identical PDC values.17 Our results suggest that trajectories could provide insight into statin adherence and its association with SEP indicators compared with the dichotomized PDC. However, as the results based on both adherence measures conveyed a similar message, the less sophisticated measurements may be sufficient, considering the workload related to conducting GBTM. For example, future studies could determine whether those with rapidly declining adherence can be identified with simpler indicators such as discontinuation after the first dispensation.36 Another strength of our study is that we used 3 different SEP indicators. SEP indicators are not interchangeable but partially independent and interindependent determinants of health.37 We also had access to individual-level SEP data instead of area-level data, and our cohort, whose reimbursement was not dependent on their income level, was relatively homogenous.
Our study has some potential limitations. First, we may have misclassified adherence. The Prescription Register includes only reimbursed medications and before 2006 medi-cations were not reimbursed if a fixed deductible (€10 per dispensation) was not exceeded. Most importantly, we did not
capture nonadherence resulting from dispensed but unused medications or from unfilled prescriptions (ie, primary non-adherence). The true association between SEP and statin nonadherence may be stronger than the association shown in our study because our data included only patients who initi-ated treatment. Finns with lower income or education have reported more often cost-related barriers to prescription medi-cation use than individuals with higher income or edumedi-cation,38 and higher income has been shown to be associated with bet-ter primary adherence.39 Second, we may have misclassified patients’ labor market status in relation to statin initiation because this variable was based on data from the last week of the calendar year of initiation. Third, our data are from years 2001 to 2006. Although income differentials in Finland were nearly the same in 2012 as in 2001,40 the prices of statins have decreased potentially decreasing the differences across income groups. In the beginning of 2016, however, a €50 annual deductible for medication reimbursements was intro-duced in Finland,41 which may again widen differences in adherence across income groups. Furthermore, although clini-cal guidelines nowadays recommend assessment of patients’ global CVD risk instead of CHD risk as the basis for treatment initiation, treatment goals are the same for the majority of pri-mary prevention patients as during the study period (Table X in the Data Supplement).
Fourth, a model with >6 groups would have fitted the data better than our final model (Table V in the Data Supplement), suggesting that the distribution of person-specific trajectories is basically continuous. Although our decision on the number of trajectory groups was based on interpretability and previous research,17 the groups are more likely to be constructed than real. Fifth, our multivariable models included comorbidities that are plausibly mediators of the effect of SEP on adher-ence.5 However, potential overadjustment would not affect our conclusions as the age-adjusted ORs between SEP indicators and adherence were close to the multivariable-adjusted ORs (Tables XI and XII in the Data Supplement). Finally, differ-ences in the age distributions between employed and retired patients were considerable; thus, confounding by age may have masked the difference in nonadherence between retired and employed men and led to an apparent difference among women. A previous longitudinal study found that after retire-ment, nonadherence increased among those who had started statin use while still employed.42
Conclusions
Lower SEP was associated with lower adherence among men, but these associations were weak and inconsistent among women according to both adherence measures. The use of GBTM provided insight into the dynamics of statin adher-ence and its association with SEP indicators. Our results on the association between SEP and statin nonadherence call for more attention on patients with low SEP in Finland and other countries regardless of the health insurance and drug benefit systems.
Sources of Funding
E. Aarnio was funded by state funding for university-level health re-search (grant L 3820, Turku University Hospital). A.N. Winn is funded
by the Royster Society of Fellows. Drs Huupponen and Korhonen have been funded by grants from the Social Insurance Institution of Finland (10/26/2007) and the Academy of Finland (number 138255). The funders had no role in the design, analyses, interpretation of data, writing the report, or in the decision to submit the article.
Disclosures
E. Aarnio has received consultancy fees from ESiOR Ltd. Dr Martikainen is the senior partner of ESiOR Ltd, which provides health economic and outcomes research services for pharmaceutical compa-nies and hospitals. Dr Huupponen is a member of the Advisory Board for Social and Medical Affairs of the Social Insurance Institution of Finland. The other authors report no conflicts.
References
1. Clark AM, DesMeules M, Luo W, Duncan AS, Wielgosz A. Socioeconomic status and cardiovascular disease: risks and implications for care. Nat Rev Cardiol. 2009;6:712–722. doi: 10.1038/nrcardio.2009.163.
2. Marshall IJ, Wang Y, Crichton S, McKevitt C, Rudd AG, Wolfe CD. The effects of socioeconomic status on stroke risk and outcomes. Lancet Neurol. 2015;14:1206–1218. doi: 10.1016/S1474-4422(15)00200-8. 3. Mackenbach JP, Stirbu I, Roskam AJ, Schaap MM, Menvielle G, Leinsalu
M, Kunst AE; European Union Working Group on Socioeconomic Inequalities in Health. Socioeconomic inequalities in health in 22 European countries. N Engl J Med. 2008;358:2468–2481. doi: 10.1056/ NEJMsa0707519.
4. Hanley GE, Morgan S, Reid RJ. Income-related inequity in initia-tion of evidence-based therapies among patients with acute myocar-dial infarction. J Gen Intern Med. 2011;26:1329–1335. doi: 10.1007/ s11606-011-1799-1.
5. Havranek EP, Mujahid MS, Barr DA, Blair IV, Cohen MS, Cruz-Flores S, Davey-Smith G, Dennison-Himmelfarb CR, Lauer MS, Lockwood DW, Rosal M, Yancy CW; American Heart Association Council on Quality of Care and Outcomes Research, Council on Epidemiology and Prevention, Council on Cardiovascular and Stroke Nursing, Council on Lifestyle and Cardiometabolic Health, and Stroke Council. Social Determinants of Risk and Outcomes for Cardiovascular Disease: A Scientific Statement From the American Heart Association. Circulation. 2015;132:873–898. doi: 10.1161/CIR.0000000000000228.
6. Taylor F, Huffman MD, Macedo AF, Moore TH, Burke M, Davey Smith G, Ward K, Ebrahim S. Statins for the primary prevention of cardiovascu-lar disease. Cochrane Database Syst Rev. 2013;1:CD004816.
7. Lemstra M, Blackburn D, Crawley A, Fung R. Proportion and risk indica-tors of nonadherence to statin therapy: a meta-analysis. Can J Cardiol. 2012;28:574–580. doi: 10.1016/j.cjca.2012.05.007.
8. Alsabbagh MH, Lemstra M, Eurich D, Lix LM, Wilson TW, Watson E, Blackburn DF. Socioeconomic status and nonadherence to antihy-pertensive drugs: a systematic review and meta-analysis. Value Health. 2014;17:288–296. doi: 10.1016/j.jval.2013.11.011.
9. Wallach-Kildemoes H, Andersen M, Diderichsen F, Lange T. Adherence to preventive statin therapy according to socioeconomic position. Eur J Clin Pharmacol. 2013;69:1553–1563. doi: 10.1007/ s00228-013-1488-6.
10. Rasmussen JN, Gislason GH, Rasmussen S, Abildstrom SZ, Schramm TK, Køber L, Diderichsen F, Osler M, Torp-Pedersen C, Madsen M. Use of statins and beta-blockers after acute myocardial infarction according to income and education. J Epidemiol Community Health. 2007;61:1091– 1097. doi: 10.1136/jech.2006.055525.
11. Citarella A, Kieler H, Sundström A, Linder M, Wettermark B, Berglind IA, Andersen M. Family history of cardiovascular disease and influence on statin therapy persistence. Eur J Clin Pharmacol. 2014;70:701–707. doi: 10.1007/s00228-014-1659-0.
12. Alsabbagh MW, Lix LM, Eurich D, Wilson TW, Blackburn DF. Multiple-domain versus single-Multiple-domain measurements of socioeconomic status (SES) for predicting nonadherence to statin medications: an observa-tional population-based cohort study. Med Care. 2016;54:195–204. doi: 10.1097/MLR.0000000000000468.
13. Warren JR, Falster MO, Fox D, Jorm L. Factors influencing adherence in long-term use of statins. Pharmacoepidemiol Drug Saf. 2013;22:1298– 1307. doi: 10.1002/pds.3526.
14. Selmer R, Sakshaug S, Skurtveit S, Furu K, Tverdal A. Statin treatment in a cohort of 20 212 men and women in Norway according to cardiovascular
risk factors and level of education. Br J Clin Pharmacol. 2009;67:355– 362. doi: 10.1111/j.1365-2125.2008.03360.x.
15. Nagin DS, Odgers CL. Group-based trajectory modeling in clinical re-search. Annu Rev Clin Psychol. 2010;6:109–138. doi: 10.1146/annurev. clinpsy.121208.131413.
16. Modi AC, Rausch JR, Glauser TA. Patterns of nonadherence to antiepi-leptic drug therapy in children with newly diagnosed epilepsy. JAMA. 2011;305:1669–1676. doi: 10.1001/jama.2011.506.
17. Franklin JM, Shrank WH, Pakes J, Sanfélix-Gimeno G, Matlin OS, Brennan TA, Choudhry NK. Group-based trajectory models: a new ap-proach to classifying and predicting long-term medication adherence. Med Care. 2013;51:789–796. doi: 10.1097/MLR.0b013e3182984c1f. 18. Franklin JM, Krumme AA, Tong AY, Shrank WH, Matlin OS, Brennan
TA, Choudhry NK. Association between trajectories of statin adherence and subsequent cardiovascular events. Pharmacoepidemiol Drug Saf. 2015;24:1105–1113. doi: 10.1002/pds.3787.
19. Kilpi F, Silventoinen K, Konttinen H, Martikainen P. Disentangling the relative importance of different socioeconomic resources for myocardial infarction incidence and survival: a longitudinal study of over 300,000 Finnish adults. Eur J Public Health. 2016;26:260–266. doi: 10.1093/ eurpub/ckv202.
20. Vehko T, Manderbacka K, Arffman M, Reunanen A, Keskimäki I. Increasing resources effected equity in access to revascularizations for patients with diabetes. Scand Cardiovasc J. 2010;44:237–244. doi: 10.3109/14017431.2010.494309.
21. Manderbacka K, Keskimäki I, Reunanen A, Klaukka T. Equity in the use of antithrombotic drugs, beta-blockers and statins among Finnish coronary patients. Int J Equity Health. 2008;7:16. doi: 10.1186/1475-9276-7-16. 22. Furu K, Wettermark B, Andersen M, Martikainen JE, Almarsdottir AB,
Sørensen HT. The Nordic countries as a cohort for pharmacoepidemio-logical research. Basic Clin Pharmacol Toxicol. 2010;106:86–94. doi: 10.1111/j.1742-7843.2009.00494.x.
23. World Health Organization (WHO). ATC/DDD index 2016. http://www. whocc.no/atc_ddd_index/. Accessed February 24, 2016.
24. Peltola M, Juntunen M, Häkkinen U, Rosenqvist G, Seppälä TT, Sund R. A methodological approach for register-based evaluation of cost and outcomes in health care. Ann Med. 2011;43(Suppl 1):S4–13. doi: 10.3109/07853890.2011.586364.
25. Stone NJ, Robinson JG, Lichtenstein AH, Bairey Merz CN, Blum CB, Eckel RH, Goldberg AC, Gordon D, Levy D, Lloyd-Jones DM, McBride P, Schwartz JS, Shero ST, Smith SC Jr, Watson K, Wilson PW, Eddleman KM, Jarrett NM, LaBresh K, Nevo L, Wnek J, Anderson JL, Halperin JL, Albert NM, Bozkurt B, Brindis RG, Curtis LH, DeMets D, Hochman JS, Kovacs RJ, Ohman EM, Pressler SJ, Sellke FW, Shen WK, Smith SC Jr, Tomaselli GF; American College of Cardiology/American Heart Association Task Force on Practice Guidelines. 2013 ACC/AHA guideline on the treatment of blood cholesterol to reduce atheroscle-rotic cardiovascular risk in adults: a report of the American College of Cardiology/American Heart Association Task Force on Practice Guidelines. Circulation. 2014;129(25 suppl 2):S1–45. doi: 10.1161/01. cir.0000437738.63853.7a.
26. Romppainen T, Rikala M, Aarnio E, Korhonen MJ, Saastamoinen LK, Huupponen R. Measurement of statin exposure in the absence of informa-tion on prescribed doses. Eur J Clin Pharmacol. 2014;70:1275–1276. doi: 10.1007/s00228-014-1737-3.
27. Peterson AM, Nau DP, Cramer JA, Benner J, Gwadry-Sridhar F, Nichol M. A checklist for medication compliance and persistence stud-ies using retrospective databases. Value Health. 2007;10:3–12. doi: 10.1111/j.1524-4733.2006.00139.x.
28. Karve S, Cleves MA, Helm M, Hudson TJ, West DS, Martin BC. Good and poor adherence: optimal cut-point for adherence measures using ad-ministrative claims data. Curr Med Res Opin. 2009;25:2303–2310. doi: 10.1185/03007990903126833.
29. Perk J, De Backer G, Gohlke H, Graham I, Reiner Z, Verschuren M, Albus C, Benlian P, Boysen G, Cifkova R, Deaton C, Ebrahim S, Fisher M, Germano G, Hobbs R, Hoes A, Karadeniz S, Mezzani A, Prescott E, Ryden L, Scherer M, Syvänne M, Scholte op Reimer WJ, Vrints C, Wood D, Zamorano JL, Zannad F; European Association for Cardiovascular Prevention & Rehabilitation (EACPR); ESC Committee for Practice Guidelines (CPG). European Guidelines on cardiovascular disease preven-tion in clinical practice (version 2012). The Fifth Joint Task Force of the European Society of Cardiology and Other Societies on Cardiovascular Disease Prevention in Clinical Practice (constituted by representatives of nine societies and by invited experts). Eur Heart J. 2012;33:1635–1701. doi: 10.1093/eurheartj/ehs092.
30. Jones BL, Nagin DS, Roeder K. A SAS procedure based on mixture models for estimating developmental trajectories. Sociol Methods Res. 2001;29:374–393.
31. Korhonen MJ, Halonen JI, Brookhart MA, Kawachi I, Pentti J, Karlsson H, Kivimäki M, Vahtera J. Childhood adversity as a predictor of non-ad-herence to statin therapy in adulthood. PLoS One. 2015;10:e0127638. doi: 10.1371/journal.pone.0127638.
32. Laaksonen M, Talala K, Martelin T, Rahkonen O, Roos E, Helakorpi S, Laatikainen T, Prättälä R. Health behaviours as explanations for educa-tional level differences in cardiovascular and all-cause mortality: a fol-low-up of 60 000 men and women over 23 years. Eur J Public Health. 2008;18:38–43. doi: 10.1093/eurpub/ckm051.
33. van der Heide I, Rademakers J, Schipper M, Droomers M, Sørensen K, Uiters E. Health literacy of Dutch adults: a cross sectional survey. BMC Public Health. 2013;13:179. doi: 10.1186/1471-2458-13-179.
34. Eriksson-Backa K, Ek S, Niemelä R, Huotari ML. Health informa-tion literacy in everyday life: a study of Finns aged 65-79 years. Health Informatics J. 2012;18:83–94. doi: 10.1177/1460458212445797. 35. Karalis DG, Wild RA, Maki KC, Gaskins R, Jacobson TA, Sponseller
CA, Cohen JD. Gender differences in side effects and attitudes regard-ing statin use in the Understandregard-ing Statin Use in America and Gaps in Patient Education (USAGE) study. J Clin Lipidol. 2016;10:833–841. doi: 10.1016/j.jacl.2016.02.016.
36. Lemstra M, Blackburn D. Nonadherence to statin therapy: discontinuation after a single fill. Can J Cardiol. 2012;28:567–573. doi: 10.1016/j.cjca.2012.03.018. 37. Lahelma E, Martikainen P, Laaksonen M, Aittomäki A. Pathways between
socioeconomic determinants of health. J Epidemiol Community Health. 2004;58:327–332.
38. Aaltonen K, Miettinen J, Airio I, Martikainen JE, Saastamoinen LK, Bell JS, Hartikainen S, Norris P. Cost-related barriers to use of health services and prescription medicines in Finland: a cross-sectional survey. Eur J Public Health. 2015;25:368–372. doi: 10.1093/eurpub/cku176.
39. Pottegård A, Christensen Rd, Houji A, Christiansen CB, Paulsen MS, Thomsen JL, Hallas J. Primary non-adherence in general practice: a Danish register study. Eur J Clin Pharmacol. 2014;70:757–763. doi: 10.1007/s00228-014-1677-y.
40. Official Statistics of Finland (OSF). Income distribution statistics 2012. Statistics Finland; 2014. www.stat.fi/til/tjt/2012/04/tjt_2012_04_2014-05-27_en.pdf. Accessed February 24, 2016.
41. Amendment 1656/2015 to the Finnish Health Insurance Act 1224/2004. http://www.finlex.fi/fi/laki/ajantasa/2004/20041224 (available in Finnish only). Accessed February 24, 2016.
42. Halava H, Westerlund H, Korhonen MJ, Pentti J, Kivimäki M, Kjeldgård L, Alexanderson K, Vahtera J. Influence of Retirement on Adherence to Statins in the Insurance Medicine All-Sweden Total Population Data Base. PLoS One. 2015;10:e0130901. doi: 10.1371/journal.pone.0130901.