Territory or Ideology:
Cooperation Between Members in the European
Parliament Revisited
Harmen van der Veer, BA
∗26th August 2013
Research Master Thesis
(Political Science & Public Administration, Leiden University) Supervisor: Dr. Adam W. Chalmers – second reader: Dr. Huib Pellikaan
Student number: 0601640 Word count: 11.845
ABSTRACT – What drives the decision of members of the European Parliament (MEPs) to work together, are they working together because they agree on policy principles (ideology) or do they work together because they are from the member state or region (geography)? This question is at the core of this paper. By employing a sophisticated and specifically for this paper crafted computer program analysing EP resolutions, I find that ideology becomes less of a factor in the decision to cosponsor a proposal and nationhood becomes more important. This creates difficult questions for European integration.
KEYWORDS – European Parliament, resolutions, cosponsorship, roll-call votes, ideology, na-tionality
∗
1 Introduction
The European Parliament (EP), directly elected by the European people since 1979, is a unique insti-tution in multiple ways. It is a parliament that is at the same time powerful and powerless. Powerful because of the wide (and expanding) range of in-struments available to its members, and powerless because of the low turnout among the citizens it is precisely set up to represent. As the house of the people, the Parliament is an arena where policy is fought out. Because of the multiple overlapping jur-isdictions that shape the relations between the con-stituent parts of the European Union, however, it is by no means clearwho actually fights– and for what
reason. Are the members of the European Parlia-ment (MEPs) ‘fighting’ in territorial or in ideological groups? The central question driving this research is
How do ideology and nationality translate into the le-gislative behaviour of members of the European Par-liament?
The existing literature suggests that the answer to this question is quite clear: it is ideology and European partygroups that determine who fights with and against whom. However, these partygroups are by no means just another form of party – one of the quintessential features of a party is that it is in one way or the other able to nominate candidates for office, yet the Europarties have to rely upon na-tional parties to do so. This creates unclear loyalties for MEPs. At the one hand, they need the Euro-parties for positions of power within parliamentary committees or delegations, but at the other hand, they cannot do so without being elected, for which they need their national parties. To complicate mat-ters even further, elections to the European Parlia-ment are mostly second-order elections where na-tional topics, priorities, and interests dominate the agenda of voters. At the very same time voters be-come more and more critical of European integra-tion. This brings up the question of how it can be that national interests do not seem to translate into the parliamentary behaviour of MEPs, as the
exist-ing literature suggests.
My argument why nationality might be more im-portant than what we know now is twofold. First, the existing research uses data and methodologies which might very well produce erroneous informa-tion. Second, because of a number of factors such as the ever-larger number of member states, the fin-ancial and economic crisis of 2008, and a renewed focus upon the nation states’ importance for demo-cratic legitimacy, the nationality of a MEP becomes more important than his or her ideological position in cooperating with other MEPs. Exactly because most scholars argue that it is ideology that drives the legislative behaviour of MEPs, the EP is a hard case for my argument.
I will answer my research question by using data on the fifth, sixth and seventh terms of the EP (re-spectively from 1999 to 2004, 2004 to 2009, and 2009 up to halfway 2013) by examining who spon-sors proposals with whom – a rather novel approach in political science. As Louwerse and Otjes (2013, p. 2) put it: "the study of parliamentary behaviour should not only look at the final vote, but also at the question who tables proposals and, specifically, how MPs work together in tabling proposals". To test whether ideology or nationality influences the decision to work together, I will craft a number of hypotheses. These hypotheses will be put to the test by analysing dyadic data: all combinations of pairs of two MEPs, where I have coded the number of times the two MEPs have worked together (as a pro-portion of the total number of proposals signed by the first MEP), and a number of predictor variables. The huge resulting dataset, containing well over two million observations, is analysed through a logistic regression and a binomial linear regression.
At the same time, cooperation between MEPs who share one or more committees increases drastically, suggesting that the EP might follow the same pat-terns of specialisation as some scholars find for other parliaments.
The structure of this paper is as follows: first, the current findings on cooperation in the Parliament will be discussed, followed by the limitations of these findings. Second, an overview of the method of co-sponsorship analysis will be discussed, followed by the hypotheses, data, and research methods. The fi-nal two sections provide the results and a discussion thereof.
2 Explaining Cosponsorship in the
European Parliament
European integration theorists, most notably Ernst B. Haas and Andrew Moravcsik, have divergent an-swers to the question of how ideology and national-ity translate into the legislative behaviour of MEPs. Haas’ (1958, p. 16) argument is that European integ-ration creates "loyalties, expectations and political activities" that are shifted towards a "new centre" – in other words, the European Parliament and the partygroups demand (or just get) the loyalty of their members. If this is the case, however, these loy-alties are duly tested by the loyloy-alties towards na-tional parties and more-critical nana-tional electorates. Moreover, crises like the economic and financial crisis put stress on the relations between member states – and therefore potentially also between the peoples of these member states and their MEPs who cooperate in partygroups. Moravcisk (1998, p. 18), by con-trast, argues that it is not so much loyalties that drive integration, but "a series of rational choices made by national leaders". Changing one’s choice seems much simpler than changing one’s loyalty, thus when a crisis hits Europe, we could very well see a shift in loyalties away from Europe back to the mem-ber states.
Traditional explanations of the legislative behaviour of MEPs have focussed on two strands of research: first, that of socialisation and attitudes of MEPs (e.g., Farrell and Scully, 2007), and second, on the way MEPs vote (e.g., Hix, Noury, and Roland, 2007). The questions driving these research projects is that of alignment: how do MEPs align, is it ac-cording to national lines, or is it ideology? In other words: when we want to predict (voting) behaviour of members, should we then look at what country a member is from, or should we look at the member’s partygroup? Overwhelmingly, the answer seems to be that, at least with regard to voting behaviour, ideology is what drives the decision to vote in a certain matter for or against a piece of legislation. Members vote like their partygroup peers, not alike their compatriots.
A number of scholars, however, have noted serious problems with the approach of using voting data, mainly focussing on problems of data selection (An-deweg, 1995; Carrubba, Gabel, and Hug, 2009; Faas, 2003). While the approach relying on inter-views and surveys of MEPs indeed paints a very rich picture, it lacks the possibility of a thorough analysis of who works with whom. It is simply impossible to ask all, or a representative sample of, MEPs with whom they have worked together; if only because of memory recall issues. A new way of investigat-ing how and under what circumstances MEPs work together is therefore needed.
because of the shared, overlapping and distinct com-petences of each of the institutions in the EU. Draft-ing policy in the Union, from the perspective of the EP, works through resolutions. When adopted, the EP takes the stance as outlined in the resolution. Some of these resolutions are technical in nature, for example the proposing of a candidate for office or the instigation of a new committee, while other resolu-tions are drafted by one or more MEPs containing a policy stance. Examples of such resolutions are the EP adopting a position on what it regards as violations of human rights, on issues stemming from behaviour of members of the European Commission (EC), or any other issue within the jurisdiction of the European Union. In principle, these members can propose policy alone, or recruit others to act as cosignatories (though see the discussion on how free MEPs are in proposing resolutions, in the respect-ive section down below). Since members are free to select cosponsors, looking at who signs with whom
provides valuable information for scholars interested in understanding the (legislative) behaviour of par-liamentarians. As Louwerse and Otjes succinctly put it:
Most of what MPs vote on is proposed by their colleagues. In presidential sys-tems, most bills are tabled by MPs and in parliamentary systems MPs propose mo-tions, amendments, resolutions and legis-lative initiatives. Therefore, the study of parliamentary behaviour should not only look at the final vote, but also at the ques-tion who tables proposals and, specifically, how MPs work together in tabling propos-als. (2013, p. 2)
Selecting one or more cosignatories tells us, some-what obviously, two things: first, that the draftee wants to work together with the cosignatories, and second, that the cosignatory wants to work with the draftee (and any of the other signatories). Members can select cosignatories on a number of grounds: be-cause they agree (e.g., bebe-cause they are closely posi-tioned together on a relevant policy dimension, such
as the left-right scale), because they are from the same partygroup or national political party, or be-cause they are from the same member state. Other factors might include that the signatories are both in one or more committees together, or simply be-cause they like each other. The main point here is that cosponsorship conveys meaningful information about the relation between different members.
The European Parliament is an especially interest-ing parliament for this type of research. Instead of a composition stemming from a single nation, it con-tains elected officials from an ever-increasing num-ber of memnum-ber states, at the moment of writing 28. Various anti-European integration parties are present within the EP itself as well as outside in the member states. For this reason and others it is counter-intuitive that cooperation is found to be almost exclusively along ideological lines, and not along national lines. Combining this intuition with the aforementioned warnings on the use of roll-call vote data stipulates the need to revisit the legislative behaviour of MEPs.
The remainder of this section will discuss the find-ings in the literature on legislative behaviour of MEPs in general, the method of cosponsorship ana-lysis and its application so far, and outlines my the-ory by building several hypotheses.
2.1 Cooperation in the EP: what we know thus far
analyses concern an application of the NOMIN-ATE procedure originally developed by Poole (2005); Poole and Rosenthal (1984), and further expanded by Carroll, Lewis, Lo, Poole, and Rosenthal (2009); Poole, Lewis, Lo, and Carroll (2011). Qualitat-ive and/or survey based research use a much wider palette of methods and data sources, with as prime examples Scully (2005), McElroy and Benoit (2007, 1), Farrell and Scully (2007) and Costello and Thom-son (2010).
2.2 Limitations of current research on roll-call votes
As Haas (1958, p. 16) famously lamented, "political integration is the process whereby political actors in several distinct national settings are persuaded to shift their loyalties, expectations and political activ-ities towards a new centre". Did, however, such a shift occur? When contrasting the two bodies of literature (the roll-call analyses, and the qualit-ative/survey based analyses), one cannot forgo the feeling of being at crossroads: does nationality play an important role in the way in which MEPs operate or not? Hix (2001, p. 663) concludes that "legislat-ive behaviour is mainly along left-right-lines", and that "transnational party group affiliation is more important than national affiliation for determining how MEPs vote". Yet, when asked directly, MEPs see representing their partygroup as secondleast
im-portant task, ranking slightly higher than the low-est ranking task, namely that of representing all the people in the EU (Farrell and Scully, 2007, p. 105). Representing the people of their respective member states is deemed much more important, as is rep-resenting the people who voted for their (national!) party. Unless the preferences of all national parties align perfectly within the EP’s partygroups (which seems highly unlikely), something odd is at work. Why do we not see such patterns in the voting beha-viour of MEPs, given their priorities of representing the peoples of their member states?
There are multiple responses to this question. It
could be that politicians preach their representative roles, but at the end of the day prioritise differently. It could also be that MEPs do actually give priority to representing their national parties’ and member states’ interests, but do so through other instruments than voting. A more far reaching response would be that the results found via the roll-call analyses is simply biased towards finding more unity within partygroups than in reality is the case. This con-clusion is, however, far from new. Andeweg, writing back in 1995 (p. 64–5), suspects that the cohesion in party groups is "at least partly an artefact, caused by the selection of data." Roll-calls can be called by any party group or at least 32 MEPs (Faas, 2003, p. 831). These roll-calls are requested, among other reasons, to "keep a check on [partygroup] members’ participation in a vote" by the partygroup leadership (Jacobs, Corbett, and Shackelton, 1992, p. 83–4). Thus, Andeweg concludes, "[a]ny such analysis of such roll-calls would seem to be biased to find party cohesion." Even Hix (2001, p. 668), who uses EP roll-call data extensively, writes that "the outcome of these votes may be systematically biased".
Roger Scully excellently describes the schism in which the European Parliament operates:
The European Union is the most far-reaching attempt to address the biggest problems that nationalism generates. At one and the same time, the EU upholds the centrality of nation-states within Europe, yet also partially subverts that dominance by establishing and developing institutions of governance at a level beyond the state. (2005, p. v)
and
inter-nationalis surely more accurate than either
of the conventional alternatives. (2005, p. 77)
Given the puzzle above, and that the EP is an in-stitution "beyond the state", the obvious question that springs into mind is whether or not the EP is also beyond the nation? And does it thereby really
subvert the dominance by the nation-states? Scully approaches this question from the angle of socialisa-tion effects. He directly mensocialisa-tions roll-call analysis, arguing that, "at best, voting analysis can give us only limited insight into the intensity of individu-als’ views; with only a few voting options ... we cannot know whether an individual’s endorsement means grudging support, modest enthusiasm or pas-sionate conviction." (p. 15). This criticism seems valid enough for voting, with its limited options; yet does it hold for cosponsorship? Since picking co-sponsors is a (moderately) free act, we can be more certain that the draftees, at the very least, are mod-estly enthusiastic about a bill. Such a new approach to discover how and when MEPs cooperate is thus more than welcome.
2.3 Cosponsorship in the literature
Looking at who proposes with whom is a somewhat new approach to investigate the networks in which parliamentarians, representatives and senators oper-ate. The United States Congress has received the most attention, with a number of different studies on sponsorship (Fowler, 2006; Kessler and Kre-hbiel, 1996; Koger, 2003; Talbert and Potoski, 2002; Wilson and Young, 1997). Other coun-tries include The Netherlands (Louwerse and Otjes, 2013), Argentina (Alemán, Calvo, Jones, and Ka-plan, 2009), and Chile (Crisp, Kanthak, and Lei-jonhufvud, 2004).
The core finding of most of the aforementioned stud-ies is that there is a high degree of overlap between with whom legislators propose and with how sim-ilar legislators vote, especially for "legislatures ... in
which parties are relatively weak" (Louwerse and Otjes, 2013, p. 2). In other words: if a legis-lator proposes with someone, these legislegis-lators are also more likely than those who do not, or less often, propose together, to vote both yea or both nay for any bill. This is ideal for our case. Roll-call votes cover about one-thirds of the total number of votes, and these roll calls might not be representative of the entire set of votes. If we have a second data source and method which provides similar results to roll-call analyses, yet covers a set of data which does not suffer from the same selection effects, we can then easily compare patterns of voting similarity with the patterns of proposing together.
2.4 Hypotheses
In this section, I will develop four sets of hypo-theses. The first relate to ideological explanations of cosponsorship, the second relate to country-related (territorial) explanations, including hypotheses re-lated to the financial and economic crisis of 2008, the third relate to mixed explanations such as party-group membership. The main hypotheses are fo-cussed on ideological and territorial explanations of why a pair of MEPs work together. However, to truly test for ideological and territorial explanations, we should have more hypotheses on possible other factors such as partygroup and committee member-ship. It could be that some committees attract mem-bers from specific countries whilst not from others, and therefore without such a hypothesis we might draw wrong conclusions about the original relation-ship between territory and sponsoring together.1
2.4.1 Ideology
The decision to sponsor together is obviously (at least in part) based on agreeing with what is actu-ally in the proposal itself. Two MEPs who are on an
1
ideological ordering closer together should therefore be more likely to sponsor together. The basic as-sumption of most ideological orderings is that they are utility functions. This means that the further away a proposal (or another MEP) is from the po-sition of a MEP, the lower the value (utility) is of sponsoring that proposal (see, for example, Poole, 2005, p. 48).
However, an ordering of parties or MEPs on one single dimension (such as the ubiquitous left-right) that subsumes all relevant and salient issues, is some-thing that is hotly debated in the literature (e.g. Benoit and Laver, 2006; Budge, Robertson, and Hearl, 1987). A multidimensional ordering of MEPs seems especially welcome since some proposals are economic in nature (then an economic left-right or-dering seems appropriate), while other topics might deal with more or less integration into the European Union (then a pro/anti Europe ordering seems ap-propriate). Therefore, when I speak about ideo-logical distance, multiple dimensions will be con-sidered.
Bringing this together gives us a single hypothesis on Ideological Proximity:
H1: Ideological Proximity Hypothesis: Two
MEPs who are ideologically closer will be more likely to sponsor together more than two MEPs who are ideologically further apart.
2.4.2 Territorial Lines of Conflict
Hix, Noury, and Roland (2007, p. 4) find no import-ant national dimension in terms of the voting beha-viour of MEPs, something these authors ascribe to the European Union’s system of devolution of powers in a federal-like structure which allows decision mak-ing relevant to the respective levels of government (national, European) to stay at that level of govern-ment. As noted in the section on limitations of roll-call analyses, however, this finding might be the res-ult of a bias in the selection (and the availability) of
the data; especially when contrasting this argument with that of Farrell and Scully (2007, p. 105), sug-gesting that national electorates are seen by MEPs as more important than European partygroups. There are a number of reasons why MEPs might decide to ‘go national’ when picking cosponsors for resolu-tions. It could be that MEPs use cosponsorship as a signal towards voters, other MEPs or partygroups; however, a much simpler explanation would be that MEPs sponsor together with those colleagues that speak the same language or have a similar political style. For most MEPs, this means picking someone with the same nationality. This leads to the hypo-thesisNationality:
H2: Nationality Hypothesis: Two MEPs
who are from the same European member state will be more likely to sponsor together more than two MEPs who are not from the same member state.
Nationality is obviously not a magical device that makes MEPs operate in a certain way. As sugges-ted above, it could be that it works through simply knowing your colleagues, or speaking the same (or
a similar) language. The chances of knowing each other increase when the distance between the two member states of the MEPs decrease. These insights lead to the hypothesisGeographical Distance.
H3: Geographical Distance Hypothesis:
Two MEPs that are from member states that are physically located closer by will be more likely to sponsor together than two MEPs who come from member states that are further apart.
Territory does not necessarily equate with national borders. MEPs from a specific group of countries might work together often, while not with countries outside that group. Groups can be drawn in the European Union in an almost infinite number of con-stellations.2 One reason why MEPs might be
work-2
ing together more frequently is because they have done so before. Countries that have been in the EU for a longer time might have created support-ing networks of cooperation between member states. The founding EU 6 countries have known each other longest, so the chances of MEPs from those coun-tries working together are highest. This leads to the hypothesis Early Joiners.
H4: Early Joiners Hypothesis: Two MEPs
who are both from EU 6 countries will be more likely to sponsor together more than two MEPs who are not both from EU 6 countries.
The financial and economic crisis of 2008 weighs heavily on Europe. A number of European member states have been forced to cut down public spend-ing, and, at the same time, the more affluent mem-ber states are asked to (partially) pay for the in-solvable debts of the less-well-of member states. As a consequence, those latter states demand unpre-cedented powers over the national budgets of the former states, leading some scholars to argue that the nation-state is under "assault" (e.g. Baudet, 2012, p. 81). Therefore, politicians might very well opt for less cooperation in party families and more in national or regional groups: MEPs from one member-state voting as a block against MEPs of an-other member-state; or, of MEPs from more afflu-ent European regions versus MEPs from the poorer regions. The academic literature seems to support this story: Claessens (2009, p. 263) speaks of "fiscal nationalism" when he describes state responses to the crisis. The economic crisis of 2008 hit Greece, Ireland, Italy, Portugal, and Spain hard, very derog-atorily subsumed under the acronym PIIGS.3 This
that seem likely to have the highest chance of significantly sponsoring more together.
3
See, however, Quiggin (2012, p. 229), writing about the PIIGS: "The real problem came when this analysis was extended to the rest of the heavily indebted periphery – commonly referred to in such accounts as the PIGS (Por-tugal, Italy, Greece, and Spain) group. Ireland was some-times thrown in as a second ‘I’. This was unfair and in-accurate, particularly as regards Spain and Ireland, which had been running budget surpluses in the years leading up to the crisis." [...THUS WE IGNORE QUIGGIN]
might create incentives for MEPs who are both from PIIGS countries to work together.
There are a number of possible causal explanations why MEPs from hard-hit countries would work to-gether. They could simply try to form a block against the richer countries, either out of policy pref-erences (forming a block to prevent measures im-peding their economies even further), or out of new-found solidarity. The crisis could thus prompt a cul-ture of solidarity in which the MEPs work together, not necessarily because they agree on exact policy terms, but because they share the same problems. This leads to the hypothesis Economic Crisis Solid-arity.
H5: 2008 Economic Crisis Solidarity Hy-pothesis: Two MEPs who both come from
PIIGS countries (Greece, Ireland, Italy, Portugal, or Spain) will sponsor together more after the 2008 economic crisis than
two MEPs from that same set of countries
before the 2008 economic crisis.
Not only the hard-hit countries might see more (or less) cooperation, also all Eurozone countries might. The creation of a banking union and the mere con-sequences of the economic crisis stimulate MEPs from the Eurozone countries to work together more – more in comparison to non-Eurozone MEPs and more in comparison over time.This leads to the hy-pothesisBoth in Eurozone.
H6: Both in Eurozone: Two MEPs who are
both from countries in the Eurozone will sponsor together more than MEPs who are not both from Eurozone countries.
2.4.3 Mixed: principals & agents
closer together than two MEPs who are not both from the same party), or of some other effect such as the partygroup exerting influence on two MEPs to sponsor together? Or, it could be that sponsoring together more while being in the same partygroup is a mixed effect of knowing each other and being
ideologically close. The idea that partygroups act as principals towards its MEPs as agents is propag-ated by Hix (2002): he argues that MEPs are un-der the influence of (at least) two principals: the partygroup, for positions of power, and the national party for nomination at election time. Although the exact causal mechanism is something to investigate further, there are thus good reasons to assume that two MEPs from the same partygroup would spon-sor together more often, than two MEPs who are in different partygroups. This leads to the hypothesis
Same Partygroup.
H7: Same Partygroup Hypothesis: Two
MEPs who share the same partygroup will sponsor together more than two MEPs who do not share the same partygroup.
A second mixed option is that of the same national party. National parties are important because they are necessary for nomination, without a national party, a MEP cannot be placed on the voting ballot. National parties might stimulate that their MEPs cooperate more - it might increase the bargaining power of the national party versus the European partygroup, or versus other national parties – within or outside of the partygroup. Another effect can be that which I noted earlier on in the discussion on territorial lines of conflict. Two MEPs from the same country share the same political culture (and the same political socialisation process), and will know each other for a longer time than most MEPs that are not nominated by the same national party; furthermore, since they are from the same national party, they are ideology-wise probably also closer by than two MEPs who are not from the same national party. This leads to the hypothesis Same National Party.
H8: Same National Party Hypothesis: Two
MEPs who are both nominated by the same national parties will sponsor together more than MEPs who are nominated by different national parties.
A final mixed option is that of shared commit-tees. With the number of parliamentarians, and the sheer amount of work coming at them across a wide range of topics, specialisation is key to mak-ing the work load manageable. This specialisation will therefore probably lead to two MEPs who share one or more committee to propose together more of-ten. For the Dutch parliament, Louwerse and Otjes (2013) find exactly this specialisation effect. At one end, committee-based cosponsoring can be seen as expressing an ideological position: partygroups are probably likely to select and to invest costly time in those committees that are relevant for their con-stituents. A green party will probably select those committees and invest a good deal of time in them, if they are about environmental issues. Since all party-groups will work on this basis, some ideological con-vergence will be happen in the selection of candid-ates for a particular committees – thus these MEPs, for ideological reasons, might cooperate more. How-ever, since most partygroups send MEPs to most committees, this effect is probably small. This sug-gests that when MEPs cooperate because they share one or more committee, this truly is an effect of spe-cialisation rather than ideology. This leads to the hypothesisSharing Committees.
H9: Sharing Committees Hypothesis: Two
MEPs who share more committees will sponsor together more than two MEPs who share less, or no, committees.
3 Data
The data used for the analysis of cosponsorship is that of all publicly available resolutions on the web-site of the European Parliament. The data ranges from 1999 (start fifth EP term) up to June 6, 2013 (midway seventh EP term). A special computer pro-gram has been developed, first, to extract all the res-olutions from the Parliament’s website,and second, to interpret the documents so that they are uni-formly coded into a dataset. Finally, a third module extracts the sponsors from the raw text of the res-olution. This module uses a coarse matching tech-nique to allow for spelling differences (and mistakes on the part of the Parliament’s archival service). To ensure coding reliability, the programme gives an in-dication of the expected number of sponsors (based on word counts), and gives a matching reliability score. This latter measure can be seen as a confid-ence interval for coding names which are not exactly match (e.g., "Michels" instead of "Mitchels"). All unreliable cases were hand-coded (around 90 names on about 40 proposals). A final check consisted of randomly selecting a sample of resolutions and paring human interpretation with that of the com-puter.
The computer program used for the extraction of the data has specifically for this paper been developed by the author. It uses Perl-compatible regular expres-sion ("preg") to extract information from the raw HTML files, which is then entered into a PostgreSQL database. The name-matching algorithms used are the Trigram and Unaccent modules ("pg_trgm", "unaccent"), and for distance calculation the data-base uses the extension Earth Distance (which uses the Great Circle Distance equations to calculate the distance between the capitals of the member states of any two MEPs; modules "cube" and "earthdis-tance"). The data will be released upon publication of this paper via the author’s website, under a Cre-ative Commons license.4
4See http://www.harmen.net/.
3.1 The selection of resolutions
The European Parliament operates under different rules of procedure (following, for example, treaty changes or the Union’s enlargement). Some resol-utions are inherently useless for cosponsorship ana-lysis. Examples of such useless resolutions are tech-nical resolutions forming a new committee, or resol-utions which are proposed by a committee (without explicitly mentioning the names of MEPs). Such res-olutions are not included in the creation of the dy-adic cosponsorship dataset. Also, since the composi-tion of the EP changes drastically after eleccomposi-tions, the most relevant patterns will be found between MEPs in one single EP term.5
The resulting data sets are big. Since we are inter-ested in patterns of cosponsorship (and not of spon-sorship), the dataset (one for each EP term) consists of dyadic relationships. For each combination of two MEPs, the following data is available: the total num-ber of proposals sponsored by the first MEP, the number of these proposals which are also sponsored by the second MEP, a collection of dummy variables (e.g., same country, same partygroup, same national party), and a number of interval-ratio independent variables (e.g., the distance between the left-right positions of the MEPs, the number of committees in which both MEPs take part).
3.2 Operationalisation of the dependent variable
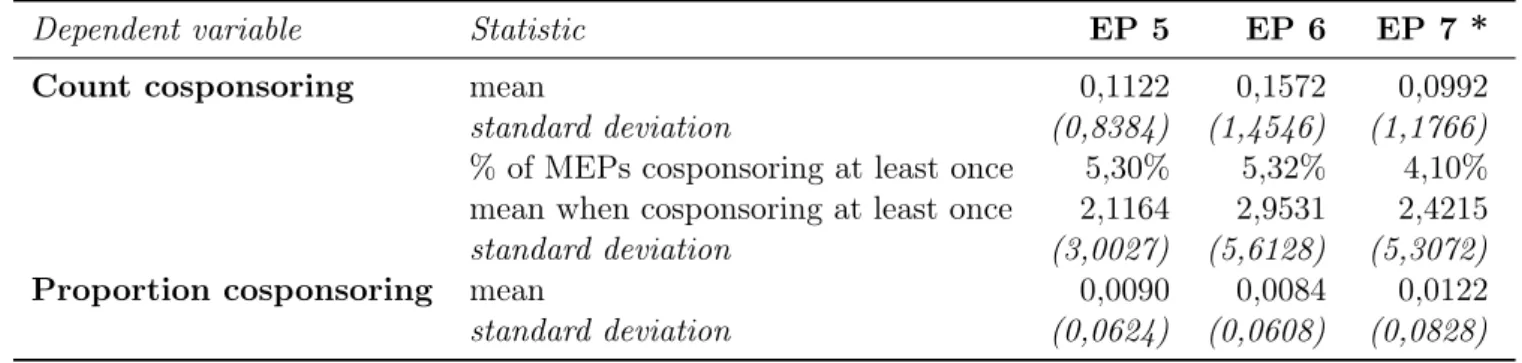
The dependent variable for most analyses will be the proportion of resolutions of the first MEP that are also sponsored by the second MEP.6 The logistic
re-5
Note, though, that an analysis of the persistence of cooper-ation between incumbent MEPs would also be interesting, for example to discover long-term socialisation effects (un-fortunately, this is out of the scope of this paper).
6
Table 1: Overview of the dependent variables
Dependent variable Statistic EP 5 EP 6 EP 7 *
Count cosponsoring mean 0,1122 0,1572 0,0992
standard deviation (0,8384) (1,4546) (1,1766)
% of MEPs cosponsoring at least once 5,30% 5,32% 4,10% mean when cosponsoring at least once 2,1164 2,9531 2,4215
standard deviation (3,0027) (5,6128) (5,3072)
Proportion cosponsoring mean 0,0090 0,0084 0,0122
standard deviation (0,0624) (0,0608) (0,0828) For EP 7, the data on cosponsorship is up to June 7, 2013.
Table 2: Example of the dyadic data
Dyad (MEP 1 - MEP 2) proportion cosponsoring same country same partygroup L-R distance
Brie - Adamou 6 / 114 no yes 1,22
Brie - Alvaro 3 / 114 yes no 4,91
Anastase - Zimmerling 0 / 3 no yes 0,86
(etc.) .. .. .. ..
The data are just for illustratory purposes. Proportion cosponsoring consists of the number of resolutions signed by both MEP 1 and MEP 2, divided by the total number of resolutions signed by MEP 1.
gression uses a dummy variable, which is coded as 1 when the two MEPs in the dyad have ever co-sponsored (one or more) proposals together. For the binomial regression analysis, the dependent variable is an odds ratio vector, consisting of the number of proposals sponsored together to the total number of proposals of the first MEP which are not sponsored
by the second MEP. In the respective sections, I will discuss the dependent variables a bit more.
3.3 Operationalisation of the independent variables
For the independent variables, a combination of self-coding and external sources have been used. For the ideological distance, the positions for MEPs are coded as follows. First, the database created by Döring and Manow (2012) has been imported, by linking the MEPs national party’s position on the left-right, state-market, liberty-authority, and pro-anti EU integration to the each MEP. This allows
the same. It could very well be that Mr. Christian has pro-posed much more than Mrs. Johnson – leading to a lower proportion. See table 2 for a more advanced example.
a comparatively fine-grained positioning of MEPs, even within one single European partygroup (obvi-ously, however, not within each national party). The absolute difference between the position of the first and the second MEP is calculated, giving the close-ness of the two MEPs. Because of the high number of (small) national parties, however, time-series data on the position of each party is not readily available. Therefore, the parties’ ideological scores are taken from the year 2006 (or as close to this year as pos-sible).7 The dummy variable same country, same
partygroup, same national party, and same com-mittee are based on my own calculations, using a number of sources: my own coding, the website of the European Parliament (EP 7 from mid-2012 on-wards), the data of Hix, Noury, and Roland (2007) (some information for EP 6), Hoyland, Sircar, and Hix (2009) (information on EP 1-5, some informa-tion on EP 6 and 7). Table 3 provides an overview
7For parties established after 2006, the first year for which
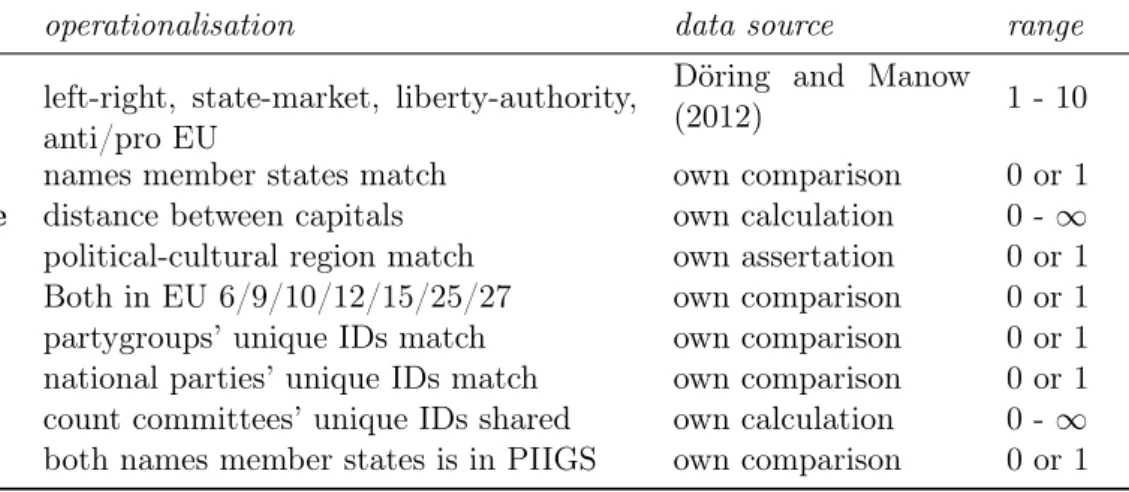
Table 3: Overview of independent indicators
hypothesis operationalisation data source range
Ideological proximity left-right, state-market, liberty-authority, anti/pro EU
Döring and Manow
(2012) 1 - 10
Nationality names member states match own comparison 0 or 1 Geographical distance distance between capitals own calculation 0 -∞ Political culture political-cultural region match own assertation 0 or 1 Early joiners Both in EU 6/9/10/12/15/25/27 own comparison 0 or 1 Same partygroup partygroups’ unique IDs match own comparison 0 or 1 Same national party national parties’ unique IDs match own comparison 0 or 1 Committees shared count committees’ unique IDs shared own calculation 0 -∞ Economic crisis both names member states is in PIIGS own comparison 0 or 1
of the dependent variables per hypothesis.
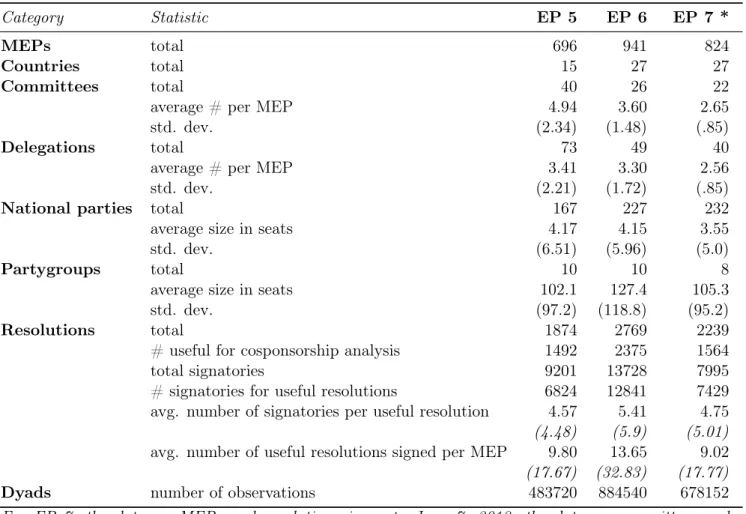
3.4 An overview of the data
Table 4 provides an interview of the data.What is im-mediately clear from this table is that a lot of MEPs have never sponsored together; only about five per-cent of all the combinations of two MEPs have ever (during the parliamentary term) sponsored a pro-posal together. Combining this information with table 4 on the number of resolutions, tells us that on average, each MEP sponsors about ten proposals. This leads us to expect that MEPs are very select-ive in the decision with whom to cosponsor (and it is my theory that this decision is far from random, as outlined in the section on the hypotheses). What is more is that the standard deviation of sponsoring at least once together is quite high, this is probably an effect of the fact that some MEPs hardly sponsor any proposals at all. This observation is backed up by the standard deviation of the average number of useful resolutions signed per MEP.
4 Methods
To answer the hypotheses stated in the preceding sections, two types of analyses will be carried out. Since about 95% of the MEPs, on average, have never worked together, predicting when MEPs work
together is interesting. A dichotomous variable (has
worked together during EP term / has not worked to-gether) allows for a logistic regression analysis. The central question here is what are the predictors for cosponsoring a proposal?
The data, however, is richer and thus allows for a more precise estimation. Linear regression analysis is the method of choice, yet ordinary least squares regression would yield unreliable results because of the type of and distribution of the data. The dyadic cosponsorship proportion (by definition) cannot be normally distributed; instead, the distribution ap-proaches a (negative) binomial distribution. There-fore, I will employ regression analysis for such a dis-tribution. The central question here iswhy do some MEPs cooperate more than others?
5 Results
Table 4: Overview of the data: general statistics
Category Statistic EP 5 EP 6 EP 7 *
MEPs total 696 941 824
Countries total 15 27 27
Committees total 40 26 22
average # per MEP 4.94 3.60 2.65
std. dev. (2.34) (1.48) (.85)
Delegations total 73 49 40
average # per MEP 3.41 3.30 2.56
std. dev. (2.21) (1.72) (.85)
National parties total 167 227 232
average size in seats 4.17 4.15 3.55
std. dev. (6.51) (5.96) (5.0)
Partygroups total 10 10 8
average size in seats 102.1 127.4 105.3
std. dev. (97.2) (118.8) (95.2)
Resolutions total 1874 2769 2239
# useful for cosponsorship analysis 1492 2375 1564
total signatories 9201 13728 7995
# signatories for useful resolutions 6824 12841 7429 avg. number of signatories per useful resolution 4.57 5.41 4.75
(4.48) (5.9) (5.01)
avg. number of useful resolutions signed per MEP 9.80 13.65 9.02
(17.67) (32.83) (17.77)
Dyads number of observations 483720 884540 678152
5.1 Working together
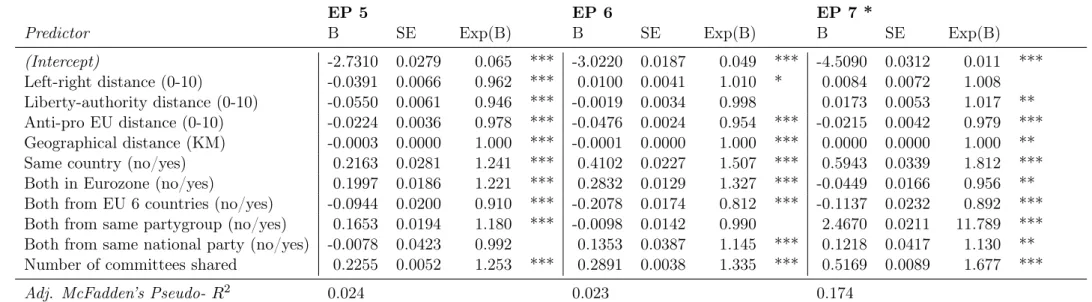
The results of the logistic regression for the depend-ent variable has worked together at least once are
shown in table 5. A number of things are interest-ing from this table: the pseudo-R² is rather low for the first two terms of the European Parliament, but suddenly increases in the last EP, apparently caused by the sudden influence of the variable same party-group. The R² should be interpreted with great care,
if only because any R² is not too valuable in terms of the information it provides for the model fit, and in this particular case because this is not an OLS but a logistic regression, so we deal here with a pseudo-R², complicating things even further. Garry King gives prudent advice:
A high R² is considered to be proof that the correct model has been specified or that the theory being tested is correct. A higher R² in one model is taken to mean that that model is better. All these interpretations are wrong. R² is a measure of the spread of points around a regression line, and it is a poor measure of even that (...) (1986, p. 676)
The next page contains table 5, showing the results for the logistic regression analysis.
5.1.1 The decline of ideology?
Even more interesting than the effect of being in the same partygroup is the role of ideology – or rather, the lack of the role of ideology. All three measures of ideological proximity (i.e., how close two MEPs are on an ideological ordering of the national parties that nominated them) are significant and pointing in the right direction in the first EP term under in-vestigation (EP 5: 1999-2004): a one-point increase of the distance between two legislators translates into a 5 percent lower chance of ever sponsoring to-gether. With the exception of the distance on the anti-pro European integration dimension, however, the effects become more sporadic in the latter two
parliamentary terms. The direction of the left-right distance indicator suddenly becomes positive: this means that the further apart two legislators are, the higher the chances of working together; the most likely explanation for this is a technical one, since ideological distance, same partygroup, and same na-tional party are slightly correlated. Also, the left-right distance is no longer significant for the last EP term. A prediction simulation, in which a hypothet-ical pair of two MEPs who are at the same ideologhypothet-ical point (with a distance of 0) on all three dimensions is compared with a pair of two MEPs who are in all respects albeit ideological distance the same (with a distance of the theoretical maximum of 10 points on all three ideology indicators), confirms this pattern.8
For the last EP, the mean chance of ever sponsoring together increases from 2.222 to 2.321 percent; how-ever, this result is not significant (for p < 0.05). The effect of a pair of MEPs being theoretically furthest apart is significant for the fifth and sixth EP, with the chances of sponsoring together for the fifth EP lowering from 5.3 to 3.634%; and for the sixth EP, the chances of sponsoring together lower from 6.311 to 2.059%. These results are robust, even when con-trolling for within-country variance.9
The figures noted above paint an interesting picture for the role of ideology in the decision to cospon-sor together. Ideology appears to be a rather large factor in the decision to cosponsor together, but only for the fifth and sixth EP terms. Ideology appears to become less relevant over the EP terms: the chances of working together are less or not affected for the sixth and seventh EP, in contrast to the fifth. My ideology hypothesis can thus simultaneously be con-firmed for EP 5 and 6, but rejected for EP 7.
8
Note that all simulation prediction runs were conducted in R 2.15.2 with the packageZelig (version 3.5.4). Attention is spend to make sure that the expected values, the first difference in expected values, and the risk plots take on the shape of a normal distribution.
9
5.1.2 Territorial lines matter (now more)
So far for the results when predicting working together through ideological proximity. Another, somewhat competing, set of explanatory factors relates to territory, or, in other words: where you stand depends on where you sit, to coin Miles’ (1978)
Law.
Judging from table 5, MEPs from the same coun-try have a much higher chance of working together, and the further apart the two capitals of the mem-ber states of the MEPs are, the lower the chances of working together. Rather unexpectedly, MEPs who both come from the founding father countries of the EU (the ‘EU 6’), have a lower chance of work-ing together. Simulation prediction shows that the chances of working together when from the same country increase significantly for all EP terms: from 4.723 percent (when not from the same country) to 5.787 percent (when from the same country), for EP 5; from 4.667 to 6.868 percent, for EP 6; and finally, from 2.148 to 3.825 percent, for EP 7. The last few numbers can be summarised as: the country origins of MEPs matter, and increasingly do so – the hypo-thesis is therefore accepted. Note that I will discuss the relative changes down below.
The geographical distance hypothesis suggests that territory in the very literal sense of the word might matter. When MEPs are from countries that are geographically close, they should thus have a higher chance of working together. Note that in table 5 the effect sizes are rounded off. This does not mean that the effect is necessarily small: the small coeffi-cients are mostly an effect of the measurement of geo-graphical distance (in kilometres). A one-kilometre increase obviously does not affect the chances of co-operating highly; yet a three thousand kilometre in-crease might. Another set of prediction simulations was run, contrasting those who are geographically at the same point (distance of 0 kilometre)10 with
10
One might think that because of setting a distance of 0 kilometres, I introduce a problem of comparing those who are from the same country with those who are not. This,
those who are at the empirical maximum distance of about 3300 kilometres.11 That is, those latter
groups are from MEPs that have capitals furthest apart. The results of the simulation collaborate this story, by showing significant results for all three EP terms: for EP 5, the chances of sponsoring together drop from 6.474 to 2.688 percent; for EP 6 from 5.45 to 3.817 percent; and finally for EP 7, from 2.317 to 2.095 percent. Apparently, geographical distance becomes less of a factor over different EP terms, yet we can accept the hypothesis.
The final hypothesis on territorial explanations of sponsoring together is theEarly Joiners Hypothesis.
I have argued that working together might be ex-plained through being both in the founding EU coun-tries. These countries, in all likelihood, have the strongest ties because of having worked together for a long time (and all having agreed to form some-thing new, instead of ‘just’ joining the already exist-ing institutions of the European Union). The negat-ive coefficients, however, suggest otherwise – namely exactly the opposite effect. When MEPs both come from one of the EU 6 countries, they have a lower chance of working together. The prediction simula-tion turns out that this effect is significant for all three EP terms: from 4.943 to 4.514 percent for EP 5; from 4.943 to 4.052 percent, for EP 6; and for EP 7, from 2.27 to 2.032 percent. The hypothesis is thus rejected.
however, is not the case: the variablesame countryis kept constant by the simulation model. Simulations run with hypothetical cases, after all.
11
Table 5: Logistic regression: model & results
EP 5 EP 6 EP 7 *
Predictor B SE Exp(B) B SE Exp(B) B SE Exp(B) (Intercept) -2.7310 0.0279 0.065 *** -3.0220 0.0187 0.049 *** -4.5090 0.0312 0.011 ***
Left-right distance (0-10) -0.0391 0.0066 0.962 *** 0.0100 0.0041 1.010 * 0.0084 0.0072 1.008 Liberty-authority distance (0-10) -0.0550 0.0061 0.946 *** -0.0019 0.0034 0.998 0.0173 0.0053 1.017 ** Anti-pro EU distance (0-10) -0.0224 0.0036 0.978 *** -0.0476 0.0024 0.954 *** -0.0215 0.0042 0.979 *** Geographical distance (KM) -0.0003 0.0000 1.000 *** -0.0001 0.0000 1.000 *** 0.0000 0.0000 1.000 ** Same country (no/yes) 0.2163 0.0281 1.241 *** 0.4102 0.0227 1.507 *** 0.5943 0.0339 1.812 *** Both in Eurozone (no/yes) 0.1997 0.0186 1.221 *** 0.2832 0.0129 1.327 *** -0.0449 0.0166 0.956 ** Both from EU 6 countries (no/yes) -0.0944 0.0200 0.910 *** -0.2078 0.0174 0.812 *** -0.1137 0.0232 0.892 *** Both from same partygroup (no/yes) 0.1653 0.0194 1.180 *** -0.0098 0.0142 0.990 2.4670 0.0211 11.789 *** Both from same national party (no/yes) -0.0078 0.0423 0.992 0.1353 0.0387 1.145 *** 0.1218 0.0417 1.130 ** Number of committees shared 0.2255 0.0052 1.253 *** 0.2891 0.0038 1.335 *** 0.5169 0.0089 1.677 ***
Adj. McFadden’s Pseudo- R2 0.024 0.023 0.174
Significance: *** p < 0.001; ** p < 0.01; * p < 0.05. For EP 7, the data on cosponsorship is up to June 7, 2013.
The 2008 financial and economic crisis: sudden
solidarity? The results for the Eurozone hypothesis
indicate that working together between the MEPs from the Eurozone countries is lower for the last EP term in comparison with the two before. There are seemingly good reasons for MEPs to cooperate less: when your nation’s political leader is portrayed as Hitler in demonstrations in another European coun-try (as was the case for German Chancellor Angela Merkel in a demonstration in Portugal, see for ex-ample De Volkskrant, 2012), you might want to skip that country’s MEPs when looking for cosponsors for your proposal.
However, the crisis of the Euro and in the Eurozone might also stimulate countries to work together. Es-pecially MEPs from those countries that were hard-est hit, needing emergency loans from the IMF or European institutions, might want to work together. Either out of sheer solidarity, or out of the need to form a block against other countries to prevent European policy that affects the hard-hit countries gravely. This, in short, is the 2008 Economic Crisis Solidarity Hypothesis. To test this hypothesis, a
second set of logistic regression analyses have been run with all the indicators of table 5, but now aug-mented with the variable Both come from PIIGS countries. The (all-significant) exponent-B figures
range from 1.339 for EP 5, 1.079 for EP 6, to 0.851 for the last EP, suggesting that cooperation between these countries is on a steady decline in the period 1999-2013. The prediction simulation confirms this: chances of cooperating for EP 5 increase from 4.647 to 6.129 percent, for EP 6 from 4.771 to 5.125 cent, and for EP 7 down from 2.252 to 1.924 per-cent.
These results suggest that cooperation suffers under economic stress. Instead of solidarity, countries opt to work less together. This rejects my solidarity hy-pothesis.
5.1.3 Mixed predictors: partygroup membership
Four of the hypotheses are of a mixed type: not purely ideology, but also not purely territorial di-viding lines. The same partygroup hypothesis
ex-presses an element of ideology (because being in a partygroup together signals agreement on at least some basic political tenants of policy), yet a left-leaning Christian Democrat (EPP) might, on ideo-logical terms, be much closer to a member of the European Socialist group (PES). Furthermore, be-ing in a partygroup together and sponsoring
to-gether might just be an effect of knowing each other – hardly an ideological motivation. A minor ele-ment of territory is at work in some partygroups as well – broad and large groups such as the So-cialists or Christian Democrats have members from most of the member states, while smaller groups such as the Greens have members from a lower number of member states (and those member states with Green MEPs are not randomly distributed over Europe: they are mainly in Western Europe). The same national party hypothesis is both ideological,
territ-orial, and stemming from socialisation: to begin with the latter, MEPs from the same national party ob-viously have a good chance of knowing each other well. Being in the same national party means that you are from the member state; while the ideolo-gical spread between the national party’s members should be lower than the spread among the more heterogeneous partygroups. Thesharing committees
hypothesis, as discussed in the previous section, has a minor element of ideology and no clear element of territory in it; yet working together more might just be the result of knowing each other, or of spe-cialisation. Finally, theboth in Eurozone hypothesis
suggests that Eurozone members have a common in-terest because of sharing a currency.
sev-enth EP (from 1.259 to 13.06 percent), it does not significantly do so in the sixth EP (down from 4.8 to 4.756 percent, still not significant). The enormous increase in the chances of working together is also the likely reason for the increase in the pseudo-R² of the logit model for the seventh EP. What explains this sudden increase is as of yet unknown: further research is needed to explain this big increase. The hypothesis is therefore accepted for the fifth and sev-enth EP, but rejected for the sixth.
The hypothesis on sharing the same national party does not significantly explain patterns of cosponsor-ship for the fifth EP, but does do so for the sixth and seventh EP. The chances of cooperation for the fifth EP decrease (from 4.821 to 4.779 percent, non-significant), and increase for the sixth EP (from 4.782 to 5.443 percent), as well as for the seventh EP (from 2.227 to 2.507 percent). This shows that sharing the same national party has an effect, but this effect is not significant for all three EP terms under investigation, nor can we speak of an increas-ing role over time of sharincreas-ing the same national party for predicting cooperation in the Parliament. The hypothesis can thus be accepted for the last two EP terms, but not for the first.
Sharing committees has a significant effect in all three EP terms, and the increase in the exponent B values suggest that sharing committees increasingly heightens the chances of working together over time. A prediction simulation, comparing those who share no committees with those who share the lowest em-pirical maximum of all three EP terms, namely shar-ing nine committees, collaborates this story: where the chances of working together in the fifth EP in-crease from 4.051 to 24.323 percent, for the sixth EP from 4.053 to 36.242 percent, and for the seventh EP from 1.88 to 66.744 percent. These increases look very big (and they actually are), but do keep in mind that almost no pair of MEPs share nine committees: these percentages are the results from a simulation after all. See the interpretation of these figures in the concluding paragraph of this section for their mean-ing. In short, we can accept the hypothesis that
says that sharing committees has a positive effect on the chances of cooperating, and that over time the effect gets bigger: (sharing) committees appears to become more relevant for predicting cooperation in Parliament over time.
Table 5 suggests that two MEPs coming both from countries in the Eurozone have, significantly, a higher chance of working together for the fifth (from 4.278 to 5.172 percent) and sixth EP (from 4.334 to 5.674 percent), but actually have a lower chance of working together in the seventh EP (down from 2.274 to 2.175 percent). One could argue that this lowering in working together is a result of the strains put on countries during the economic crisis; leading to less cooperation. Yet, one could conversely argue that the strain put on these countries forces MEPs to work more together (since they have a clear com-mon goal: saving the Eurozone or –at least– pre-venting economic turmoil as much as possible). I could have introduced these two explanations as hy-potheses, however, I feel that more theoretical un-derpinning is necessary for this – which is out of the scope of this paper. If I had these hypotheses
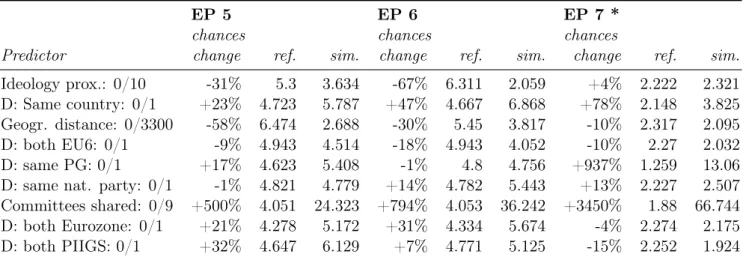
Table 6: Logistic regression: prediction simulation
EP 5 EP 6 EP 7 *
chances chances chances
Predictor change ref. sim. change ref. sim. change ref. sim.
Ideology prox.: 0/10 -31% 5.3 3.634 -67% 6.311 2.059 +4% 2.222 2.321 D: Same country: 0/1 +23% 4.723 5.787 +47% 4.667 6.868 +78% 2.148 3.825 Geogr. distance: 0/3300 -58% 6.474 2.688 -30% 5.45 3.817 -10% 2.317 2.095 D: both EU6: 0/1 -9% 4.943 4.514 -18% 4.943 4.052 -10% 2.27 2.032 D: same PG: 0/1 +17% 4.623 5.408 -1% 4.8 4.756 +937% 1.259 13.06 D: same nat. party: 0/1 -1% 4.821 4.779 +14% 4.782 5.443 +13% 2.227 2.507 Committees shared: 0/9 +500% 4.051 24.323 +794% 4.053 36.242 +3450% 1.88 66.744 D: both Eurozone: 0/1 +21% 4.278 5.172 +31% 4.334 5.674 -4% 2.274 2.175 D: both PIIGS: 0/1 +32% 4.647 6.129 +7% 4.771 5.125 -15% 2.252 1.924
The values after the indicators denote the values for the reference category and the test category, re-spectively. The column ’ref.’ and ’sim.’ give the chances of cosponsoring when, cetris paribus, the independent variable listed is changed to the respective value; the column ’change’ gives the percentage changes between the two. For EP 7, the data on cosponsorship is up to June 7, 2013.
5.1.4 Comparing changes in chances
If we want to say anything about the change over time of the impact for each of the independent vari-ables, we should look at the change in chances. An example might help: say we want to know if the in-fluence of ideology has changed between EP terms. What we know from the discussion in the preced-ing section is that for the fifth EP, the chances of working together are lower when the first MEP is as far apart from the second MEP as possible (i.e. they have an ideological distance of 10 points), when com-pared to two MEPs who are as close as possible as they can (i.e. an ideological distance of 0). The over-all chance of working together drops from 5.3 to 3.6 percent. One could dismiss this as a small decrease (it is after all only 2.3 percentage points) – however, this equals a 31% lower chance of working together. The reason that the percentage point changes are so small is because cooperation is a rare act in Parlia-ment. If we repeat the calculation trick for the sixth EP, we find that the chances decrease by 67%. This means that ideology now has a bigger effect on the average chance of working together than before.
Table 6 shows all the changes. It is important to understand that one can only compare horizontally (i.e. between EP terms for the same independent
variable, so not between independent variables – one should use table 5 for that). Furthermore, it is also important to understand that for all non-dummy variables, the simulation value is set to the theor-etical or empirical maximum. Thus, for the variable
committees shared for EP 7, the chances of
work-ing together increase enormously (by 3450 percent) – but this is only because the empirical maximum number of committees shared is nine. In practice, almost nobody shares nine committees. For this reason (and others) one should not compare inde-pendent variables from this table. What one can conclude, however, is that the number of commit-tees shared increases the chances of sponsoring to-gether when comparing EP terms over time. In other words: committees become much more important in predicting working together.
The main conclusions we can draw from table 6 are the following:
au-thors appear together on a resolution in the European Parliament, this is not because they are on ideological terms close to each other.
2. Territory: Territorial proximity significantly contributes to explaining patterns of cooper-ation in all of the investigated EP terms. Moreover, the chances of cooperating when from the same country increase quite considerably over time: apparently, MEPs revert to choos-ing a colleague from their same member states now more than before. At the same time, geo-graphical distance explains less, meaning that if and when MEPs do cooperate across European borders, they do so irrespective of how far the country of the other MEP is located. The in-crease in the influence of sharing the same na-tional party corroborates this story.
3. Partygroups: The pattern for cooperation with MEPs from the same partygroup is erratic. While the chances increase in EP 5, they de-crease in EP 6; but only to inde-crease very drastic-ally in the seventh EP.
4. Committees: The influence of the number of shared committees becomes bigger over time. This suggests that, as Parliament gets bigger and/or it gets more tasks and responsibilities, MEPs specialise more.
5. Old Boys Network: Cooperation between the founding fathers of the EU, the original six countries that formed the Union’s predecessor, is lower than between other EU 6 and non-EU 6 countries. If there is such a thing as a Europe of multiple speeds, there is apparently not one in which EU 6 countries form an inner group – or any group whatsoever.
6. Euro Crisis: The Eurocrisis appears to have a negative effect on cooperation across MEPs who are both from Eurozone countries. In the fifth and sixth EP, in essence those before the Euro-crisis of 2008, cooperation is on the increase; yet after the onset of the crisis, there actually
is less cooperation. The idea that there is a kind of solidarity between "PIIGS" countries, whether because out of pure solidarity or shared policy preferences, seems untenable. Chances of cooperation between MEPs of these five coun-tries is positive, meaning that MEPs cooperate more, but this cooperation is on the decline and for the seventh EP, the chances of cooperation lower quite remarkably with 15 percent.
5.2 Why do some MEPs work more
together?
The decision to cosponsor together at least once can be because of a relatively random factor, such as running into each other in the elevator. Such events are hard to capture in a (regression) model. There-fore, a more fine-grained analysis helps to uncover what factors influence the decision to cosponsor to-gether more than once. If the same strong effects are found as in the previous logistic regression analyses, then this strengthens the arguments posed in the hypotheses. Predicting the number of occurrences of proposals sponsored together seems like a job for a simple ordinary least squares regression, however, such a model does not incorporate a number of prob-lems when using the dyadic data. An OLS regression might predict values of less than zero (so that not only two MEPs have not worked together, but they have negatively worked together – nice in theory, im-possible in practice), or values higher than one (so that the two MEPs have sponsored more propos-als together than they have put signatures under all of their proposals, evidently also impossible). Fur-thermore, the inherent heteroskedastic nature of pro-portional data invalidates the assumptions on which OLS models rely.12 A generalised linear binomial
regression model, on the other hand, is specifically designed to work with this type of data (see for an ex-cellent discussion of using binomial regression Craw-ley, 2007, pp. 569-91); since such a model uses a
12
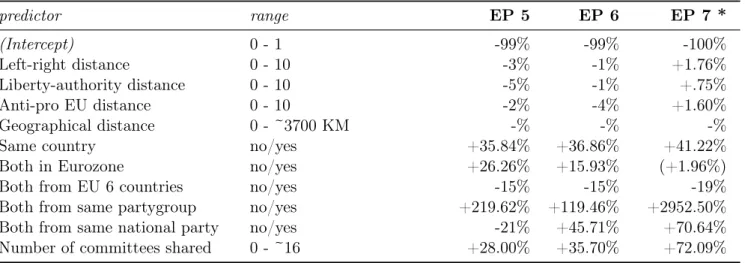
Table 7: Binomial regression: changes in the number of resolutions cosponsored
predictor range EP 5 EP 6 EP 7 *
(Intercept) 0 - 1 -99% -99% -100%
Left-right distance 0 - 10 -3% -1% +1.76%
Liberty-authority distance 0 - 10 -5% -1% +.75%
Anti-pro EU distance 0 - 10 -2% -4% +1.60%
Geographical distance 0 - ~3700 KM -% -% -%
Same country no/yes +35.84% +36.86% +41.22%
Both in Eurozone no/yes +26.26% +15.93% (+1.96%)
Both from EU 6 countries no/yes -15% -15% -19%
Both from same partygroup no/yes +219.62% +119.46% +2952.50% Both from same national party no/yes -21% +45.71% +70.64% Number of committees shared 0 - ~16 +28.00% +35.70% +72.09%
* For EP 7, the data is up to June 7, 2013.
The percentages denote the increase of the dependent variable for a one-unite increase of the independent variable. A value between brackets is not significant (p < .05).
logit link, the predictor estimates are in terms of the log of the dependent variable. The dependent vari-able is alike an odds ratio: the number of times two MEPs have cosponsored to the number of times they have not.13 Interpreting the unlogged estimators is
in terms of the number of proposals cosponsored: the model automatically takes care of the variance in the total number of resolutions signed.
What can we conclude from table 8? For easy inter-pretation, I have provided table 7, in which the centages are given: the percentages express the per-cent of resolutions cosponsored when the independ-ent variable increases with one unit; for a dummy variable that equals to being from the same party-group, country, etcetera. The conclusions drawn in the previous section (on the incidence of cosponsor-ing) more or less hold. A higher ideological dis-tance significantly lowers the number of proposals sponsored together for MEPs in the fifth EP; but this effect flattens out in the sixth EP, and actually reverses in the seventh EP, in MEPs with a higher
13Another example might be of help. Consider the same
ficti-tious dyad as before: the first MEP is Mrs. Johnson (who has sponsored a total of 160 bills), the second MEP is Mr. Christian (who was on a bill together with Mrs. Johnson for 20 times). The odds ratio is thus 20 to (160-20=140), or 1 to 7. In other words, for the twenty proposals co-sponsored, the first MEP has 140 proposals written which are not sponsored by the second MEP.
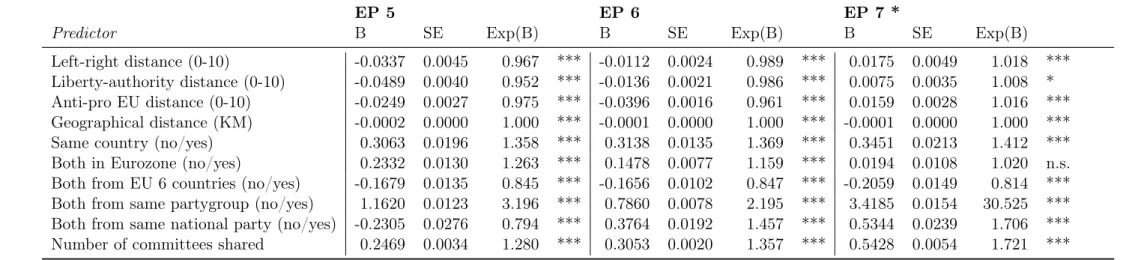
Table 8: Binomial regression: model & results
EP 5 EP 6 EP 7 *
Predictor B SE Exp(B) B SE Exp(B) B SE Exp(B)
Left-right distance (0-10) -0.0337 0.0045 0.967 *** -0.0112 0.0024 0.989 *** 0.0175 0.0049 1.018 *** Liberty-authority distance (0-10) -0.0489 0.0040 0.952 *** -0.0136 0.0021 0.986 *** 0.0075 0.0035 1.008 * Anti-pro EU distance (0-10) -0.0249 0.0027 0.975 *** -0.0396 0.0016 0.961 *** 0.0159 0.0028 1.016 *** Geographical distance (KM) -0.0002 0.0000 1.000 *** -0.0001 0.0000 1.000 *** -0.0001 0.0000 1.000 *** Same country (no/yes) 0.3063 0.0196 1.358 *** 0.3138 0.0135 1.369 *** 0.3451 0.0213 1.412 *** Both in Eurozone (no/yes) 0.2332 0.0130 1.263 *** 0.1478 0.0077 1.159 *** 0.0194 0.0108 1.020 n.s. Both from EU 6 countries (no/yes) -0.1679 0.0135 0.845 *** -0.1656 0.0102 0.847 *** -0.2059 0.0149 0.814 *** Both from same partygroup (no/yes) 1.1620 0.0123 3.196 *** 0.7860 0.0078 2.195 *** 3.4185 0.0154 30.525 *** Both from same national party (no/yes) -0.2305 0.0276 0.794 *** 0.3764 0.0192 1.457 *** 0.5344 0.0239 1.706 *** Number of committees shared 0.2469 0.0034 1.280 *** 0.3053 0.0020 1.357 *** 0.5428 0.0054 1.721 ***
Significance: *** p < 0.001; ** p < 0.01; * p < 0.05. For EP 7, the data on cosponsorship is up to June 7, 2013.
5.3 Between incidence and structural cooperation
It is important to grasp the difference between the two sets of analyses carried out. The first set consists of logistic regression analyses, predictingany cospon-soring, while the second set consists of binomial
re-gression analyses, predicting thenumber of proposals cosponsored. A very large share of MEPs never
co-sponsor, and a second share sponsors only once; at the same time, when MEPs sponsor together, they do so a lot more than once. This suggests that there might be different mechanisms at work in the decision to cosponsor. For example, a partygroup might stimulate cosponsoring between its members – these members might do so once to satisfy their partygroup leadership, but decline to do so more of-ten for various reasons (such as not being from the same member state, ideological distance, not shar-ing any committees). Such considerations validate the need for comparing two separate analyses.
In general, the differences between the incidence and the structural cooperation seem small. Some of the interesting differences can be found for the dummy variable same country. Whereas the logistic
regres-sion found quite a higher chance of cooperating, and this chance increases over the three EP terms under investigation, the effects for the structural coopera-tion are more stable. Yes, the number of proposals sponsored together is quite much higher when two MEPs are from the same country, but the increase in the importance of being from the same country increases much less. This suggests that MEPs incid-entally sponsor together with their fellow country-men more, but there are smaller changes over time as it comes to structural cooperation. The reverse holds for cooperation between two MEPs who share the same national party: they do not cooperate of-ten, but when they do, they do so together now more often than before.
6 Discussion & Conclusions
Does cooperation between members of the European Parliament follow ideological or territorial lines? As always, a simple answer to this question does not exist. This paper has identified a number of inter-esting patterns and trends. It is most certainly not purely ideology that drives the decision to work to-gether: "I agree with him thus I work with him" does not hold. "I am from the same country as she" ap-pears to be an increasing factor in determining with whom a MEP cosponsors a resolution; at the same time geographical distance becomes less important. This seems contradictory but it does not have to be: although cooperation is now more across MEPs from the same country, when MEPs do cooperate across borders, it less relevant that the MEP is from an ad-jacent country. To summarise: nationhood becomes more important, and ideology less so.
The most striking differences between when compar-ing MEPs across the last three EP terms is that committees, and even more so, partygroups, mat-ter. Coming from the same partygroup greatly in-creases the chances and the number of times MEPs cooperate. At the same time, there is no evid-ence that there is such a thing as an inner group of countries (consisting of the group of founding EU 6 countries), moreover, the cooperation between MEPs from these countries is actually lower than between other MEPs.
doubts on how solid the allegiance of MEPs toward the EU is.
Does it in itself matter that ideology becomes less important and national borders become more im-portant? There are two levels at which this question can be answered. From a scientific point of view, the (renewed?) importance of nationhood brings about difficult questions for integration theorists working from a functionalist spill-over perspective. It could be that the Eurocrisis also brings about a new period of Euro sclerosis. Such an observation would stretch, if now surpass, the findings of this paper – how-ever, this paper does point out to some important problems of true European integration. The second level at which this question can be answered – al-beit without an answer in this paper: is it good that the European Parliament appears to operate along national borders, instead of along a single European border?
The European Union now more than ever has to deal with serious challenges. The financial and economic crisis is one of them; a number of scholars observe a renewed surge of nationalism in the way that mem-ber states deal with economic hardship. Bernitz and Ringe (2010), for example, discuss and warn for the nationalistic economic policies which are designed to favour national economies, rather than the (or an) European economy. Such policies traverse through the legislative institutions of the European Union, as this paper has demonstrated. Since economic integ-ration is at the core of the European project, a return to national policies will be a threat for the entire project, as Bernitz and Ringe, among others such as Claessens (2009), observe. Schiek (2012) sees the crisis as a critical juncture for European integration. This paper provides some (admittedly: provisional) evidence for this theory. The way in which MEPs operate indeed has changed remarkably. However, Europe underwent multiple crises – and has survived by integrating even further as Kühnhardt (2011) ob-serves in his discussion on the effects of major crises on European integration (a solution also proposed by a number of other economists, such Nowotny,
Mooslechner, and Ritzberger-Grünwald, 2011). One only has to think of the Empty Chair crisis in 1965, the British rebate in 1984, the economic crisis of the late 1980s, and more recent, the crises invoked by the rejection of the European Constitution mid-2000 by popular referenda in France and The Neth-erlands. Yet, the European project is still here, so the question is how serious a threat the current eco-nomic crisis is. A path for further research on this project is to investigate how MEPs behaved before, during, and after the other crises mentioned. Is a de-crease of ideology and an inde-crease of national lines of conflict a common reaction to crises, to surge at a point and to reverse after the end of a crisis? If it is not, then the return to national lines of con-flict might signal important problems for Europe as a union. As Kühnhardt (2011) argues, the com-mon response to European crises is more integra-tion, which is a challenge for politicians considering the rise of Euroscepticism among the electorates (Ar-ató and Kaniok, 2009; Hooghe and Marks, 2007). Furthermore, if not even those who are strongly so-cialised in European institutions (cf. Haas, 1958) promote integration and behave in unison, then who would?
6.1 Further research
There are a number of points for further research. One obvious (and admittedly: somewhat cheap) sug-gestion is to increase the time span of this research by including all resolutions from the first EP term onwards. This allows for more variation over time and thus any pattern that is found that exists over all or a large share of EP terms becomes more solid. This allows for other (financial) crises, such as in the 1980s, to be included in the analysis; it could be that the patterns I have discovered are not new but happen on all influential crises in the EU.