THE PATHS OF INHERITANCE:
A CLOSER LOOK AT CULTURAL CAPITAL’S REPRODUCTION WITHIN FAMILIES
Karam Hwang
A thesis submitted to the faculty at the University of North Carolina at Chapel Hill in partial fulfillment of the requirements for the degree of Master of Arts in the Sociology Department in
the School of Arts and Sciences.
Chapel Hill 2016
iii
ABSTRACT
Karam Hwang: The Paths of Inheritance:
A Closer Look at Cultural Capital’s Reproduction within Families (Under the direction of Lisa D. Pearce)
Cultural capital’s roles in social exclusion, mobility, and reproduction have become central topics in sociological research. However, studies of the social reproduction of cultural capital have tended to examine only a few dimensions of cultural capital at once, typically among younger children, and using limited measures of class. This study incorporates four previously theorized measures of cultural capital (highbrow consumption, omnivorous consumption,
iv
ACKNOWLEDGEMENTS
I thank my advisor Lisa Pearce most of all for her repeated readings and sharing of insights. I also thank Karolyn Tyson, Andy Perrin, and Arne Kalleberg for commenting upon drafts of this paper, and I thank Jessica Pearlman, Ricardo Martinez-Schuldt, Brian Levy, and Batool Zaidi for reviewing this paper in various forms and suggesting methodological improvements. The paper further benefited from my attending the University of Maryland Population Center’s
v
TABLE OF CONTENTS
LIST OF TABLES...vii
LIST OF ABBREVIATIONS...viii
CHAPTER 1: INTRODUCTION...1
CHAPTER 2: BACKGROUND 2.1 Bourdieu’s Cultural Capital Theory...3
2.2 Past Research: Objectified Cultural Capital...4
2.3 Past Research: Embodied Cultural Capital...6
2.4 Components of Class...9
2.5 Time as a Mechanism...11
CHAPTER 3: DATA, MEASURES, AND METHODS 3.1 Data...13
3.2 Dependent Variables...14
3.3 Independent Variables...15
3.4 Analytic Method...17
CHAPTER 4: RESULTS 4.1 Study Sample Characteristics...19
4.2 Objectified – Highbrow...26
4.3 Objectified – Omnivorous...28
vi
4.5 Embodied – Social Competence...31
CHAPTER 5: DISCUSSION...32
APPENDIX 1: OMNIVOROUS ACTIVITIES...37
APPENDIX 2: OCCUPATIONAL CATEGORIES COUNTED AS SKILLED WORK...38
APPENDIX 3: PARENTAL OCCUPATION CATEGORIES...39
vii
LIST OF TABLES
Table 1 – Survey Weighted Characteristics of Adolescent Respondent
Sample (N=5,923): American Time Use Survey, 2003-2014...20 Table 2 – Adolescent Sample Participation in Activities Related to Cultural
Capital Acquisition: American Time Use Survey, 2003-2014...22 Table 3 – Weighted Logistic and Truncated Poisson Regressions of Parental
Education, Household Income, and Parental Occupation on Adolescents'
Development of Cultural Capital...24 Table 4 – Parameter Estimates of Significant Parental SES Characteristics
(all reference groups) on Development of Objectified Cultural Capital as
Highbrow Consumption...25 Table 5 – Parameter Estimates of Significant Parental SES Characteristics
(all reference groups) on Development of Objectified Cultural Capital as
Omnivorous Consumption...27 Table 6 – Parameter Estimates of Significant Parental SES Characteristics
(all reference groups) on Development of Embodied Cultural Capital as
Technical Capacity...30 Table 7 – Parameter Estimates of Significant Parental SES Characteristics
(all reference groups) on Development of Embodied Cultural Capital as Social
viii
LIST OF ABBREVIATIONS
1
CHAPTER 1: INTRODUCTION
In the decades since Bourdieu and Passeron (1964/1979, 1968/1977) introduced their theory of cultural capital, researchers around the world have used it to describe inequality processes within their societies of interest. One major line of study has examined cultural capital in terms of taste. Debates in this tradition have centered on what consumption patterns distinguish different classes, and whether or not familiarity with upper class tastes can facilitate status attainment (e.g. Alderson, Junisbai, & Heacock, 2007; DiMaggio & Mohr, 1985; Gripsrud, Hovden, & Moe, 2011). Other researchers have turned away from consumption altogether, examining cultural capital as embodied skills that serve to reproduce class over generations. These latter studies demonstrate how families of greater means are able to help their children acquire habits of social interaction that are likely to lead to educational and occupational success (e.g. Calarco, 2011; Lareau, 2015).
Despite the wealth of past research on cultural capital, numerous unresolved issues remain in the study of its reproduction within families, core to Bourdieu’s original theories of cultural capital (Jaeger & Breen, 2016).1 First, few studies compare patterns of class reproduction across the forms of cultural capital discussed above. Second, scholars have not fully interrogated which aspects of family background contribute most to the development of cultural capital: do parental education, income, and occupation each contribute equally, or are some advantages more
influential than others? Third, much research on the class reproduction of cultural capital tends to
2
focus on young children, though it is likely that youth may develop cultural capital at older ages as well.
3
CHAPTER 2: BACKGROUND
2.1 Bourdieu’s Cultural Capital Theory
In Weber’s classic formulation, class and status are distinct yet frequently overlapping bases of social hierarchies (1925/1945). While class rests upon ownership of economic resources that lead to the experience of similar “life chances,” status is founded upon social honor or prestige demonstrated through particular “styles of life.” Bourdieu’s theory of cultural capital builds upon Weber’s argument by delineating the resources that demonstrate high status groups’ prestigious “styles of life” (1986). Embodied cultural capital consists of socially valued aptitudes,
preferences, dispositions, and behaviors that individuals gain through both passive assimilation and active cultivation. Objectified cultural capital includes the goods, artistic works,
performances, and even technical equipment valued within a society, successfully mobilized for exchange when individuals can symbolically possess them through “correct” appreciation or use. The mastery of objectified and embodied forms is typically necessary to acquisition the last and most durable form, institutionalized cultural capital—credentials such as degrees and honorifics that in turn can be converted in economic and social power. Bourdieu argued that no less than land, titles, and wealth, cultural capital is a resource that is inherited within families even as it is unequally distributed across them (Bourdieu & Passeron, 1968/1977).
4
processes across societies (e.g. Pereira, 2011; Prieur & Savage, 2011; Roose, van Eijck, and Lievens, 2012). The following operationalizations of cultural capital have generated tremendous amounts of research: objectified cultural capital as 1) “highbrow” and 2) “omnivorous” forms of consumption, and embodied cultural capital in the forms of 3) “technical capacity”; and 4) “social competence.” Scores of studies have demonstrated the powerful influence of these operationalizations on stratification-related outcomes such as social mobility, educational attainment, the formation of social networks, and social exclusion.
2.2 Past Research: Objectified Cultural Capital
An early established body of research has operationalized cultural capital as the symbolic ownership of its objectified forms, with a focus on classes’ distinct patterns of consumption and leisure, and the social consequences of taste. Many scholars have followed DiMaggio and his collaborators’ early examples in relying upon existing survey data and operationalizing cultural capital as highbrow or beaux-arts participation2. These early studies found that familiarity with prestigious culture like literature, classical music, and fine arts are associated with such positive outcomes as better grades, higher educational attainment, and socially advantageous marriages (DiMaggio, 1982; DiMaggio & Mohr, 1985). Later studies have tested and confirmed the greater likelihood of highbrow consumption by the upper class in diverse industrialized societies (e.g. Katz-Gerro 2002; Kane 2003), and further examined the scholastic rewards of highbrow
consumption (Aschaffenburg & Mass, 1997; Dumais & Ward, 2010; Jaeger, 2009; Jaeger, 2011). Other researchers have challenged the emphasis on highbrow consumption, arguing that omnivorousness more accurately characterizes the tastes of the contemporary upper class. As omnivorousness signals open-mindedness and full membership in a globalized world, new elites
2
5
are likely to embrace a wide spectrum of genres, while the lower classes prefer the parochial familiar (DiMaggio & Mukhtar, 2004; Erickson, 1996; Peterson & Kern, 1996; Sullivan & Katz-Gerro, 2007). However, despite the democratic spirit that omnivorous tastes attempt to signal, they work like highbrow taste to mark class distinction. Educational and economic advantages are still necessary to access the unusual travel, culinary, and aesthetic experiences that round out the omnivore’s enjoyment of more widely available pastimes (Johnston & Baumann, 2007), and omnivorousness is delimited in predictable ways (e.g. Atkinson, 2011; Bryson, 1996;
Tampubolon, 2011).
Lizardo and Skiles (2012) suggest a reconciliation of the two operationalizations. They contend that both highbrow and omnivorous consumption mark class in contemporary societies, with omnivorous consumption merely the broader application of an aesthetic disposition that scholars mistakenly assume applies only to highbrow consumption. They argue that early exposure to highbrow culture is in fact highly predictive of later omnivorousness, forming the core around which omnivorousness accretes. Furthermore, familiarity with both highbrow culture and omnivorous consumption is highly socially advantageous. Lizardo (2006a; 2011) finds that omnivorous and highbrow tastes predict weak and strong ties, respectively, within social networks. In her observational study of elite professional firms’ hiring practices, Rivera (2012) finds that the most successful candidates are able to reference a broad (i.e. omnivorous) range of cultural signals to communicate with evaluators, as well as demonstrate deep familiarity with stereotypically upper-class pursuits.
In summary, existing studies on objectified cultural capital have studied the social
6
familiarity with objectified cultural capital acquisition, however, is more often assumed than addressed. Studies that do disclose the correlation between parents’ and children’s consumption of objectified cultural capital only look at highbrow consumption (Dumais, 2002; Roscigno & Ainsworth-Darnell, 1999). To date, there has not been any research on the effects of social origins on cultural capital acquisition that incorporate both highbrow and omnivorous forms of objectified cultural capital.
2.3 Past Research: Embodied Cultural Capital
In their review of cultural capital in educational research, Lareau and Weininger (2003) criticize what they see as sociologists’ excessive focus on objectified cultural capital. They propose that researchers instead attend to the embodied dimensions of “technical capacity” and “social competence” that Bourdieu insists also “indissolubly” constitute cultural capital
(Bourdieu 1996). These embodied dimensions signify individual intellect and character in schools and workplaces, but are, like objectified cultural capital, the products of class-specific socialization rather than the expressions of innate worth.
high-7
pressure, publicly scrutinized nature of organized sports helps prepare participants for
performance-based assessments, while extracurricular and volunteer commitments train them on how to interact and collaborate with others toward productive goals. Middle class children’s activities thus create life patterns that mimic their parents’ and accustom them to their future professional responsibilities.
Subsequent studies have examined, with varying points of emphasis, these dimensions of embodied cultural capital and their connections to family background and future attainment. For the most part, research on technical capacity has confirmed Lareau’s arguments for the strong associations between family socioeconomic background, children’s linguistic and academic orientations, and academic success. For instance, Bodovski and Farkas (2008) and Calarco (2014) find that higher SES parents’ attention to books and language at home benefits elementary school students’ test scores and grades. In addition, Roberts and Foehr’s (2004) national media survey of youth indicates that children aged 8-18 whose parents have at least a college degree report more average weekly minutes reading print media than other children. However, these findings may be more robust for samples featuring younger children. Using a different nationally representative dataset and restricting her sample to older adolescents, Dumais (2008) finds no significant relationships between family SES and weekly mean time reading among high school students. Khan’s ( 2012) ethnography of high-school students at an elite boarding school also includes observations that these students do not work nearly as hard on their academic assignments as they claim, with even some of the “best” students using shortcuts like reading abridged online summaries rather than the complete assigned texts.
8
Phillips, 2001; Covay & Carbonaro 2010). However, in their interview-based study of middle school students, Bennett, Lutz, & Jayaram, (2012) confirm Lareau’s finding that working class parents enroll their children in fewer organized activities than do middle class parents. Looking at a nationally representative sample of high school sophomores, Dumais (2008) also finds that SES is positively associated with participation in school sponsored extracurricular activities.
More so than with objectified cultural capital, previous researchers have clearly explored the associations between family background and embodied cultural capital in the form of social competence and technical capacity. But while research on the impact of parental characteristics on children of younger ages is extensive and fairly unanimous, the extent to which this holds with for older adolescents remains a more open question. With the exceptions of Khan’s (2012) and Dumais’ (2008) studies, research on embodied cultural capital for high school aged
adolescents is relatively scarce. Yet, the relationship between family background and older adolescents’ cultural capital acquisition warrants greater scrutiny, as the strong influence of parental characteristics that are evident among younger children may wane in the face of older adolescents’ increased agency and receptivity to peer influence (Biddle, Bank, & Marlin, 1980; Tepper & Hargittai, 2009). At the same time, adolescent experiences may have especially strong effects on later socioeconomic status (Hagan 1991; Harris 2010). Though Bourdieu places greater emphasis on the importance of early childhood socialization for cultural capital
9
2.4 Components of Class
Whether defined as familiarity with objectified forms or development of its embodied forms, research on cultural capital has inconsistently examined which aspects of family background contribute to cultural capital acquisition. This is evident even in Bourdieu’s empirical research on class origins and cultural capital. In the survey analyses included within Inheritors, for instance, Bourdieu looks at the effect of father’s occupation on college students’ cultural knowledge. In both Reproduction in Education, Society, and Culture and Distinction, he describes respondents’ social origins in terms of whether their fathers were upper, middle, or lower class. Most subsequent studies of cultural capital have relied upon similar composite groupings to describe family background. Ethnographic researchers often group families as belonging to two or three class categories, such as working class/poor, and middle (Bennett et al 2012; Calarco 2011; Chin & Phillips, 2004; Lareau, 2003). Quantitative studies also tend to rely on SES composites (Dumais 2002, 2008), parental educational attainment alone (Aschaffenburg & Maas, 1997), or occasionally income and education together (Jaeger 2011).
Yet, Duncan and Magnuson (2003/2012) reasonably point out that different components of socioeconomic status are associated with unique benefits for children’s development. In the case of cultural capital acquisition, past research suggests that parental education, income, and
10
Parental occupation also distinctly affects children’s lives not only because of its close association with education, but because job characteristics affect adult tastes and social habits, which in turn may affect their children’s lifestyles. Erickson (2006) for instance, argues that because managers often must network with workers at all levels of the social hierarchy, they possess greater cultural knowledge. Lizardo (2006a) also connects more culturally prestigious occupations to the adult development of highbrow tastes. Petev (2013) shows that holders of higher status occupations demonstrate greater sociability in terms of membership within diverse social organizations. Parents’ occupations may therefore contribute to children’s cultural capital acquisition through highbrow and omnivorous consumption, as well as social competence.
Financial resources may bear a more complicated relationship to different types of cultural capital acquisition. On the one hand, Bourdieu (1986) argues that social ease and the aesthetic disposition are far more likely among those who enjoy economic freedom from the exigencies of basic survival. Many forms of cultural capital require money: tickets, fees, and incidental
expenses like transportation costs. However, economic and cultural capital do not correspond perfectly; as Weber early argued, economic capital can form a rival system of value to cultural capital. Adults whose jobs involve more economic capital than cultural capital rewards
demonstrate weaker interest in objectified cultural capital compared to those whose jobs involve higher cultural capital and lower economic capital (Bourdieu 1984; Lizardo 2006b). Financial resources may not independently and directly lead to more cultural capital without the
knowledge or disposition to spend those resources in particular avenues.
11
organized activities. Other studies have yet to verify that this is the case with other outcomes relevant to cultural capital acquisition, or for other age groups.
2.5 Time as a Mechanism
Bourdieu identifies time-use as a key mechanism through which family class advantage is transformed into children’s cultural capital. It is through investments of certain kinds of time that knowledge, preferences, and skills are ingrained within the individual. In this spirit, Lizardo and Skiles (2012) call for a focus on habitual practice as the means through which
class-differentiated cultural orientations develop.
Despite the centrality of time-use in theories of cultural capital, researchers have seldom used time diaries to approach questions of cultural capital and social reproduction, instead relying on basic participation rates or frequency estimates (Dumais 2008; Sullivan and Katz-Gerro 2007). Sociological studies have most often examined time diary data to explore questions related to household divisions of labor (e.g.; Burgard & Ailshire, 2013; Gager, Cooney, & Call, 1999). While many of these studies examine how these domestic arrangements affect parents’ time with their children (Wight, Raley, & Bianchi, 2008), they rarely discuss the implications of this shared time in terms of cultural capital. These effects must be extrapolated from conclusions that most often concern the favorable associations between parental involvement and children’s emotional health and risk behavior (e.g. Kalil, Ryan, & Corey 2012; Kendig & Bianchi, 2008). This focus on psychological adjustment and risk behavior is also present in studies on adolescents’ time use (e.g. Desha, Nicholson, & Ziviani, 2011).
12
activities might be. For instance, a time-diary questionnaire might ask “What did you do at 10 am yesterday?” rather than “How much time did you spend doing schoolwork last week?” As a result, time-diaries can effectively reduce response bias for socially desirable behaviors
(Hofferth, 2006; Presser & Stinson, 1998). Respondents are not alerted as to what kind of information is most salient to researchers, and are less tempted to affirm their affiliation with what they suspect are the positively viewed identities under study. Time diary data may therefore be ideal for studying whether class differences in cultural capital development are evident in time use patterns.
13
CHAPTER 3: DATA, MEASURES, AND METHODS
3.1 Data
The data source for this study is the 2003-2014 years of the nationally representative
American Time Use Survey (ATUS), sponsored by the Bureau of Labor Statistics and conducted by the U.S. Census Bureau. ATUS participants are selected from a subset of households who had completed their eighth and final interviews for the Current Population Survey (CPS). Once selected, ATUS respondents are interviewed 3-4 months after their last CPS interview about their activities during the previous 24 hour period. They report on what activities they participated in, for how long, who they were with, and where they were. Limited demographic information for the household is collected during the ATUS interview, but additional data is also available in the linked, slightly older CPS interviews.
As with the CPS, the ATUS sample universe consists of non-institutionalized, non-active military individuals over age 15 from across all 50 states. Computer-assisted telephone interviews are scheduled randomly over each week of the month, and split evenly between weekdays and weekends. The sample size was 40,500 households for the first survey in 2003; all subsequent surveys have a sample size of 26,400. ATUS response rates have remained around 50% since 2003, when they were at their highest at 57.8%. The 2014 response rate was 51.0%. These response rates may be between 1 to 3 percentage points lower after accounting for poor quality surveys that ATUS categorizes as “non-response” cases during post-survey data
14
than five activities, or surveys in which respondents refused or failed to specify their activities for three or more hours of their reported diary day.
Out of the almost 160,000 respondents in the pooled 2003-2014 ATUS surveys, I use time diary data for unmarried, childless respondents between the ages of 15-18 at the time of the survey, who reside with one or both parents, who are likely still enrolled in high school on a full-time basis3, and for whom there is information on parental education, parental occupation, and household income. These parameters produced a sample of 5,923 adolescent respondents.
3.2 Dependent Variables
In all dependent variables, I measure both the odds of participating in eligible activities and extent of participation. I adopt this two part strategy, rather than simply looking at total average time spent in activities, for two reasons. First, the odds of participating at all and time spent participating capture two different aspects of stratified acquisition, with total time a theorized mechanism for cultural capital development that has not been previously tested. Second, several of the dependent variables have high zero counts, which would bias time estimates downward if they were included. I rely on the summary measures for each of the four forms of cultural category rather than examine each constituent activity in turn due to prohibitively low rates of participation for many of the individual constituent activities (see Table 2).
Objectified - Highbrow: Guided by DiMaggio and Useem (1978) and DiMaggio (1982), I measure the highbrow objectified form of cultural capital as respondents’ participation in extracurricular music and performance, performing outside of school, attending performances,
3
15
and going to museums. I measure this as log odds of participating in any highbrow activities for all respondents, and as the time participants spend in highbrow activities.
Objectified – Omnivorous: Appendix Item 1 lists leisure activities I include in this measure. They range from activities as common as watching television and as stereotypically upper-class as equestrian sports. They exclude activities like cooking or shopping which might be undertaken for either recreation or necessity, because the data will not permit me to distinguish these cases from others.
I looked at this outcome in a few different ways: the log odds of engaging in any leisure in a diary day, the total number of different activities reported by respondents reporting any leisure time, and the average amount of time per activity that was spent by these respondents.
Embodied – Technical Capacity: Lareau and Weininger (2003) suggest that researchers include within their definitions of cultural capital the skills and aptitudes that are overtly rewarded in schools and work. I therefore include within this outcome reading for personal interest, doing research or homework for a degree, doing research or homework for fun, and writing for personal interest. I measure this as the log odds of participating in any of these activities, and as the time that participants spent in eligible activities.
Embodied – Social Competence: Following Lareau (2003), I measure this outcome as participation in extracurricular school activities, sports, volunteering, and working in skilled occupational positions (listed in Appendix Item 2). Again, I measure this as log odds of participating for all respondents, and as the time participants spent in activities.
3.3 Independent Variables
16
attainment: 1) High school graduate or less; 2) Some college but no degree; 3) Associates degree 4) College graduate; 5) Master’s Degree, and 6) Professional Degree/Ph.D. Professional Degrees (e.g. M.D., D.D.S., J.D., D.V.M .).
Parental occupational category – With some updates, I largely followed Jonsson et al.’s (2009) meso-level occupational groupings to code ATUS’ detailed parental occupational information into seven categories: 1) Services 2) Lower Manual/Crafts; 3) Sales/Clerical; 4) Other
Professions; 5) Managers/Officials; 6) Classical Professions; and 7) Out of the Labor Force. The occupations grouped within each category are listed in Appendix Item 3. While Jonnson et al. argue that microclass occupational schema better predict social mobility/reproduction than big class schema, microclass groupings resulted in such small cell sizes that analysis was impossible. Meso-level groupings contain slightly more detail than the big class categories, so serve as a compromise.
I use the father’s occupational category except when 1) the father is absent; 2) the father reports no occupation; 3) the mother’s occupation is in the Classic Professions and the father’s is not. In these cases, I use the mother’s occupation.
Household Income – I recode available family annual income data into four roughly evenly distributed categories: 1) less than $30,000; 2) $30,000 - $59,999; 3) $60,000 - $99,999; 4) $100,000 and more.
Control Variables
17
Other – I include controls for total siblings under age 18 in the household, respondent
race/ethnicity, respondent gender, survey year, and whether or not the survey data reported on a school day or a weekend/holiday. I designated as a school day any day in which respondents reported taking a class for degree credit.
3.4 Analytic Method
I first conducted multivariate logistic regression to test the independent and combined
associations of parental education, income, and occupation on respondents’ log-odds of engaging in any activity to develop objectified-highbrow, objectified-omnivorous, embodied-technical, and embodied-social measures of cultural capital.
To examine the time that participants spent in activities, I conducted truncated Poisson regressions, again examining parental education, income and occupation independently and jointly. Truncated Poisson regression is appropriate for count data that do not display
overdispersion (evident in Table 2) and in which values are not permitted be zero (Cameron & Trivedi, 2013; Long & Freese, 2006). While time is theoretically the epitome of a continuous variable, ATUS does not treat time as such. Instead, time is measured as counts of discrete minutes within a twenty-four hour period.
18
19
CHAPTER 4: RESULTS
4.1 Study Sample Characteristics
20
Table 1. Survey Weighted Characteristics of Adolescent Respondent Sample (N=5,923): American Time Use Survey, 2003-2014
Characteristic Value
Gender, %
Female 48.3
Male 51.7
Race, %
White 59.7
Black 12.8
Hispanic 20.8
Asian 3.6
Other/Multiracial 3.0
Age, mean (SD) 16.3 (.02)
Reported on a Schoolday, % 47.8
Parents' Marital Status, %
2 (bio or adoptive) parents 65.3
Blended family 9.4
Single parent household 19.2
Other 6.1
Household size 4.4(0.2)
Total Siblings less than 18 yo 1.0 (.02) Highest Parental Education, %
High School Graduate or less 30.4
Some college 15.8
Associates Degree 12.7
College Graduate 23.6
Master's Degree 12.0
Professional/PhD 5.5
Household Income, %
< $30,000 21.1
$30 - $59,999 27.7
$60 - $99,999 27.6
$100,000+ 23.6
Highest Parental Occupation, %
Service 6.2
Lower manual/Crafts 19.4
Sales/Clerical 20.2
Other Professions 24.3
Managers/Officials 13.5
Classical Professions 11.0
Not in the Labor Force 5.3
21
The highest parental educational attainment is High School or less for roughly a third of respondents, Some College for 16% of respondents, Associate’s Degree for 13% of respondents, and a Bachelor’s Degree for almost 24% of respondents. 12% of respondents have parents who earned a Master’s Degree, and almost 6% have at least one parent with a Professional degree or a Ph.D. The highest status parental occupations for 11-14% of respondents are the Classical
Professions or Managers/Officials, while Other Occupations are the most common highest parental occupation, capturing a quarter of the sample. Sales/Clerical positions are the highest parental occupation for another fifth of the sample. Lower Manual/Crafts positions and Service jobs are the highest parental occupations for the remaining 19% and 6% of the sample,
22
Table 2. Adolescent Sample Participation in Activities Related to Cultural Capital Acquisition: American Time Use Survey, 2003-2014*
%
Participating
Participants' Minutes/Day Objectified Cultural Capital -
"Highbrow" Mean SE Max
Summary measure 4.0 143.9 7.9 630
Extracurricular Music &
Performance 2.1 129.5 10.6 530
Performing 1.0 117.3 9.2 300
Visiting museums 0.2 137.8 14.9 480
Watching performance 0.9 183.4 19.0 630
% Participating
Participants' Activities/Day Objectified Cultural Capital -
"Omnivorous" Mean SE Max
Any leisure activity 93.7 -- -- --
Total leisure activities -- 2.1 0.0 8
Total time in leisure -- 258.8 2.9 1138
Average time per leisure
activity -- 146.5 1.9 1050
% Participating
Participants' Minutes/Day Embodied Cultural Capital -
Technical Capacity Mean SE Max
Summary Measure 43.7 117.4 2.3 875
Reading for personal interest 10.4 74.1 3.7 690
Research/hw for a degree 38.1 13.4 2.4 875
Research/hw for personal
interest 0.2 81.4 23.6 240
Writing for personal interest 0.4 71.9 16.6 480
% Participating
Participants' Minutes/Day Embodied Cultural Capital - Social
Competence Mean SE Max
Summary Measure 31.8 135.9 2.9 805
Extracurricular School
Activities 6.9 90.7 13.8 540
Organized sports 20.9 141.6 3.0 601
Volunteering 10.5 102.7 4.9 728
Work - skilled 2.2 107.6 18.0 805
23
Table 2 shows the sample’s overall rates of participation in each cultural capital outcome, and participants’ mean time in each category. Only a very small percentage (4%) of the sample reports participating in any activity to develop objectified-highbrow cultural capital during their diary days, with most of these reports based on extracurricular music and performance. However, the vast majority of respondents (almost 94%) participated in at least one leisure activity in the objectified-omnivorous category; unsurprising considering the broad range of eligible activities. These respondents engaged in an average of two leisure activities during their diary day, and spent an average of over four hours total on leisure. The average time they spent per activity was roughly two and a half hours. Over 40% of respondents participated in an activity to develop embodied cultural capital as technical capacity (most often homework), and almost a third participated in an activity to develop embodied cultural capital as social competence (most often sports).
24
Table 3: Weighted Logistic and Truncated Poisson Regressions of Parental Education, Household Income, and Parental Occupation on Adolescents' Development of Cultural Capital
OBJECTIFIED CULTURAL CAPITAL EMBODIED CULTURAL CAPITAL
Highbrow Consumption Omnivorous Consumption Technical Capacity Social Competence
Log odds of participation Participants' Log Minutes Participants' Total activities Participants' Log Minutes
Log odds of participation
Participants' Log Minutes
Log odds of participation
Participants' Log Minutes
b (se) b (se) b (se) b (se) b (se) b (se) b (se) b (se)
Parental Ed.
HS Diploma or
less ref ref ref ref ref ref ref ref
Some college 0.675* (0.32) 0.018 (0.18) 0.111** (0.04) -0.062 (0.04) -0.086 (0.12) 0.078 (0.07) 0.108 (0.11) -0.061 (0.06) Associate Degree 0.467 (0.35) 0.158 (0.19) 0.152*** (0.05) -0.104* (0.04) -0.118 (0.13) 0.028 (0.07) 0.088 (0.13) -0.146 (0.08) College Graduate 0.523 (0.33) 0.065 (0.18) 0.161*** (0.04) -0.109** (0.04) 0.340** (0.12) 0.243*** (0.07) 0.073 (0.11) -0.100 (0.07) Master's Degree 0.729* (0.37) 0.101 (0.20) 0.209*** (0.05) -0.165*** (0.04) 0.692*** (0.15) 0.233** (0.08) 0.090 (0.15) -0.082 (0.08) Professional/PhD 0.716 (0.44) -0.224 (0.21) 0.250*** (0.06) -0.032 (0.06) 0.656*** (0.20) 0.486*** (0.09) 0.165 (0.19) 0.041 (0.10)
Household Inc.
<$30,000 ref ref ref ref ref ref ref ref
$30-$59,999 0.029 (0.31) 0.325 (0.19) 0.031 (0.04) -0.016 (0.04) -0.021 (0.11) 0.114 (0.06) 0.122 (0.11) 0.011 (0.06) $60-$99,999 0.211 (0.33) 0.081 (0.20) 0.030 (0.04) -0.037 (0.04) -0.012 (0.12) 0.089 (0.07) 0.224 (0.12) 0.013 (0.07) 100,000+ -0.124 (0.36) 0.408 (0.22) 0.055 (0.05) -0.077 (0.05) 0.038 (0.14) 0.145 (0.08) 0.246 (0.14) -0.024 (0.08)
Parental Occ.
Service ref ref ref ref ref ref ref ref
Manual/crafts 0.668 (0.53) -0.192 (0.28) -0.048 (0.06) -0.086 (0.08) 0.096 (0.18) -0.037 (0.12) 0.129 (0.18) -0.077 (0.10) Sales/Clerical 0.645 (0.50) -0.322 (0.28) -0.006 (0.06) -0.111 (0.07) 0.214 (0.18) -0.052 (0.11) 0.112 (0.18) 0.036 (0.10) Other Professions 1.275* (0.51) -0.242 (0.27) -0.043 (0.07) -0.108 (0.07) 0.303 (0.18) -0.039 (0.11) 0.061 (0.18) 0.060 (0.10) Managers/Officials 1.285* (0.52) -0.167 (0.30) 0.018 (0.07) -0.086 (0.07) 0.102 (0.19) 0.030 (0.12) 0.171 (0.19) -0.020 (0.11) Class. Professions 1.785** (0.55) -0.148 (0.30) 0.035 (0.07) -0.139 (0.08) 0.373 (0.21) -0.015 (0.12) -0.208 (0.21) 0.044 (0.11) Not in Labor Force 0.492 (0.70) -0.592 (0.45) 0.006 (0.08) -0.087 (0.08) -0.036 (0.22) -0.052 (0.13) 0.255 (0.22) 0.010 (0.12)
Constant -7.338*** (1.83) 4.804*** (0.84) 1.914*** (0.23) 5.537*** (0.24) 0.872 (0.67) 4.588*** (0.37) 0.090 (0.65) 4.732*** (0.34)
N 5923 228 5583 5583 5923 2433 5923 1833
* p<0.05, ** p<0.01, *** p<0.001
25
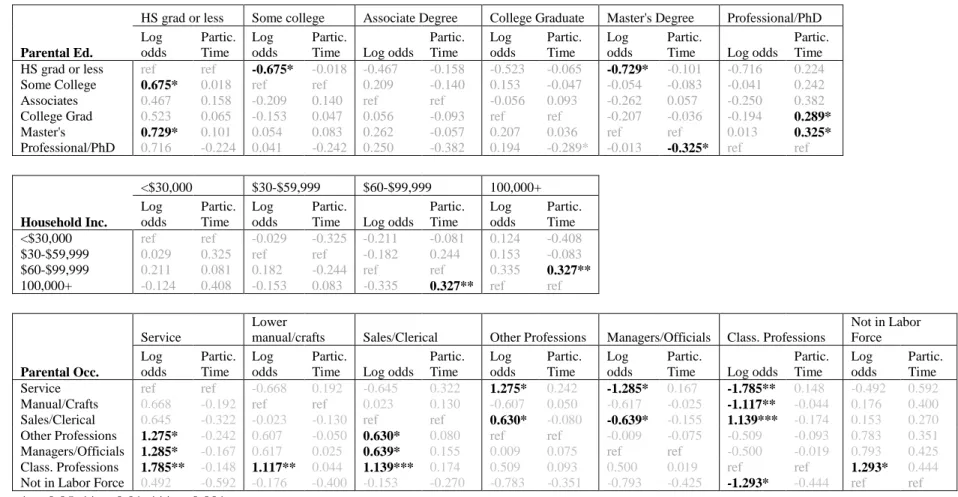
Table 4: Parameter Estimates of Significant Parental SES Characteristics ( all reference groups) on Development of Objectified Cultural Capital as Highbrow Consumption
Estimates obtained from weighted multivariate logistic (N=5923) and truncated Poisson (N=227) regressions, including all other SES variables and controls
HS grad or less Some college Associate Degree College Graduate Master's Degree Professional/PhD
Parental Ed. Log odds Partic. Time Log odds Partic.
Time Log odds
Partic. Time Log odds Partic. Time Log odds Partic.
Time Log odds
Partic. Time HS grad or less ref ref -0.675* -0.018 -0.467 -0.158 -0.523 -0.065 -0.729* -0.101 -0.716 0.224 Some College 0.675* 0.018 ref ref 0.209 -0.140 0.153 -0.047 -0.054 -0.083 -0.041 0.242
Associates 0.467 0.158 -0.209 0.140 ref ref -0.056 0.093 -0.262 0.057 -0.250 0.382
College Grad 0.523 0.065 -0.153 0.047 0.056 -0.093 ref ref -0.207 -0.036 -0.194 0.289*
Master's 0.729* 0.101 0.054 0.083 0.262 -0.057 0.207 0.036 ref ref 0.013 0.325*
Professional/PhD 0.716 -0.224 0.041 -0.242 0.250 -0.382 0.194 -0.289* -0.013 -0.325* ref ref
<$30,000 $30-$59,999 $60-$99,999 100,000+
Household Inc. Log odds Partic. Time Log odds Partic.
Time Log odds
Partic. Time Log odds Partic. Time <$30,000 ref ref -0.029 -0.325 -0.211 -0.081 0.124 -0.408
$30-$59,999 0.029 0.325 ref ref -0.182 0.244 0.153 -0.083
$60-$99,999 0.211 0.081 0.182 -0.244 ref ref 0.335 0.327** 100,000+ -0.124 0.408 -0.153 0.083 -0.335 0.327** ref ref
Service
Lower
manual/crafts Sales/Clerical Other Professions Managers/Officials Class. Professions
Not in Labor Force Parental Occ. Log odds Partic. Time Log odds Partic.
Time Log odds
Partic. Time Log odds Partic. Time Log odds Partic.
Time Log odds
Partic. Time Log odds Partic. Time Service ref ref -0.668 0.192 -0.645 0.322 1.275* 0.242 -1.285* 0.167 -1.785** 0.148 -0.492 0.592
Manual/Crafts 0.668 -0.192 ref ref 0.023 0.130 -0.607 0.050 -0.617 -0.025 -1.117** -0.044 0.176 0.400
Sales/Clerical 0.645 -0.322 -0.023 -0.130 ref ref 0.630* -0.080 -0.639* -0.155 1.139*** -0.174 0.153 0.270
Other Professions 1.275* -0.242 0.607 -0.050 0.630* 0.080 ref ref -0.009 -0.075 -0.509 -0.093 0.783 0.351
Managers/Officials 1.285* -0.167 0.617 0.025 0.639* 0.155 0.009 0.075 ref ref -0.500 -0.019 0.793 0.425
Class. Professions 1.785** -0.148 1.117** 0.044 1.139*** 0.174 0.509 0.093 0.500 0.019 ref ref 1.293* 0.444
26
4.2 Objectified - Highbrow
Parental education and occupation maintain some positive and independent associations with adolescents’ log odds of participating in highbrow activities, while income’s effects largely become non-significant (Tables 3-4). However, education’s associations are inconsistent. Only the Some College and Master’s Degree categories show positive associations (.675 - .729), and these are present only when compared to the lowest education category. Occupation’s
associations are somewhat more consistent. The three highest status occupation categories are associated with between 1.28 and 1.79 greater log odds of participation compared to the Services category and between .630 - 1.139 greater log odds compared to the Sales/Clerical category. The Classical Professions maintain significantly greater odds of participation compared to Lower Manual/Crafts as well.
When looking at participants’ time in highbrow activities, parental occupation no longer shows any significant associations. The Professional/PhD education category is actually
significant associated with less time (around 25% fewer minutes) compared to college graduates and Master’s degree categories. Belonging to the highest income group shows a positive
27
27
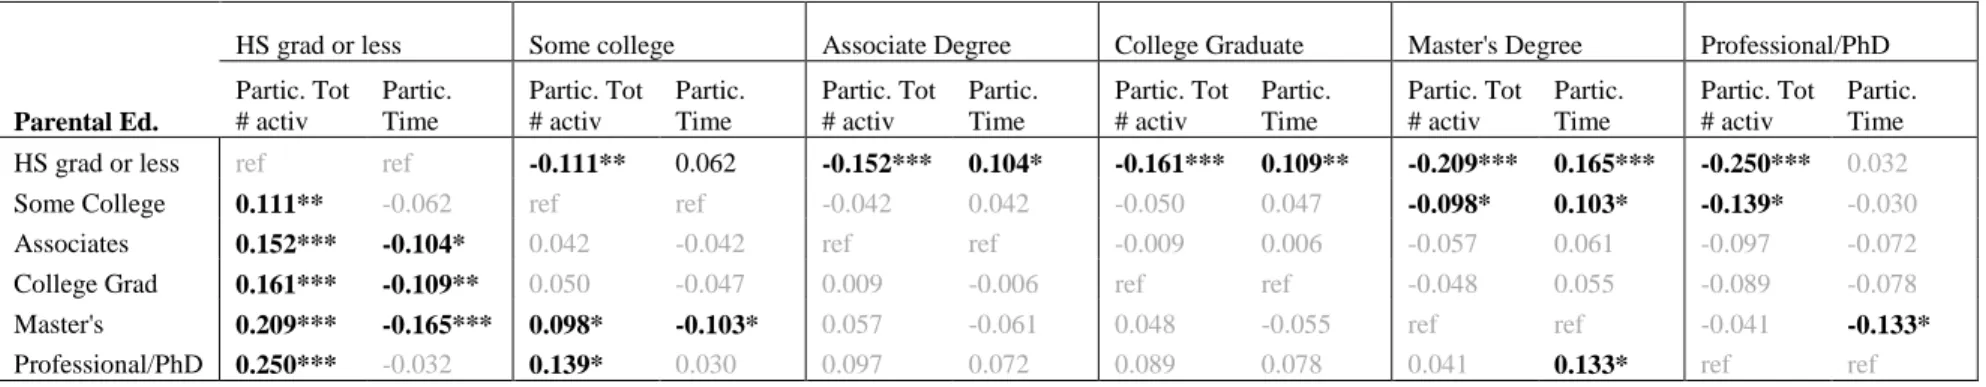
Table 5: Parameter Estimates of Significant Parental SES Characteristics ( all reference groups) on Development of Objectified Cultural Capital as Omnivorous Consumption
Estimates obtained from weighted multivariate logistic (N=5583) and truncated Poisson (N=5583) regressions, including all other SES variables and controls
HS grad or less Some college Associate Degree College Graduate Master's Degree Professional/PhD
Parental Ed.
Partic. Tot # activ
Partic. Time
Partic. Tot # activ
Partic. Time
Partic. Tot # activ
Partic. Time
Partic. Tot # activ
Partic. Time
Partic. Tot # activ
Partic. Time
Partic. Tot # activ
Partic. Time
HS grad or less ref ref -0.111** 0.062 -0.152*** 0.104* -0.161*** 0.109** -0.209*** 0.165*** -0.250*** 0.032
Some College 0.111** -0.062 ref ref -0.042 0.042 -0.050 0.047 -0.098* 0.103* -0.139* -0.030
Associates 0.152*** -0.104* 0.042 -0.042 ref ref -0.009 0.006 -0.057 0.061 -0.097 -0.072
College Grad 0.161*** -0.109** 0.050 -0.047 0.009 -0.006 ref ref -0.048 0.055 -0.089 -0.078
Master's 0.209*** -0.165*** 0.098* -0.103* 0.057 -0.061 0.048 -0.055 ref ref -0.041 -0.133*
Professional/PhD 0.250*** -0.032 0.139* 0.030 0.097 0.072 0.089 0.078 0.041 0.133* ref ref
28
4.3 Objectified - Omnivorous
Respondents did not significantly differ by any parental class characteristic in their odds of engaging in at least one leisure activity. Among respondents who reported any leisure during their diary day, parental education maintains a significant and positive association with their total number of leisure activities, while income and occupation become non-significant regardless of reference category. Table 5 shows that participants in all parental education categories engage in more leisure activities per day compared to the High School category—between .11 and .25 more log activities. The Master’s and Ph.D. categories are significantly associated (p<.05) with more activities compared to the Some College education category as well.
Respondents in many of the higher parental education categories appear to have participated in more leisure activities per day by spending less time per activity. Compared to the High School category, the Associates, College Graduate, and Master’s categories were associated with .104, .109, and .165 fewer log minutes, respectively (or 8.9%, 10.4%, and 15.2% fewer minutes). Interestingly, although the PhD/Professional category was associated with more total activities per day, its average time per activity did not significantly differ, except in the negative direction compared to the Master’s category.
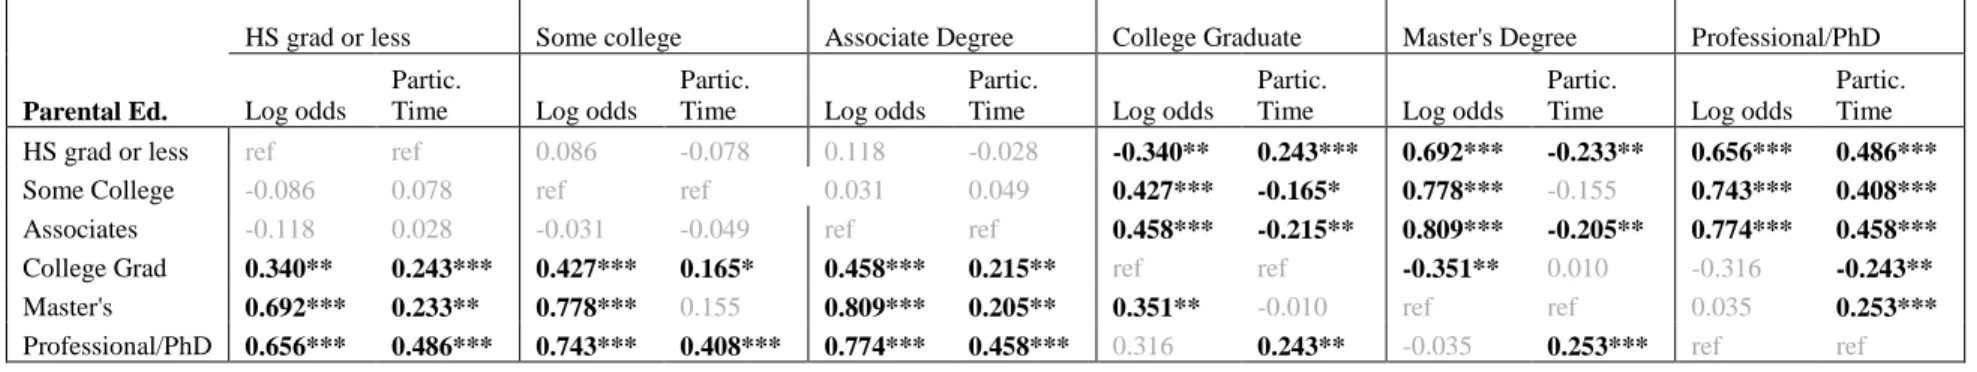
4.4 Embodied – Technical Capacity
29
When looking at the time participants spent developing technical capacity, the three higher education categories are again associated with greater time compared to the three lower
education categories. However, here the Master’s and College grad categories are not
significantly different from one another, while the Professional/PhD category is associated with significantly more time than all other groups. Compared to the High School Grad or less
30
Table 6: Parameter Estimates of Significant Parental SES Characteristics ( all reference groups) on Development of Embodied Cultural Capital as Technical Capacity
Estimates obtained from weighted multivariate logistic (N=5923) and truncated Poisson (N=2433) regressions, including all other SES variables and controls
HS grad or less Some college Associate Degree College Graduate Master's Degree Professional/PhD
Parental Ed. Log odds
Partic.
Time Log odds
Partic.
Time Log odds
Partic.
Time Log odds
Partic.
Time Log odds
Partic.
Time Log odds
Partic. Time HS grad or less ref ref 0.086 -0.078 0.118 -0.028 -0.340** 0.243*** 0.692*** -0.233** 0.656*** 0.486***
Some College -0.086 0.078 ref ref 0.031 0.049 0.427*** -0.165* 0.778*** -0.155 0.743*** 0.408***
Associates -0.118 0.028 -0.031 -0.049 ref ref 0.458*** -0.215** 0.809*** -0.205** 0.774*** 0.458***
College Grad 0.340** 0.243*** 0.427*** 0.165* 0.458*** 0.215** ref ref -0.351** 0.010 -0.316 -0.243**
Master's 0.692*** 0.233** 0.778*** 0.155 0.809*** 0.205** 0.351** -0.010 ref ref 0.035 0.253***
Professional/PhD 0.656*** 0.486*** 0.743*** 0.408*** 0.774*** 0.458*** 0.316 0.243** -0.035 0.253*** ref ref
31
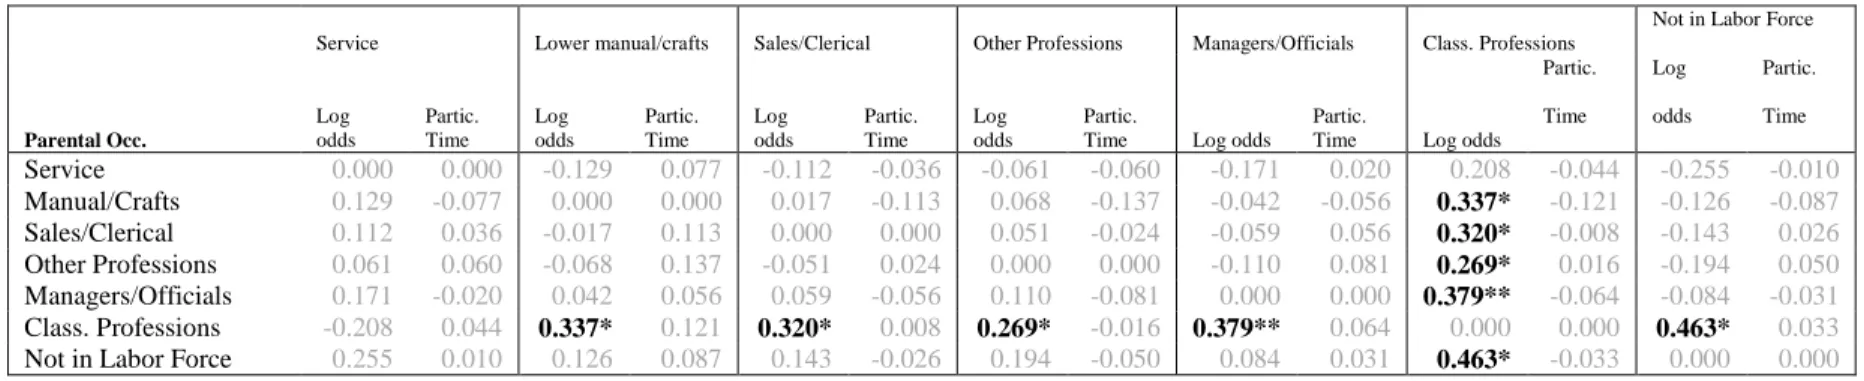
4.5 Embodied – Social Competence
Analyses of social competence show almost no class differences in odds of engaging in activities to develop social competence (Table 7). The only significant association4 goes in the opposite direction: having parent in the Classic Professions is associated with significantly lower odds (-.262 - .463) of engaging in activities to develop social competence compared to all
reference groups save the lowest category, “Services.”
There were no significant differences across between SES categories for participants’ time developing social competence.
32
Table 7: Parameter Estimates of Significant Parental SES Characteristics ( all reference groups) on Development of Embodied Cultural Capital as Social Competence
Estimates obtained from weighted multivariate logistic (N=5923) and truncated Poisson (N=1833) regressions, including all other SES variables and controls
Service Lower manual/crafts Sales/Clerical Other Professions Managers/Officials Class. Professions
Not in Labor Force
Parental Occ.
Log odds
Partic. Time
Log odds
Partic. Time
Log odds
Partic. Time
Log odds
Partic.
Time Log odds Partic.
Time Log odds Partic. Time
Log odds
Partic. Time
Service 0.000 0.000 -0.129 0.077 -0.112 -0.036 -0.061 -0.060 -0.171 0.020 0.208 -0.044 -0.255 -0.010
Manual/Crafts 0.129 -0.077 0.000 0.000 0.017 -0.113 0.068 -0.137 -0.042 -0.056 0.337* -0.121 -0.126 -0.087
Sales/Clerical 0.112 0.036 -0.017 0.113 0.000 0.000 0.051 -0.024 -0.059 0.056 0.320* -0.008 -0.143 0.026
Other Professions 0.061 0.060 -0.068 0.137 -0.051 0.024 0.000 0.000 -0.110 0.081 0.269* 0.016 -0.194 0.050
Managers/Officials 0.171 -0.020 0.042 0.056 0.059 -0.056 0.110 -0.081 0.000 0.000 0.379** -0.064 -0.084 -0.031
Class. Professions -0.208 0.044 0.337* 0.121 0.320* 0.008 0.269* -0.016 0.379** 0.064 0.000 0.000 0.463* 0.033
Not in Labor Force 0.255 0.010 0.126 0.087 0.143 -0.026 0.194 -0.050 0.084 0.031 0.463* -0.033 0.000 0.000
33
CHAPTER 5: DISCUSSION
Scores of empirical studies on cultural capital have been published since the concept’s emergence in the 1960s. Researchers focusing on cultural capital’s objectified forms have debated whether highbrow or omnivorous consumption characterizes upper class tastes, and investigated whether objectified cultural capital can be converted successfully into social
advantage. Studies of cultural capital as embodied technical capacity and social competence have detailed how children’s domestic resources affect their success at school and work.
This study is inspired by these previous definitions of cultural capital, while addressing gaps in the research regarding their place in social reproduction. First, I examine whether parental class positively associated with youths’ omnivorous and highbrow consumption patterns, because few studies on objectified cultural capital have examined the degree to which parental characteristics predict children’s acquisition of either form. Second, I look at whether parental class continues to be associated with the development of embodied cultural capital among older adolescents, as previous researchers have primarily focused on early childhood, and population-level studies are scarce. Third, I analyze the independent associations of parental education, occupation, and income because almost no studies have attempted to disentangle the
34
to Bourdieu’s original theories and the advantages of the time diary format for reducing social desirability bias in in survey responses.
Regarding the first study question, I find some support that parental class is associated with greater odds of participating in activities to develop objectified cultural capital in both its highbrow and omnivorous forms. For the second study question, I find even larger and more consistently positive associations between parental class and embodied cultural capital in the form of technical capacity, confirming that what was previously observed among younger children holds for older adolescents as well. However, previous studies’ observations regarding social competence development were not evident for this older age group. There seem to be no significant class associations for adolescents’ odds of playing organized sports, participating in clubs, volunteering, or working in skilled positions. Time spent developing social competence also does not significantly vary by participant class, except that those whose parents are in the Classical Professions may actually spend less time in activities. This contradicts previous studies’ findings that greater participation in organized activities is a distinguishing feature of upper class childhood. At least in terms of raw participation rates and time expended, high school students of different class backgrounds are not distinguishable in their formal
extracurricular involvements. This may be attributable to the greater availability of organized activities through high schools than through elementary schools, which would enable adolescent engagement with less parental initiation or facilitation. Future qualitative work may look at whether high school students’ experiences of organized activities nonetheless differ in ways that would lead to class-unequal opportunities to develop social competence. For instance,
35
possible that there are consequential differences in the ways that lower and higher class students engage in the same extracurricular activities.
The results of the third study question suggest that the development of different forms of cultural capital is associated with distinct family advantages. For instance, the impact of parental education is inconsistent for odds of participating in highbrow activities, while having a parent in a higher status occupation, particularly in the Classic Professions, appears to be more
consequential. For omnivorous consumption, parental education is the only class characteristic that directly influences likelihood of engaging in multiple leisure activities in a day. Parental education is also the only class characteristic directly associated with the development of technical capacity. For this outcome, even fine distinctions in parental education, such as the distinction between having a Master’s Degree and a Professional Degree/Ph.D., are associated with significant differences among adolescents. The importance of preserving finer measures of parental background is worth noting for future research, considering how many studies of cultural capital use composite measures of income, occupation, and/or education to describe family class background, or blunt working class versus middle class groupings. The lines of class distinction traverse groups that researchers have assumed to be similar.
36
significantly less time in them; thus, their knowledge may be deep as well as broad. Considering that this group also spends significantly more minutes developing embodied cultural capital as technical capacity, one wonders how this is accomplished. To address such questions, future time diary studies could examine class differences in the substance and structure of entire days,
assessing how patterns in non-capital building activities like sleep and chores are associated with cultural capital development. Qualitative work may uncover how families are able to facilitate the domestic arrangements enabling advantageous time use among their children.
It is important to stipulate that because ATUS covers a single twenty-four hour period in respondents’ lives, it is inappropriate to make claims regarding long-term participation patterns among respondents using ATUS data. For instance, one should not conclude that because lower class adolescents were less likely to report a highbrow activity during their diary day, they never go to museums or attend performance. But because the ATUS is a nationally representative sample of “person-days” (Frazis & Stewart, 2010), one may accurately state that a day in which a highbrow activity occurred was twice as likely to belong to an upper class adolescent as to a lower class adolescent. I have tried to restrict my statements regarding the study’s results to these kinds of observations.
37
APPENDIX 1: OMNIVOROUS ACTIVITIES
Aerobics
Arts and crafts as a hobby Attending movies/film Attending museums Attending performing arts
Attending sporting events, not elsewhere classified
Biking Boating Bowling
Climbing, spelunking, caving
Computer use for leisure (exc. Games) Dancing
Doing gymnastics Doing yoga
Extracurricular music & performance activities Fencing Fishing Gambling Golfing Hiking Hunting
Listening to the radio
Listening to/playing music (not radio) Participating in equestrian sports Participating in martial arts Participating in water sports Performing Playing baseball Playing basketball Playing billiards Playing football Playing games Playing hockey Playing racquet sports Playing rugby
Playing soccer
Playing sports not elsewhere classified Playing volleyball
Reading for personal interest Rodeo
Rollerblading Running
Skiing, ice skating, snowboarding Softball
Taking class for personal interest Television and movies (not religious) Using cardiovascular equipment Vehicle touring/racing Walking Watching baseball Watching basketball Watching biking Watching billiards Watching dancing
Watching equestrian sports Watching fencing
Watching football Watching gymnastics Watching hockey
Watching racquet sports Watching rugby
Watching running Watching soccer Watching softball
Watching vehicle touring/racing Watching volleyball
Watching wrestling
Weightlifting/strength training Working out, unspecified
Wrestling
38
APPENDIX 2: OCCUPATIONAL CATEGORIES COUNTED AS SKILLED WORK
Architecture and engineering occupations
Arts, design, entertainment, sports, and design occupations Business and financial operations occupations
Community and social service occupations Computer and mathematical science occupations Education, training, and library occupations Healthcare practitioner and technical occupations Healthcare support occupations
Life, physical, and social science occupations Management occupations
39
APPENDIX 3: PARENTAL OCCUPATION CATEGORIES
Service
Animal control workers Animal trainers
Armed Forces (last job)
Baggage porters, bellhops, and concierges Bakers
Barbers Bartenders Cashiers
Chefs and head cooks Childcare workers
Combined food preparation and serving workers, including fast food
Cooks
Counter and rental clerks
Counter attendants, cafeteria, food concession, and coffee shop
Couriers and messengers Crossing guards
Dining room and cafeteria attendants and bartender helpers
Dishwashers Dispatchers Firefighters
First-line supervisors of firefighting and prevention workers
First-line supervisors of food preparation and serving workers
First-line supervisors of gaming workers First-line supervisors of personal service workers
First-line supervisors of protective service workers, all other
Fish and game wardens
Food preparation and serving related workers, all other
Food preparation workers Food servers, nonrestaurant Food service managers Gaming managers
Hairdressers, hairstylists, and cosmetologists Hosts and hostesses, restaurant, lounge, and coffee shop
Lifeguards and other recreational, and all other protective service workers
Massage therapists Meter readers, utilities
Miscellaneous entertainment attendants and related workers
Miscellaneous personal appearance workers Nonfarm animal caretakers
Parking lot attendants Parts salespersons Personal care aides
Personal care and service workers, all other Postal service clerks
Postal service mail carriers
Postal service mail sorters, processors, and processing machine operators
Production, planning, and expediting clerks Recreation and fitness workers
Residential advisors
Shipping, receiving, and traffic clerks Stock clerks and order fillers
T our and travel guides Transportation attendants
Transportation security screeners
Ushers, lobby attendants, and ticket takers Waiters and waitresses
40
Lower Manual/Crafts
Adhesive bonding machine operators and tenders
Aircraft mechanics and service technicians Aircraft structure, surfaces, rigging, and systems assemblers
Automotive and watercraft service attendants Automotive body and related repairers Automotive glass installers and repairers Automotive service technicians and mechanics Boilermakers
Bookbinders and bindery workers
Brickmasons, blockmasons, and stonemasons Bus and truck mechanics and diesel engine specialists
Bus drivers
Butchers and other meat, poultry, and fish processing workers
Cabinetmakers and bench carpenters Carpenters
Carpet, floor, and tile installers and finishers Cement masons, concrete finishers, and terrazzo workers
Chemical processing machine setters, operators, and tenders
Cleaners of vehicles and equipment Coin, vending, and amusement machine servicers and repairers
Computer control programmers and operators Computer control programmers and operators Computer, automated teller, and office
machine repairers
Construction and building inspectors Construction laborers
Control and valve installers and repairers Crane and tower operators
Crushing, grinding, polishing, mixing, and blending workers
Cutting workers
Cutting, punching, and press machine setters, operators, and tenders, metal and plastic
Derrick, rotary drill, and service unit operators, oil, gas, and mining
Dredge, excavating, and loading machine operators
Drywall installers, ceiling tile installers, and tapers
Earth drillers, except oil and gas Electrical and electronics installers and repairers, transportation equipment
Electrical power-line installers and repairers Electrical, electronics, and electromechanical assemblers
Electricians
Electronic equipment installers and repairers, motor vehicles
Electronic home entertainment equipment installers and repairers
Elevator installers and repairers Engine and other machine assemblers
Extruding, forming, pressing, and compacting machine setters, operators, and tenders
Fence erectors
First-line supervisors of construction trades and extraction workers
First-line supervisors of farming, fishing, and forestry workers
First-line supervisors of housekeeping and janitorial workers
First-line supervisors of landscaping, lawn service, and groundskeeping workers
First-line supervisors of mechanics, installers, and repairers
First-line supervisors of production and operating workers
First-line supervisors/managers of farming, fishing, and forestry workers
Fishers and related fishing workers
Food and tobacco roasting, baking, and drying machine operators and tenders
Food batchmakers
Food processing workers, all other Forest and conservation workers Furniture finishers
Glaziers
41 Driver/sales workers and truck drivers
Grinding, lapping, polishing, and buffing machine tool setters, operators, and Grounds maintenance workers
Heating, air conditioning, and refrigeration mechanics and installers
Heating, air conditioning, and refrigeration mechanics and installers
Heavy vehicle and mobile equipment service technicians and mechanics
Helpers, construction trades Helpers--production workers Highway maintenance workers Hoist and winch operators Home appliance repairers
Industrial and refractory machinery mechanics Industrial truck and tractor operators
Inspectors, testers, sorters, samplers, and weighers
Insulation workers
Janitors and building cleaners
Jewelers and precious stone and metal workers Job printers
Laborers and freight, stock, and material movers, hand
Lathe and turning machine tool setters, operators, and tenders, metal and plastic Laundry and dry-cleaning workers Locksmiths and safe repairers Locomotive engineers and operators Logging workers
Machine feeders and offbearers Machinists
Maids and housekeeping cleaners
Maintenance and repair workers, general Maintenance workers, machinery
Manufactured building and mobile home installers
Material moving workers, all other
Metal workers and plastic workers, all other Milling and planing machine setters, operators, and tenders, metal and plastic
Millwrights
Mining machine operators
Miscellaneous agricultural workers
Miscellaneous construction and related workers
Miscellaneous plant and system operators Miscellaneous vehicle and mobile equipment mechanics, installers, and repairers
Molders and molding machine setters, operators, and tenders, metal and plastic
Molders, shapers, and casters, except metal and plastic
Motor vehicle operators, all other
Operating engineers and other construction equipment operators
Other extraction workers
Other installation, maintenance, and repair workers
Other installation, maintenance, and repair workers
Other transportation workers
Packaging and filling machine operators and tenders
Packers and packagers, hand
Painters, construction and maintenance Painting workers
Paper goods machine setters, operators, and tenders
Paperhangers
Paving, surfacing, and tamping equipment operators
Pest control workers
Photographic process workers and processing machine operators
Pipelayers, plumbers, pipefitters, and steamfitters
Plasterers and stucco masons
Power plant operators, distributors, and dispatchers
Precision instrument and equipment repairers Prepress technicians and workers
Pressers, textile, garment, and related materials Printing machine operators
Production workers, all other Pumping station operators
42 Miscellaneous assemblers and fabricators
Radio and telecommunications equipment installers and repairers
Railroad conductors and yardmasters Refuse and recyclable material collectors Roof bolters, mining
Roofers
Sailors and marine oilers
Sawing machine setters, operators, and tenders, wood
Security and fire alarm systems installers Semiconductor processors
Sewing machine operators Sheet metal workers
Ship and boat captains and operators Shoe and leather workers and repairers Small engine mechanics
Stationary engineers and boiler operators Structural iron and steel workers
Tailors, dressmakers, and sewers Taxi drivers and chauffeurs
Telecommunications line installers and repairers
Textile winding, twisting, and drawing out machine setters, operators, and tenders Textile, apparel, and furnishings workers, all other
Tool and die makers Transportation inspectors Upholsterers
Water and wastewater treatment plant and system operators
Welding, soldering, and brazing workers Woodworkers, all other
Woodworking machine setters, operators, and tenders, except sawing
Sales/Clerical
Advertising and promotions managers Advertising sales agents
Appraisers and assessors of real estate Budget analysts
Business operations specialists, all other Buyers and purchasing agents, farm products Claims adjusters, appraisers, examiners, and investigators
Compliance officers
Compliance officers, except agriculture, construction, health and safety, and Cost estimators
Credit analysts
Door-to-door sales workers, news and street vendors, and related workers
First-line supervisors of non-retail sales workers
First-line supervisors of retail sales workers Fundraisers
Insurance sales agents
Market research analysts and marketing
Bill and account collectors Billing and posting clerks
Bookkeeping, accounting, and auditing clerks Computer operators
Court, municipal, and license clerks Credit authorizers, checkers, and clerks Credit counselors and loan officers Customer service representatives Data entry keyers
File clerks
Financial analysts
Financial clerks, all other Financial specialists, all other Hotel, motel, and resort desk clerks Information and record clerks, all other Insurance claims and policy processing clerks Insurance underwriters
Interviewers, except eligibility and loan Library assistants, clerical
Loan interviewers and clerks
43 specialists
Marketing and sales managers Meeting and convention planners
Meeting, convention, and event planners Models, demonstrators, and product promoters Public relations and fundraising managers Public relations specialists
Purchasing agents, except wholesale, retail, and farm products
Real estate brokers and sales agents Retail salespersons
Sales and related workers, all other Sales engineers
Sales representatives, services, all other Sales representatives, wholesale and manufacturing
Securities, commodities, and financial services sales agents
Telemarketers Travel agents
Wholesale and retail buyers, except farm products
Miscellaneous legal support workers Library technicians
Teacher assistants
Other education, training, and library workers First-line supervisors of office and
administrative support workers
Switchboard operators, including answering service
postal service
New accounts clerks
Office and administrative support workers, all other
Office clerks, general
Office machine operators, except computer Order clerks
Paralegals and legal assistants Payroll and timekeeping clerks Personal financial advisors Procurement clerks
Proofreaders and copy markers Receptionists and information clerks
Reservation and transportation ticket agents and travel clerks
Secretaries and administrative assistants Statistical assistants
Tax examiners and collectors, and revenue agents
Tax preparers Telephone operators Tellers
Word processors and typists
Office and administrative support workers, all other