ACCULTURATION, BODY MASS INDEX AND TYPE 2 DIABETES RISK IN ASIAN AMERICANS
Eva Erber
A dissertation submitted to the faculty of the University of North Carolina at Chapel Hill in partial fulfillment of the requirements for the degree of Doctor of Philosophy
in the Department of Nutrition (Nutrition Epidemiology) in the Gillings School of Global Public Health.
Chapel Hill 2014
Approved by: June Stevens
Patrick T. Bradshaw Jianwen Cai
© 2014 Eva Erber
ABSTRACT
Eva Erber: Acculturation, body mass index and type 2 diabetes risk in Asian Americans (Under the direction of June Stevens)
Exposure and assimilation to a Western environment (acculturation) might impact the health of Asian immigrants to the US. This hypothesis is supported by the lower prevalence of overweight and diabetes in Asians living in Asia compared to those living in the US, but longitudinal studies are lacking. We conducted a longitudinal analysis on 8,634 Asians using data on acculturation (generational status, length of US residence, age at immigration) and BMI history from the California Men’s Health Study (2002-2003) and information on repeated, measured BMI and diabetes diagnoses from electronic health records (2005-2012). We
determined: (1) differences in BMI changes in Asians living in Asia versus Asians living in the US; (2) the association between acculturation, overweight and BMI change after immigration to the US; and (3) BMI’s role as a mediator of the association between acculturation and incident diabetes.
We confirmed that Asians living in Asia experienced smaller increases in BMI over time than those living in the US at the same age. After immigration to the US, first-generation, foreign-born Asians gained weight rapidly during their first 25 years in the US, yet they never reached the same level of overweight as their second- and third-generation, US-born
higher diabetes risk when we considered the effect independent of BMI using mediation analysis. Their lower BMI levels protect less acculturated Asian men from diabetes.
These results provide novel insights into the influence of a Western environment on BMI and diabetes risk among Asian immigrants and emphasize the importance of public health efforts in this vulnerable ethnic group, which already has elevated diabetes risk at the time of
TABLE OF CONTENTS
LIST OF TABLES ... viii
LIST OF FIGURES ...x
LIST OF ABBREVIATIONS ... xi
I. Introduction ...1
A. Background ...1
B. Research Aims ...2
II. Literature review ...3
A. Asian Americans ...3
1. Overview ...3
2. Differences in characteristics by Asian subgroups ...4
3. Overweight and obesity in Asians ...4
4. Diabetes burden in Asians ...5
B. Acculturation...6
1. Definition ...6
2. Acculturation and body mass index ...8
3. Acculturation and type 2 diabetes ...9
4. Body mass index assimilation as a contributing factor in Asian immigrants changing health ...10
III. Methods ...11
A. California Men’s Health Study (CMHS) ...11
2. Variables ...12
a. Ethnicity... 12
b. Acculturation ... 13
c. Self-reported body mass index ... 14
d. Clinically measured body mass index ... 14
e. Diabetes ... 15
f. Age... 15
g. Education ... 16
h. Income ... 16
B. Analytic methods ...16
1. Generalized estimating equation model ...16
2. Hierarchical linear model ...18
3. Cox proportional hazards regression model ...19
4. Marginal structural models ...19
IV. Longitudinal Study of Body Mass Index in Asian Men who Immigrate to the US ...23
A. Abstract ...23
B. Background ...24
C. Methods...26
1. Study population ...26
2. Measures ...27
3. Statistical analyses ...28
D. Results ...29
E. Discussion ...31
B. Background ...43
C. Methods...44
1. Study population ...44
2. Measures ...45
3. Statistical analyses ...46
D. Results ...48
E. Discussion ...50
VI. The Role of Body Mass Index in the Association Between Acculturation and Incident Type 2 Diabetes among Asian American Men...62
A. Abstract ...62
B. Background ...63
C. Methods...65
1. Study population ...65
2. Measures ...66
3. Statistical analyses ...67
D. Results ...69
E. Discussion ...70
VII. Synthesis ...81
A. Overview ...81
B. Strengths ...84
C. Limitations ...84
D. Future directions ...86
APPENDIX: BASELINE CHARACTERISTICS BY AGE AT IMMIGRATION ...88
LIST OF TABLES
Table 4.1. Characteristics of study sample, California Men’s Health Study ... 36
Table 4.2. Differences (95% CI) in BMI change among Asian men living in Asia compared to those living in the US ... 37
Table 4.3. Differences (95% CI) in BMI change by age groups at immigration ... 38
Table 4.4. Differences (95% CI) in BMI change by calendar year at immigration ... 39
Table 5.1. Characteristics of Asian men in the California Men’s Health Study (2002-2012) ... 55
Table 5.2. Odds Ratio (95% Confidence Interval) of Overweight (BMI ≥25.0 kg/m2 ) Across Different Levels of Acculturation Among all Asians, California Men’s Health Study (2002-2012)... 56
Table 5.3. Odds Ratio (95% Confidence Interval) of Overweight (BMI ≥23.0 kg/m2 ) Across Different Levels of Acculturation Among all Asians, California Men’s Health Study (2002-2012) ... 57
Table 5.4. Odds Ratio (95% Confidence Interval) of Overweight (BMI ≥25.0 kg/m2) Across Different Levels of Acculturation Among all Asians Compared to US-Born Asian Men, California Men’s Health Study (2002-2012) ... 58
Table 5.5. Difference (95% Confidence Interval) in 5-Year BMI Change Across Different Levels of Acculturation Among all Asians and Asian subgroups, California Men’s Health Study (2002-2012) ... 59
Table 5.6. Difference (95% Confidence Interval) in 5-Year BMI Change Across Different Levels of Acculturation Among all Asians and Asian subgroups with additional adjustment for baseline BMI, California Men’s Health Study (2002-2012)... 60
Table 5.7. Difference (95% Confidence Interval) in 5-Year BMI Change Across Different Levels of Acculturation Among all Asians and Asian Subgroups Compared to US-Born Asians, California Men’s Health Study (2002-2012) ... 61
Table 6.1. Characteristics of Asian men in the California Men’s Health Study (2002-2012) ... 76
Table 6.2. Hazard ratios and 95% confidence intervals of the total effect and the pooled direct effect of acculturation on incident diabetes independent of BMI ... 77
Table 6.3. Mean BMI (SD) by level of acculturation ... 78
Table 6.5. Hazard ratios* and 95% confidence intervals of the controlled direct
effect between acculturation and incident type 2 diabetes within levels of BMI ... 80 Table A.1. Characteristics of study sample by age at immigration among all
Asians combined and by Asian subgroup, California Men’s Health Survey
LIST OF FIGURES
Figure 3.1. The total effect of acculturation on type 2 diabetes (A). Controlled
direct effect of acculturation on type 2 diabetes independent of BMI (B). ... 22 Figure 4.1. Adjusted mean BMI (95% CI) at ages 30, 40, 50 and 60 comparing
LIST OF ABBREVIATIONS
BMI Body mass index CHD Coronary heart disease
CMHS California Men’s Health Study CVD Cardiovascular disease
IP Inverse-probability IRB Institutional review board
KG Kilogram
M Meter
MSM Marginal Structural Model
NHLBI National Heart, Lung and Blood Institute NIH National Institutes of Health
SD Standard deviation
I. INTRODUCTION
A. Background
The number of Asian immigrants to the United States (US; Asian Americans) grew six times faster than the general US population in the 1990’s1
. Asians recently surpassed Hispanics as the largest group of new immigrants to the US, and in 2010, 430,000 Asians moved to the US whereas new Hispanic immigrants numbered 390,0002. Nevertheless, there are comparatively few studies on the chronic disease risk of Asian Americans, and the paucity of longitudinal work is especially striking. This surprisingly thin literature is made more troubling by findings that Asians living in the US have a higher prevalence of overweight and obesity compared to Asians living in their ancestral countries3,4, and they may be at greater risk of diabetes at a lower body mass index (BMI) compared to other ethnic groups because they have more body fat (and less muscle) and more abdominal fat at the same BMI level5-8. The obesogenic environment in the US fuels high levels of CVD-related risk in Americans including highly susceptible Asian immigrant populations assimilating to American norms. Thus, it is possible that Asian
immigrants to the US are threatened by a double burden as high levels of risk associated with Asians living in Asian countries are compounded by exposure to an obesogenic environment that fuels high levels of CVD-related risk in America.
Studying disease rates in genetically similar immigrant populations who undergo drastic environmental and lifestyle changes allows us to determine the health effects of changing environmental exposures. Specifically, this dissertation research provides insight into the
in the US and has the potential to inform policy as well as medical and public health practice relevant to this important and growing American ethnic group. Acculturation is defined for our purpose as a cultural change from a traditional Asian lifestyle to a Western lifestyle when migrating from Asia to the US. We used epidemiologic tools and examined extant data from the California Men’s Health Study initiated by Kaiser Permanente of Northern and Southern
California. We emphasized longitudinal approaches to avoid biases inherent in studying these issues in cross-sections. In addition, we studied Asians with different countries/regions of origin combined and separately to determine possible differences among Asian subgroups. Specifically, we examined men of Chinese, Japanese, Korean, Filipino and Vietnamese descent who
immigrated to, or grew up in the US.
B. Research Aims
The aims of this research were as follows.
Aim 1. Determine the association between US residence compared to residence in an
Asian country and changes in BMI with aging.
Aim 2.Determine the association between acculturation and overweight (BMI ≥25
kg/m2) as well as BMI change during US residence. Acculturation was defined in terms of generational status, length of US residence and age at immigration.
Aim 3. Determine the total effect of acculturation on incident type 2 diabetes as well
as the controlled direct effect (independent of BMI) of acculturation on incident type 2
II. LITERATURE REVIEW
A. Asian Americans
1. Overview
The National Institutes of Health (NIH) has urged researchers to conduct more studies of cardiovascular disease (CVD) risk among Asian American populations, which are growing rapidly and among whom the burden of CVD is increasing dramatically9. Thus, CVD among Asian Americans will be a significant cost burden for the US healthcare system. However, current data on CVD and its risk factors are scarce in this population. Asian Americans are especially susceptible to diabetes, an important CVD risk factor, and have been shown to have double the risk of diabetes than Caucasians10.
The number of Asian immigrants grew six times faster than the general US population in the 1990s1. In 2000, 12 million Asians lived in the US11and this number increased to 15 million in 200612 with Chinese being the largest subgroup9. Asians are expected to comprise 10% of the US population by the year 205013,14. However, Asian Americans are an understudied ethnic group in relation to CVD and most research on acculturation focuses on Mexican Americans, although Asians surpassed Hispanics as the largest group of new immigrants to the US in 2010 (430,000 Asians vs. 390,000 Hispanics)2.
minority populations in the US.
2. Differences in characteristics by Asian subgroups
Asian Americans are a heterogeneous group of individuals from various countries of origin who differ in important characteristics. Vietnamese living in the US have lower levels of education than other Asian subroups9 and more than 75% of Japanese and Filipino have incomes that are higher than US average17. Asian Americans have lower smoking rates compared to Whites, Blacks and Hispanics, but within Asian subgroups smoking rates are highest among Koreans (22%) and lowest among Chinese (7%). Most Asian Americans are in the normal BMI range, with rates ranging from 51% in Filipinos to 68% in Chinese. Prevalence of obesity is low in the Asian population, but 14% of Filipinos are obese compared to 5% of Vietnamese or 4% of Chinese. Only 3 in 10 Asian adults engage in regular leisure-time physical activity and
Vietnamese are most likely to be inactive in their leisure-time (46%). These disparate risk profiles between Asians and other ethnic groups and within the different Asian subgroups themselves18 indicate the importance of research on subpopulations to adequately assess predictors of elevated BMI and diabetes risk in Asian Americans.
3. Overweight and obesity in Asians
In the last two decades prevalence of overweight and obesity has increased sharply in Asian countries19 and these increases may be linked to Westernization (i.e. adoption of Western culture)20. Between 1992 and 2002 China, for example, experienced a 50% increase in
adults in Asia compared to adults in the US. The prevalence of overweight and obesity was 69% in the US in 200822, while in Asia prevalence was, for example, 25% in the Philippines and 30% in Japan23. Estimates of overweight prevalence in Asian Americans from NHANES are not considered reliable because of small numbers24, but data from the 2010 National Health Interview Survey suggests that Asians living in the US have higher levels of BMI compared to their counterparts living in Asia with an age-adjusted prevalence of 41%4. Thus, living in the US might have detrimental effects on the health of Asian immigrants. Nevertheless, there have been no longitudinal studies of the impact of American acculturation on body weight in Asian
immigrants.
4. Diabetes burden in Asians
Prevalence of diabetes increased in some Asian countries, but remained somewhat stable or even decreased in others over the last three decades (e.g. Japan: 3.5% in 1980 and 6.0% in 2008; Philippines: 7.7% in 1980 and 6.6% in 2008)25. In the US, however, diabetes is a substantial health burden among Asian Americans. Despite being a well-known CVD risk factor, diabetes alone is also the fifth leading cause of death among Asian Americans with an age-adjusted death rate of 15.5 per 100,000 in 201026. Asian Americans have a higher age-adjusted diabetes
prevalence than Caucasians (8.2% vs. 6.0%)27 and suffer double the risk for type 2 diabetes than their Caucasian counterparts10.
The limited literature on Asian Americans suggests a large variation of diabetes risk across Asian American subgroups (Chinese, Filipino, Japanese, Vietnamese and Korean). Data from the 2004-2006 National Health Interview Surveys suggest that self-reported diabetes rates are
Given that type 2 diabetes is a well-established CVD risk factor with a high prevalence among Asian Americans, it is eminent to determine risk factors specific to Asian Americans that put them at an increased risk of type 2 diabetes. Previous research had difficulty in distinguishing genetic from environmental influences on diabetes. Studying Asian American immigrants
allowed us to identify environmental risk factors while holding genetic influences constant28,29. An especially important and relevant environmental risk factor for Asian Americans is a cultural change from a traditional Asian to a Western lifestyle when migrating from Asia to the US. Thus, it is crucial to elucidate potential pathways through which acculturation can affect disease risk among Asian American immigrants.
B. Acculturation
1. Definition
In the context of this research acculturation is defined as a cultural change from a traditional Asian to a Western lifestyle when migrating from Asia to the US. Only a few small studies have examined how acculturation may impact disease risk in Asian American adults, but acculturation has been hypothesized to exacerbate health problems among Asian Americans. Although CVD rates are drastically increasing in some Asian countries, such as China, the prevalence of CVD in China is still only approximately one quarter of that among Caucasians in the West30. Compared to US residents in general, Chinese living in China and Japanese living in Japan have lower CVD rates31-34 and associated conditions, such as hypertension,
process of migration37-42. However, after immigration this health advantage seems to decrease with increasing time spent in the Western country31,39. Longer duration of residency in a Western country has been shown to increase CVD risk profiles43 and to increase risk of coronary
calcification among Asians44. There is a vast body of literature on the effects of acculturation on Hispanic immigrant population, but studies on Asian immigrants to Western countries are scarce. It has been shown that diverse immigrant groups experience different acculturation processes and, thus, more research on Asian immigrants are essential40,45.
Differences in levels of acculturation between immigrants can result in different health behaviors, such as dietary habits or physical activity levels, and disease outcomes, such as
overweight and obesity46. More recent immigrants have lower obesity prevalence than those who have been in the US for longer periods39,47-49. This suggests that BMI and subsequent risk for chronic disease increases with increasing length of US residence as discussed below. The underlying assumption is that the obesogenic environment in the US, characterized by inexpensive and abundantly available foods and growing portion sizes as well as increased sedentary behavior50, favors weight gain and chronic disease among immigrants. This type of environment is thought to be a major driver of the obesity and chronic disease epidemic. Acculturation measures, such as place of birth, length of US residence and age at immigration, can capture the degree of an immigrant’s exposure to this obesogenic environment51
.
and mortality resulting from coronary heart disease52-55. However, this study assessed the effects of acculturation in the 1970s, prior to the nutrition transition in Asia and the obesity epidemic in the US56,57.
2. Acculturation and body mass index
The Honolulu Heart Program was part of the Ni-Hon-San Study and more than 50 years ago recruited 8,006 men of Japanese ancestry living in Hawaii58,59. The authors found that a higher level of maintenance of Japanese culture, measured using three self-report scales (culture of upbringing, current cultural assimilation and current social assimilation), was related to lower levels of BMI in a cross-sectional analysis. The mean BMI was 26 kg/m2 in the lowest quartile of maintenance of Japanese culture and 23 kg/m2 in the highest quartile (p<0.05). This study also examined BMI and prevalence of diabetes (reviewed below) in Asian Americans in relation to proxies of acculturation. Contrary to expectation, the authors found that Japanese who were born in Hawaii did not have a significantly different mean BMI compared to those born in Japan. This may have been because data were collected prior to, or at very early stages of the US obesity epidemic that was first detected in the late 70’s, and prior to huge transitions in the economy, lifestyles and obesity prevalence in many Asian countries. Therefore this early research has limited application to recent waves of Asian immigrants to the US.
differences in BMI by indicators of acculturation and found no association46,51,66, while six other cross-sectional studies showed a positive association in Asians in both the US and Canada66-71. Some of the differences in the literature might be explained by the finding that acculturation seems to affect Asian subgroups differently72. Data from the 1997-2005 National Health Interview Survey among 1,651 Central Asians and 2,139 Southeast Asians showed that
prevalence of overweight and obesity (BMI ≥25 kg/m2) increased with length of US residence in Central Asians, but not in Southeast Asians69. There are many potential reasons for this observed difference including that these groups experience very different environments and levels of Westernization in their home countries57,73. These results emphasize the importance of examining Asians in country or region-specific subgroups.
3. Acculturation and type 2 diabetes
We know of only one longitudinal study on diabetes. That study used data on Chinese from the Multiethnic Study of Atherosclerosis and found only 2 cases of diabetes among US-born and 43 cases among foreign-born Asians over a median follow-up time of 5 years. No significant differences were detected, perhaps because of low statistical power.
The Honolulu Heart Program had a larger sample size (n=8,006 Japanese men) but used a cross-sectional design. To our knowledge this ground-breaking work remains the only study to find an association between acculturation and diabetes. The authors concluded that Japanese who were born in Hawaii had a significantly higher age-adjusted prevalence of diabetes compared to those who were born in Japan (63.6 versus 52.4)58. This finding remained significant even after adjustment for demographics, BMI, physical activity and diet. However, as previously
applicable to current waves of Asian immigrants to the US and the current US cultural climate.
4. Body mass index assimilation as a contributing factor in Asian immigrants changing health
The specific factors changing Asians’ health after immigration are unknown and it is essential to identify how acculturation affects changes in disease risk. It is especially important to identify potential modifiable factors that might mediate the pathway between acculturation and diabetes to identify targets for diabetes prevention strategies among Asian American minority populations. It is logical to hypothesize that changes in BMI at least partially mediate associations between acculturation and disease risk in Asian Americans, but this possibility has been inadequately studied so far39. Understanding the obesity and diabetes patterns among immigrant populations is essential since increasing chronic disease rates worldwide and
increasing rates of migration can alter chronic disease patterns within and between sending and receiving countries67.
One longitudinal74 and two cross-sectional studies58,61 compared models on the
association between acculturation and diabetes without adjustment for current BMI to models with adjustment for BMI. However, this change in estimate approach to study mediation has several assumptions (including no confounding between mediator and outcome) that are difficult to meet75-77. In this dissertation we used more robust methods to assess mediation, specifically marginal structural models, and we studied both BMI change and disease incidence
III. METHODS
A. California Men’s Health Study (CMHS)
1. Overview of dataset
The majority of the general US foreign-born population resides in California and California also houses the largest share of Asian populations (~4.2 million)13. Thus, data from California include larger representative samples of Asian immigrants than national surveys and they provide an opportunity to identify potential future obesity patterns across the US67.
The California Men’s Health Survey was initiated in 2002 by Kaiser Permanente of Northern and Southern California, a large, prepaid health plan in California, primarily to study prostate cancer etiology, but secondarily to study non-cancer conditions78. Eligible participants were 44 to 71 year old men (mean age: 58.7, SD: 6.8) who were members of Kaiser Permanente. In total 4,010 Chinese, 2,356 Filipino, 1,294 Japanese, 650 Vietnamese and 319 Korean men completed the baseline survey in 2002/03. The baseline survey included questions on
demographics, place of birth for the participant and both parents, time lived in the US, education, medical history, prescription and non-prescription drugs and lifestyle. A follow-up survey in 2006 included questions on weight at different ages throughout adulthood and history of diabetes. We merged the CMHS data with the participants’ Electronic Health Records from 2005-2012 to get information on disease diagnoses and lab results as well as repeated, clinically measured anthropometrics.
effects of acculturation on obesity and chronic disease among Asian immigrants and this dissertation is an essential contribution to determining the causes and prevention strategies of cardiometabolic disease in a new and diverse immigrant population in the U.S. In addition, men tend to be more negatively affected by acculturation than women as they are more likely to be in the workforce, which is associated with increased exposure to the host culture79.
2. Variables
This section describes the assessment of the main variables used in this dissertation work.
a. Ethnicity
Participants reported their race/ethnicity on a screening survey prior to the baseline survey. This information was used to create unique racial/ethnic categories for the following: Chinese, Japanese, Korean, Vietnamese and Filipino. Participants who reported being Mexican, Central or South American, or any other Hispanic are defined as Latino regardless of other race or ethnicity reported and were removed from all other race/ethnic categories to avoid
economic status of their country of origin (GDP per capita in Japan: 33,632; South Korea: 24,801; Vietnam: 2,600; and Philippines: 3,406)81. Van Hook et al. showed that the effect of acculturation on health differs by the level of economic development in an immigrant’s country of origin with those migrating from a country with low GDP being more affected by
acculturation experienced in the US than those who migrated from a country with higher GDP73.
b. Acculturation
Indicators of acculturation included generational status, length of US residence and age at immigration. Participants reported their place of birth as well as their mothers’ and fathers’ place of birth in the baseline questionnaire in 2002/03. Participants chose from a list of countries and could also specify other countries if their place of birth was not listed. This information was used to categorize men as first-generation (foreign-born participant with foreign-born parents), second-generation (US-born participant with at least one foreign-born parent) and
third-generation (US-born participant with US-born parents).
Duration of residence in the US was determined by the question “How many years have you lived in the United States” and participants chose from the categories “my whole life or more than 25 years”, “16-25 years”, “11-15 years”, “6-10 years” and “5 years or less”. In our analyses we collapsed these categories into <10, 11-25 and >25 years to provide adequate sample sizes within categories in the smaller groups studied.
into ≤40 and >40 years at immigration if both the lowest and highest possible age at immigration fell into the same category. We performed sensitivity analyses to compare use of the extreme high and low values.
c. Self-reported body mass index
Participants reported their weight and height at baseline in 2002/03 and recalled their weight at ages 30, 40, 50 and 60 in the 2006 follow-up questionnaire. BMI (kg/m2) was calculated at baseline and these four age decades [BMI = (weight in pounds/squared height in inches) x 703] and analyzed as continuous variables.
d. Clinically measured body mass index
Measured weight and height from the Electronic Health Records (2005-2012) was used to calculate BMI (kg/m2) at each clinic visit. We used an algorithm developed by Dr. Matthew Maciejewski (Durham VA Medical Affairs and Duke University, NC) and Lynne Van Scoyoc (Durham VA Medical Affairs, NC) to clean the weight data. Height was not measured at all clinic visits and, on average, participants had 15 height measurements. To calculate BMI for each year of follow-up we used each participant’s average height from his first 15 clinic visits and average weight from each clinic visit within a year. Follow-up and the beginning of each year of observation started with a participant’s first weight measurement. The use of average annual weight avoids spurious influences from minor weight fluctuations. Each participant could have up to 8 BMI measurements.
obesity: ≥30 kg/m2
) since the use of Asian-specific BMI cutpoints is controversial82-85. However, we performed sensitivity analyses using the Asian-specific BMI cutpoints (underweight: <18.5, normal weight: 18.5-22.9, overweight: 23.0-24.9, obesity I: 25.0-29.9 and obesity II: ≥30.0 kg/m2)86. We also calculated BMI changes between clinic visits and scaled them to 5-year changes.
e. Diabetes
To identify diabetes cases we extracted data on membership, primary care utilization, laboratory tests and pharmaceutical use from health plan electronic databases from 2005-2012. Type 2 diabetes diagnoses are based on four automated health-plan data sources including pharmacy prescriptions for diabetes medications or supplies (insulin, sulfonylurea drugs, metformin, and blood glucose testing supplies), abnormal HbA1c values (>6.7%) in regional laboratory files, primary or secondary hospital discharge diagnosis of diabetes, and emergency department visits for which a physician diagnosis of diabetes was listed87. Recommendations for screening tests are not weight related and time intervals for the screening tests are based on the health plans’ clinical practice guidelines.
f. Age
Age at baseline, at clinical weight measurements and at diabetes diagnosis was calculated from date of birth and date of baseline survey completion, date of clinic visits and date of
g. Education
Participants reported their level of education in the baseline survey by selecting one of the following categories: high school or less, vocational/some college, college graduate or graduate degree.
h. Income
Participants reported their level of income at baseline as <$40,000, $40,000-59,999, $60,000-79,999 and ≥$80,000.
B. Analytic methods
Methods used in the individual studies are summarized in those chapters. Additional methodological details are discussed here.
1. Generalized estimating equation model
In Chapter 4 we used generalized estimating equation (GEE) models to estimate the effect of place of residence (US vs. Asia), age at immigration and year of immigration on BMI changes prior and after immigration. GEE models account for the correlation between repeated measures per person88,89. We used an autoregressive order 1 covariance structure as it is
reasonable for intervals with the same length.
40, 50 and 60 years), country of residence (binary) and an interaction between age and country of residence.
E(BMI)ij = β0 + β1∙(age at reported BMIij) + β2∙(US residenceij) + β3∙(age at reported
BMIij x US residenceij) + β4∙(covariates), where j=1…mi and mi indicates the number of time points for subject i and i=1…n with n being the total number of subjects. The interaction between age at reported BMI and US residence allowed us to calculate the change in BMI associated with a 10 year increase in age among Asians who live in the US compared to Asians who live in Asia (i.e. the estimated effect of US residence on the age-BMI association).
To determine the difference in BMI change by age at immigration we also regressed continuous BMI on categorical age at reported BMI (30, 40, 50 and 60 years), categories of age at immigration (immigration between ages 19-30, 30-40, 40-50 and 50-60 as well as after age 60) and an interaction between age at reported BMI and age at immigration.
E(BMI)ij = β0 + β1∙(age at reported BMIij) + β2∙(age at immigrationij) + β3∙(age at
reported BMIij x age at immigrationij) + β4∙(covariates), where j=1…mi and mi indicates the number of time points for subject i and i=1…n with n being the total number of subjects. The interaction term allowed us to estimate the change in BMI associated with a 10 year increase in age comparing Asians who immigrated earlier in life to those who immigrated later in life. This analysis allowed us to determine the effect of age at immigration on BMI changes after
In Chapter 5 we used generalized estimating equation models with an autoregressive order 1 covariance structure to calculate odds ratios (OR) and 95% confidence intervals (CI) of being overweight comparing different levels of acculturation.
logit[E(Overweight)ij]= β0 + β1∙(measure of acculturationij) + β2∙(covariatesij), where j=1…mi and mi indicates the number of time points for subject i and i=1…n with n being the total number of subjects. We estimated separate models for each measure of acculturation (generational status, length of US residence and age at immigration).
2. Hierarchical linear model
In Chapter 5 we used a 2-level hierarchical linear model for BMI curves90 with an autoregressive order 1 covariance structure to determine the association between acculturation and BMI changes in Asians living in the US, using repeated, clinically measured BMI.
Level 1:
(BMI)ij = β0i + β1i∙(age at BMI measurement)ij + εij, where j=1…mi and mi indicates the number of time points for subject i; i=1…n with n being the total number of subjects.
Level 2:
β0i = γ00 + γ01∙(measure of acculturation)i + γ02∙(baseline covariates)i + δ0i
β1i = γ10 + γ11∙(measure of acculturation)i + γ12∙(baseline covariates)i + δ1i
The error terms (δ0i and δ1i) followed a normal distribution with a mean of 0. Separate models for each measure of acculturation (generational status, length of US residence and age at
3. Cox proportional hazards regression model
In Chapter 6 the total effect of acculturation on incident diabetes was determined using Cox proportional hazard regression models with age as the time scale to determine the hazard ratio (HR) and 95% confidence interval (CI) of diabetes across different levels of acculturation.
where
… unspecified baseline hazard β1 … log hazard ratio of acculturation
Confounders were controlled for by inverse-probability weighting using the weights described in w2 in the section below.
4. Marginal structural models
In Chapter 6 we estimated the direct effect of acculturation, independent of BMI, on risk of diabetes using inverse-probability (IP) weighted marginal structural models (MSM)91. MSM are used to estimate the marginal expectation or distribution of a counterfactual outcome92. Our analysis focused on the controlled direct effect, which has the interpretation of the effect of the exposure on the outcome, holding the mediator to a particular level, as if one intervened on it76,91. These models assume counterfactual consistency (well defined exposures and mediators), positivity (each subject has the possibility of experiencing each exposure level) and
exchangeability (no confounding between the exposure and the outcome as well as no
In this study, the controlled direct effect describes the effect of acculturation on diabetes independent of BMI (Figure 3.1.). We estimate the controlled direct effect by the method outlined by VanderWeele91. The weights for the IP weighted MSM are based on BMI (M) conditional on acculturation (A) and confounders of the BMI-diabetes relationship (C) . The first set of (stabilized) weights, which blocks the pathway from acculturation to BMI (thereby
isolating the direct effect of acculturation), and controls for BMI-diabetes confounders, are given by:
.
The denominator represents the probability of participant i (i=1, …, n) having their observed
level of BMI given their exposure level (acculturation, A) takes the value a and the confounder(s) (C) take the value(s) c. The numerator is the probability of each participant’s specific BMI (M) conditional on acculturation (A) for each individual and is included to improve stability of the final model.
The second set of weights, which controls for confounders of the acculturation-diabetes relationship, are based on acculturation (A) and confounders (C):
.
The denominator represents the probability of a participant’s specific level of acculturation given that the confounder(s) (C) take the value(s) ci while the numerator represents the marginal
probability of acculturation (A) for each individual.Each individual’s final weight was then calculated as
.
weights. We specified the confounders C as, age at baseline, income and education. The final IP weighted Cox MSM was fit using weights as above and terms for the main effects of
acculturation (A), BMI (M) and the acculturation-BMI interaction. We additionally estimated the direct effects of acculturation pooled across levels of BMI, which assumes homogeneity of the effect of acculturation with respect to BMI. The marginal structural Cox model for the controlled direct effect, including the interaction term, is then given by:
where
… unspecified baseline hazard β1 … log hazard ratio of acculturation β2 … log hazard ratio of BMI
A
B
Figure 3.1. The total effect of acculturation on type 2 diabetes (A). Controlled direct effect of acculturation on type 2 diabetes independent of BMI (B).
Total effect
Controlled direct effect (independent of BMI)
Type 2 Diabetes Acculturation
BMI Type 2 Diabetes
IV. LONGITUDINAL STUDY OF BODY MASS INDEX IN ASIAN MEN WHO IMMIGRATE TO THE US
A. Abstract
Background: Cross-sectional studies indicate that adaptation to Western norms, especially at a younger age, might explain the higher average body mass index (BMI) among Asians living in the US compared to Asians living in Asia. However, migrants differ from non-migrants in sociocultural factors that are difficult to measure and, thus, longitudinal studies on the same individuals prior to and after immigration are needed.
Objective: To determine differences in changes in BMI across age by residence (US or Asia) and age at immigration using longitudinal data on BMI prior to and after immigration among Asians.
Methods: Data from the baseline survey (2002-2003) and a follow-up survey (2006) of the California Men’s Health Study was used. The cohort included 1,549 foreign-born Asian men who were aged 44-71. BMI at ages 30, 40, 50 and 60 was calculated using self-reported weight history and current height. Country of residence at each age decade and age at immigration were estimated. Data were analyzed using generalized estimating equations.
Conclusion: This study is the first to support the hypothesis that living in the US and younger age at immigration results in larger BMI increases in Asian men. Interventions focused on maintaining a healthy weight immediately after immigration should be considered for Asian immigrants.
B. Background
The Asian population in the US (here: Asian Americans) is rapidly expanding with 15 million Asian Americans currently living in the US12. Asian Americans in general as well as key subpopulations represent understudied ethnic groups in relation to disease risk9. Most research on immigration and acculturation (i.e. transition from a traditional to a Western lifestyle) focuses on Hispanics94, although new Asian immigrants to the US outnumbered new Hispanic
immigrants in 2010 (430,000 vs. 390,000)2 and the literature on Hispanics cannot be applied to Asians diverse immigrant groups experience different acculturation processes40,45. In addition, previous research on Asian Americans combines all Asians into one group and ignores
heterogeneity9,69.
Asian Americans have, on average, a higher body mass index (BMI) compared to Asians living in their ancestral countries4,95. This difference may be due to exposure to a Western environment in the US. Extant literature is limited to small, cross-sectional studies and does not fully explore critical aspects of the migration experience. The lack of longitudinal studies is especially troubling because immigrants to Western countries differ from their native
time spent in a Western country96. Previous, cross-sectional studies among Asians in Asia versus Asians in the US were not able to control for these differences in the types of people who choose to immigrate versus those who do not4,95. Thus, the role of immigration to the US on the higher levels of BMI observed among Asians living in the US remains uncertain. To answer this question, data on the same individuals before and after immigration are required.
Once immigrants move to the US, they are exposed to a Western obesogenic
environment, which is characterized by increased access to energy dense, palatable foods and lifestyles conducive to physical inactivity. This obesogenic environment has been suggested as cause for the excess increase in BMI in Asian immigrants to the US50. However, Westernization might also contribute to the increasing BMI levels within Asian countries that were observed in the last three decades50. The rates of increasing BMI levels vary across countries19,51,72. Men living in Japan, for example, had an age-adjusted mean BMI of 22.1 kg/m2 in 1980, which increased to 23.5 kg/m2 in 2008, while among men living in the Philippines BMI increased from 21.2 kg/m2 in 1980 to 22.9 kg/m2 in 200895. Although the mean BMI levels remain in the normal range, the overweight prevalence (≥25 kg/m2
) increased from 16.8% and 11.1% in 1980 to 30.1% and 24.5% in 2008 among Japanese and Filipino men, respectively23. These trends in immigrants’ home countries can influence BMI patterns observed after immigration to the US. It is likely that recent immigrants and those from more developed countries arrive in the US with higher BMI levels that are more similar to levels observed in the US. Thus, exposure to the US environment might be less influential among these immigrants51,73. To confirm these
degree of an immigrant’s exposure to the obesogenic Western environment. Younger age at immigration has been shown to increase later overweight and obesity risk46,97.
The goal of this study was to determine if changes in BMI across age differ among Asian men who already immigrated to the US compared to those still residing in their country of origin at the same age prior to their migration to the US. Additionally, differences in these changes by age at immigration and year at immigration were determined to examine potential secular trends. The focus of this study was on BMI between the ages 30 and 60 in three Asian subgroups
(Chinese, Southeast Asians and Other East Asians). To our knowledge this is the first
longitudinal study to examine the effect of moving to the US on BMI changes among Asians.
C. Methods
1. Study population
Kaiser Permanente Northern and Southern California health plans initiated the California Men’s Health Study in 2002-200378
. Eligible participants were 44-71 years old men who had been Kaiser Permanente members for at least one year. The baseline questionnaire collected information on demographics, health status and lifestyle behaviors and was completed by 8,634 men of Chinese, Filipino, Japanese, Vietnamese or Korean ancestry. The following participants were excluded: Asians who were US-born or had missing information on place of birth
Vietnamese. Vietnamese and Filipinos were combined into a category of “Southeast Asians” (n=723) and Japanese and Koreans into a category of “Other East Asians” (n=69) to increase statistical power. These subgroups were chosen because the groups included in each category have similar cardiovascular disease risk80 and their countries of origin have similar economic status (GDP per capita in Japan: $33 632, South Korea: $24 801; Vietnam: $2 600, Philippines: $3 406)73,81. Chinese were examined as a separate category. This study was approved by the Institutional Review Boards of Kaiser Permanente Northern and Southern California and this secondary analysis was approved by Kaiser Permanente and University of North Carolina at Chapel Hill Non-Biomedical Institutional Review Boards on research involving human subjects.
2. Measures
Participants recalled their weight at ages 30, 40, 50 and 60 in a follow-up questionnaire in 2006 and BMI at these four age decades was calculated using height reported at the baseline questionnaire in 2002-03. BMI was analyzed as a continuous variable. The correlation coefficients between clinically measured weight at age 50 (n=91) and at age 60 (n=318) from participants’ Kaiser Permanente electronic health records compared to recalled weight at these ages at baseline were 0.95 and 0.93, respectively. The correlation coefficient between clinically measured height and self-reported height at baseline was 0.87.
Asia or the US at each recalled weight based on their age at immigration. Specific time points, not entire participants, for which country of residence was uncertain were excluded to avoid misclassification. In sensitivity analyses observations with missing country of residence were first assigned to living in Asia and then to living in the US. This did not change the conclusions and, thus, excluding these observations did not seem to have biased the results.
3. Statistical analyses
Differences in mean BMI at each age decade and differences in BMI changes between age decades by country of residence, age at immigration and year at immigration were
determined. The estimates and the associated 95% CI were calculated using generalized
estimating equation models with an autoregressive order 1 covariance structure to account for the correlation between repeated BMI measures88,89. We regressed continuous BMI on categorical age (30, 40, 50 and 60 years), country of residence (binary) and an interaction between age and country of residence. Including this interaction allowed us to calculate the difference in the change in BMI for participants residing in their country of origin compared to those residing in the US during each specific age decade (i.e. the estimated effect of US residence on the age-BMI association). We also regressed continuous BMI on categorical age (30, 40, 50 and 60 years), categories of age at immigration (19-30, 30-40, 40-50, 50-60 and >60 years) and an interaction between age at reported BMI and age at immigration. This analysis allowed us to determine the effect of age at immigration on BMI changes after immigration to the US and the potential for detecting acculturation effects. Finally, we repeated this analysis by replacing age at immigration with calendar years at immigration (1977-1986, 1987-1991, 1992-1997 and after 1997) to
Estimates were determined for all Asians combined and by Asian subgroups (Chinese, Southeast Asians and Other East Asians). All models were adjusted for age at baseline, annual household income (<$40,000, $40,000-59,999, $60,000-79,999 or ≥80,000) and education (high school or less, vocational/some college, college graduate or graduate degree), which were reported in the baseline questionnaire. The analyses were performed using SAS Statistical Software, version 9.3 (Cary, NC). All tests and p-values were two-sided and considered statistically significant at α=0.05.
D. Results
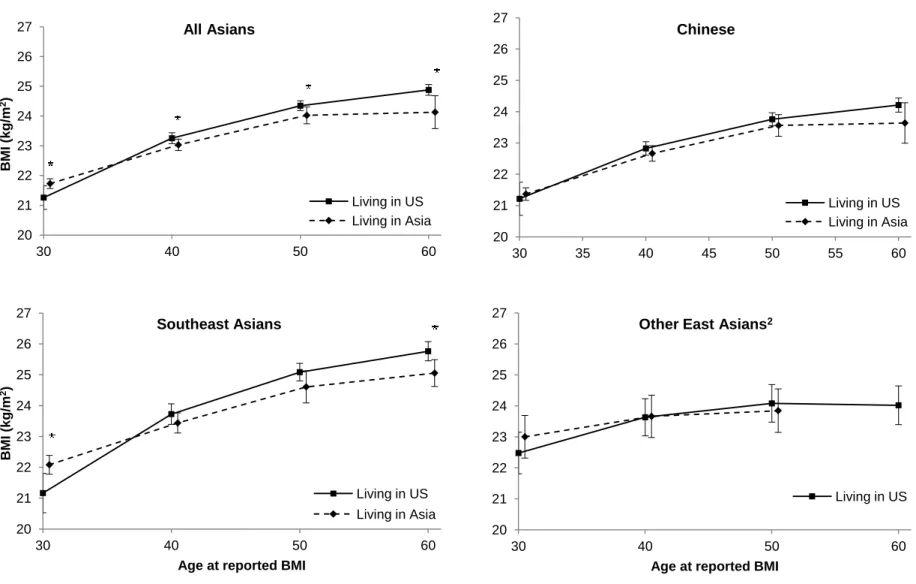
Participants were on average 56 years old at baseline (Table 4.1). Approximately 30% of Chinese were in the lowest and in the highest income categories. In contrast, most Southeast Asians (55.1%) and Other East Asians (66.6%) had at least a college degree but 55.1% and 52.2% reported <$60,000 annual household income, respectively. Overweight prevalence (≥25.0 kg/m2) was heterogeneous between the Asian subgroups (Table 4.1). Among all Asians
combined, the overweight prevalence ranged from 9.3% at age 30 when participants lived in Asia to 42.0% at age 50 when participants lived in the US. When living in Asia, Other East Asians had the highest overweight prevalence at ages 30 and 40 and Southeast Asians had the highest prevalence at age 50. When living in the US, Southeast Asians had the highest
overweight prevalence at all age decades, except at age 30 where Chinese had the largest proportion of overweight individuals.
significantly lower for those who lived in Asia compared to those who lived in the US at the respective age. Similar results were found for Southeast Asians. For Chinese and Other East Asians none of the comparisons were statistically significant.
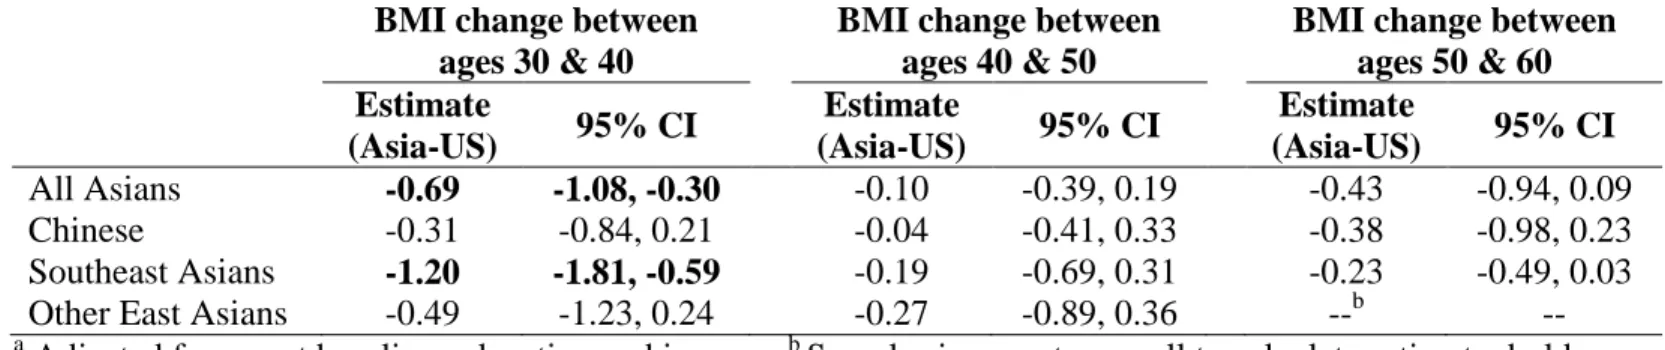
Comparing BMI changes between age decades by country of residence (Table 4.2)
showed that BMI increases over time were less for those who still resided in Asia than those who had immigrated to the US. Yet only the difference in BMI change between ages 30-40 achieved statistical significance with those living in Asia having a 0.69 kg/m2 (95% CI: -1.08, -0.30) smaller increase in BMI compared to Asians who already immigrated to the US during this time period. A similar trend was observed in each Asian subgroup. For Chinese and Other East Asians none of these comparisons were statistically significant. Among Southeast Asians, differences in BMI changes between ages 30-40 were particularly striking (Asia-US: -1.20 kg/m2; 95% CI: -1.81, -0.59).
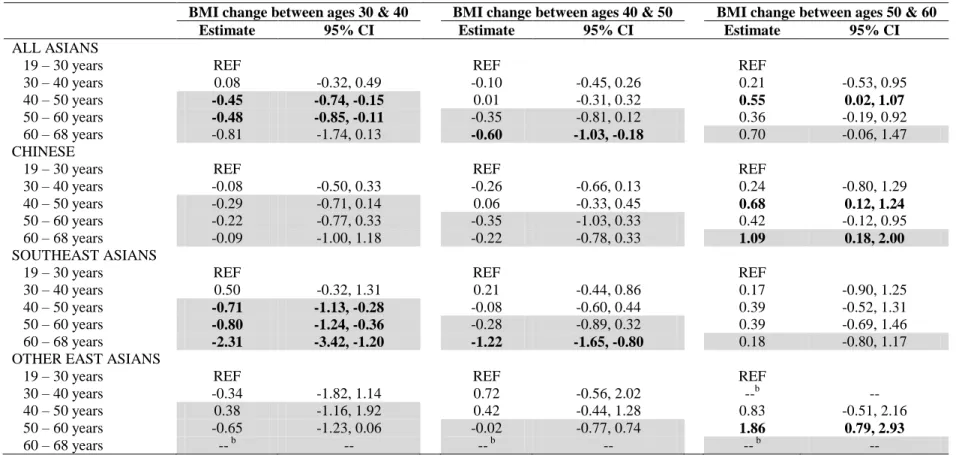
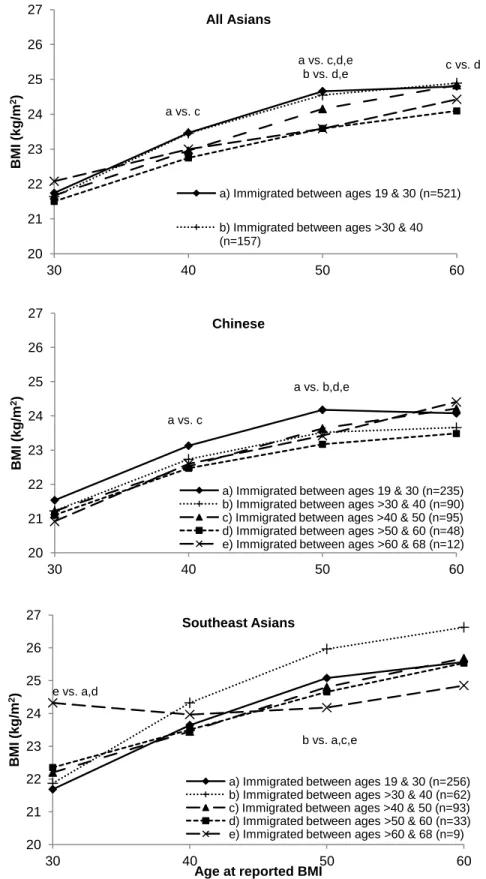
Examining age-related BMI levels by age at immigration showed that Asians who immigrated at an earlier age tended to have larger BMI levels than those who immigrated at a later age (Figure 4.2). Among all Asians combined, participants who immigrated to the US between ages 19-30 or 30-40 had a higher adjusted mean BMI at ages 40 and 50 years compared to other groups. Interestingly, among participants who immigrated between ages 40-50 the mean BMI was lower at ages 40 and 50 compared to those who immigrated earlier, but at age 60 (once they lived in the US) the mean BMI assumed a similar value as participants who immigrated earlier. A similar trend was observed among Chinese. Those who immigrated between ages 19- 30 had a higher mean BMI compared to other groups at ages 40 and 50. Finally, among
Comparing slopes of BMI across groups of immigrants who moved to the US at different ages (Table 4.3) showed that participants who immigrated at a younger age had a significantly greater increase in BMI over time until age 50 compared to those who immigrated at older ages. Additionally, the increase in BMI between ages 30-40 and 40-50 years was lower among Asians who immigrated after these time intervals compared to those who immigrated before the
respective interval, indicating a potential acculturation effect. Similar patterns were observed among the Asian subgroups, but findings were more pronounced among Southeast Asians.
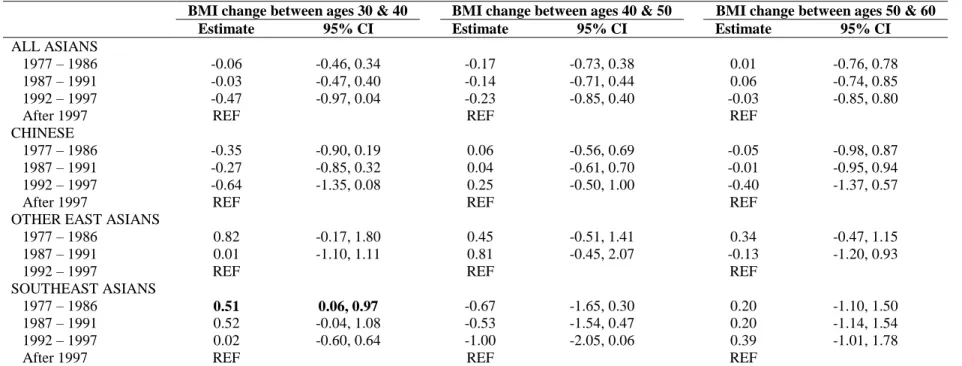
The analyses of year at immigration did not indicate an effect of secular trend on BMI change among Asian immigrant men to the US (Table 4.4). Compared to Asian men who immigrated between 1997-2003, those who immigrated prior to 1997 had similar BMI changes between age decades. The results were consistent across Asian subgroups.
E. Discussion
This study was uniquely able to compare BMI levels and BMI changes associated with exposure to a Western environment and confirmed the hypothesis that the BMI of Asians will increase upon migration to the US. Asian men living in Asia prior to immigrating to the US experienced smaller increases in BMI over time than those who already lived in the US. Asian men who immigrated prior to age 40 were particularly susceptible to larger increases in BMI than Asian men who immigrated later in life. These results demonstrate that early and middle-adulthood might be a vulnerable time period for excess increases in BMI among Asian immigrant men to the US.
Central Asians into one category (Chinese, Japanese, Mongolian, North and South Korean) and compared the odds of being overweight among Central Asian immigrants to European
immigrants to the US within each category of age at immigration (<18, 18-24, 25-44 and 45-74 years). Within each category of age at immigration Central Asians had lower odds of overweight compared to Europeans. This study did not provide any insight if different ages at immigration might have differential effects on BMI among Asians. Additionally, the authors examined each participant’s BMI at only one time point (after immigration to the US) and did not have data on participants’ BMI prior to immigration. Two previous cross-sectional studies among immigrants to the US from all continents combined showed that younger age at immigration increased likelihood of being overweight46,97. These studies found that those <20 years or <22 years at immigration, respectively, had higher odds compared to those arriving at older ages. This suggests that environmental exposures during childhood or adolescence have substantial
influence on adult BMI. The present study adds to this conclusion that immigration during early and mid-adulthood (ages 19-40) may also substantially influence BMI changes later in life, at least in Asian men. In contrast, the hypothesis that exposure to the US environment might be less influential among recent immigrants51,73 was not confirmed in this study.
country of origin, with those migrating from countries with low GDP (such as Vietnam or the Philippines) being more affected by acculturation experienced in the US73.
Changes in diet and physical activity after immigration to the US are likely responsible for the observed excess increases in BMI among Asian immigrants. After immigration to the US Asians consume more sweets and fast foods and fruits, but less meat, meat alternatives and vegetables than when living in their home countries98. In addition, levels of physical activity tend to decrease upon migration to the West99. It is a limitation of the present study that changes in diet and physical activity associated with immigration could not be determined.
Another limitation is that height was self-reported and weight earlier in life was recalled. Compared to men in other race/ethnic groups, Asian males living in the US have been shown to overestimate their height less and to underestimate their weight more100. Nevertheless, self-reported weight does provide a reasonable proxy of measured weight with correlation
coefficients above 0.9 for concurrent estimates in East Asian populations101-103 and in Southeast Asian developing countries where weight is not routinely measured104. A study in an American cohort showed that recall of weight much earlier in life (28 years prior) is also highly correlated (r=0.82) with weight measured at that time105. These relatively high correlations between clinically measured weight and recalled weight at ages 50 and 60 (r>0.9) as well as clinically measured and self-reported height at baseline (r=0.87) suggest that the self-reported height and recalled weight used in the present study are adequate. The Asians included in this present study might not be generalizable to all Asian immigrants to the US since they were members of Kaiser Permanente, had health insurance and lived in a region (California) with a large Asian
household income of <$40,000)106. Additionally, given the strict exclusion criteria to answer this research question, the final dataset included only 18% of all Asian men in the California Men’s Health Study. Given the small sample size we were not able to perform a comprehensive analysis of a potential age-period-cohort effect, but we examined age at immigration as well as year at immigration to determine potential age and secular effects. Despite these limitations, this study provided the unique opportunity to examine the effects of immigration on BMI change among Asian men.
Strengths of this study included the comparably large sample size of Asian Americans, an understudied population. Additionally, Chinese, Southeast Asians and Other East Asians were examined separately to determine differential effects of acculturation by region of origin, and the same individuals were examined across different migration stages (pre- and post-migration) to reduce the potential for bias from healthy immigrant selection as discussed earlier. This bias potentially undermines estimates that solely compare the average BMI in Asian countries to the average BMI among Asians in the US4,95. Additionally, the effects of year at immigration on BMI were examined to rule out potential bias of the age at immigration analyses by secular trends.
Recent analyses of the National Health and Nutrition Examination Survey showed that despite a much lower prevalence of overweight (≥25 kg/m2
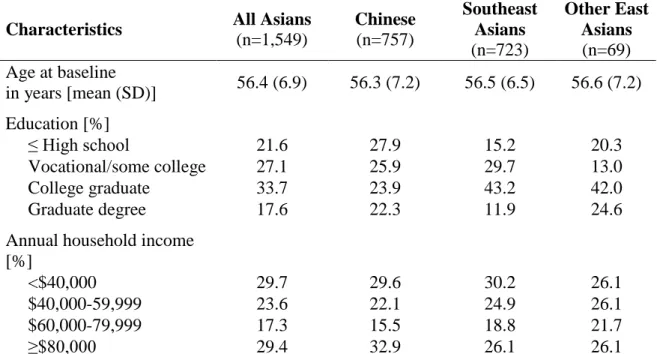
Table 4.1. Characteristics of study sample, California Men’s Health Study
Characteristics All Asians
(n=1,549) Chinese (n=757) Southeast Asians (n=723) Other East Asians (n=69) Age at baseline
in years [mean (SD)] 56.4 (6.9) 56.3 (7.2) 56.5 (6.5) 56.6 (7.2) Education [%]
≤ High school 21.6 27.9 15.2 20.3
Vocational/some college 27.1 25.9 29.7 13.0
College graduate 33.7 23.9 43.2 42.0
Graduate degree 17.6 22.3 11.9 24.6
Annual household income [%]
<$40,000 29.7 29.6 30.2 26.1
$40,000-59,999 23.6 22.1 24.9 26.1
$60,000-79,999 17.3 15.5 18.8 21.7
≥$80,000 29.4 32.9 26.1 26.1
Proportion overweight (≥25 kg/m2
) [% (n of all participants in particular category)] In Asia (prior to immigration to the US)
At age 30 9.3 (n=787) 5.7 (n=436) 12.4 (n=323) 28.6 (n=28) At age 40 19.4 (n=417) 14.0 (n=215) 23.7 (n=190) 50.0 (n=12) At age 50 24.4 (n=86) 17.3 (n=52) 35.5 (n=31) 33.3 (n=3)
At age 60 0 (n=6) 0 (n=5) 0 (n=1) -- (n=0)
In the US (after immigration)
37
Table 4.2. Differences (95% CI) in BMI change among Asian men living in Asia compared to those living in the USa
BMI change between ages 30 & 40
BMI change between ages 40 & 50
BMI change between ages 50 & 60 Estimate
(Asia-US) 95% CI
Estimate
(Asia-US) 95% CI
Estimate
(Asia-US) 95% CI
All Asians -0.69 -1.08, -0.30 -0.10 -0.39, 0.19 -0.43 -0.94, 0.09
Chinese -0.31 -0.84, 0.21 -0.04 -0.41, 0.33 -0.38 -0.98, 0.23
Southeast Asians -1.20 -1.81, -0.59 -0.19 -0.69, 0.31 -0.23 -0.49, 0.03 Other East Asians -0.49 -1.23, 0.24 -0.27 -0.89, 0.36 --b -- a
38
Table 4.3. Differences (95% CI) in BMI change by age groups at immigrationa
BMI change between ages 30 & 40 BMI change between ages 40 & 50 BMI change between ages 50 & 60
Estimate 95% CI Estimate 95% CI Estimate 95% CI
ALL ASIANS
19 – 30 years REF REF REF
30 – 40 years 0.08 -0.32, 0.49 -0.10 -0.45, 0.26 0.21 -0.53, 0.95
40 – 50 years -0.45 -0.74, -0.15 0.01 -0.31, 0.32 0.55 0.02, 1.07
50 – 60 years -0.48 -0.85, -0.11 -0.35 -0.81, 0.12 0.36 -0.19, 0.92
60 – 68 years -0.81 -1.74, 0.13 -0.60 -1.03, -0.18 0.70 -0.06, 1.47
CHINESE
19 – 30 years REF REF REF
30 – 40 years -0.08 -0.50, 0.33 -0.26 -0.66, 0.13 0.24 -0.80, 1.29
40 – 50 years -0.29 -0.71, 0.14 0.06 -0.33, 0.45 0.68 0.12, 1.24
50 – 60 years -0.22 -0.77, 0.33 -0.35 -1.03, 0.33 0.42 -0.12, 0.95
60 – 68 years -0.09 -1.00, 1.18 -0.22 -0.78, 0.33 1.09 0.18, 2.00
SOUTHEAST ASIANS
19 – 30 years REF REF REF
30 – 40 years 0.50 -0.32, 1.31 0.21 -0.44, 0.86 0.17 -0.90, 1.25
40 – 50 years -0.71 -1.13, -0.28 -0.08 -0.60, 0.44 0.39 -0.52, 1.31
50 – 60 years -0.80 -1.24, -0.36 -0.28 -0.89, 0.32 0.39 -0.69, 1.46
60 – 68 years -2.31 -3.42, -1.20 -1.22 -1.65, -0.80 0.18 -0.80, 1.17
OTHER EAST ASIANS
19 – 30 years REF REF REF
30 – 40 years -0.34 -1.82, 1.14 0.72 -0.56, 2.02 --b --
40 – 50 years 0.38 -1.16, 1.92 0.42 -0.44, 1.28 0.83 -0.51, 2.16
50 – 60 years -0.65 -1.23, 0.06 -0.02 -0.77, 0.74 1.86 0.79, 2.93
60 – 68 years -- b -- -- b -- -- b --
a
39
Table 4.4. Differences (95% CI) in BMI change by calendar year at immigrationa
BMI change between ages 30 & 40 BMI change between ages 40 & 50 BMI change between ages 50 & 60
Estimate 95% CI Estimate 95% CI Estimate 95% CI
ALL ASIANS
1977 – 1986 -0.06 -0.46, 0.34 -0.17 -0.73, 0.38 0.01 -0.76, 0.78
1987 – 1991 -0.03 -0.47, 0.40 -0.14 -0.71, 0.44 0.06 -0.74, 0.85
1992 – 1997 -0.47 -0.97, 0.04 -0.23 -0.85, 0.40 -0.03 -0.85, 0.80
After 1997 REF REF REF
CHINESE
1977 – 1986 -0.35 -0.90, 0.19 0.06 -0.56, 0.69 -0.05 -0.98, 0.87
1987 – 1991 -0.27 -0.85, 0.32 0.04 -0.61, 0.70 -0.01 -0.95, 0.94
1992 – 1997 -0.64 -1.35, 0.08 0.25 -0.50, 1.00 -0.40 -1.37, 0.57
After 1997 REF REF REF
OTHER EAST ASIANS
1977 – 1986 0.82 -0.17, 1.80 0.45 -0.51, 1.41 0.34 -0.47, 1.15
1987 – 1991 0.01 -1.10, 1.11 0.81 -0.45, 2.07 -0.13 -1.20, 0.93
1992 – 1997 REF REF REF
SOUTHEAST ASIANS
1977 – 1986 0.51 0.06, 0.97 -0.67 -1.65, 0.30 0.20 -1.10, 1.50
1987 – 1991 0.52 -0.04, 1.08 -0.53 -1.54, 0.47 0.20 -1.14, 1.54
1992 – 1997 0.02 -0.60, 0.64 -1.00 -2.05, 0.06 0.39 -1.01, 1.78
After 1997 REF REF REF
40
Figure 4.1. Adjusted1 mean BMI (95% CI) at ages 30, 40, 50 and 60 comparing Asians living in Asia to Asians living in the US
(point estimates for Asian residence are shifted to the right for display)
* Significantly different with p<0.05; 1 Adjusted for age at baseline, income and education; 2 No participant with BMI information at age 60 when living in Asia
20 21 22 23 24 25 26 27
30 40 50 60
BM I (k g/ m 2) All Asians
Living in US Living in Asia
20 21 22 23 24 25 26 27
30 35 40 45 50 55 60
Chinese
Living in US Living in Asia
20 21 22 23 24 25 26 27
30 40 50 60
BM I (k g/ m 2)
Age at reported BMI
Southeast Asians
Living in US Living in Asia
20 21 22 23 24 25 26 27
30 40 50 60
Age at reported BMI
Other East Asians2
Figure 4.2. Adjusted1 mean BMI at ages 30, 40, 50 and 60 by age at immigration
1
Adjusted for age at baseline, income and education
Superscripts indicate statistically significant BMI differences between groups
20 21 22 23 24 25 26 27
30 40 50 60
BM I (k g/ m 2) All Asians
a) Immigrated between ages 19 & 30 (n=521)
b) Immigrated between ages >30 & 40 (n=157) 20 21 22 23 24 25 26 27
30 40 50 60
BM I (k g/ m 2) Chinese
a) Immigrated between ages 19 & 30 (n=235) b) Immigrated between ages >30 & 40 (n=90) c) Immigrated between ages >40 & 50 (n=95) d) Immigrated between ages >50 & 60 (n=48) e) Immigrated between ages >60 & 68 (n=12)
20 21 22 23 24 25 26 27
30 40 50 60
B M I (kg/ m 2)
Age at reported BMI Southeast Asians
a) Immigrated between ages 19 & 30 (n=256) b) Immigrated between ages >30 & 40 (n=62) c) Immigrated between ages >40 & 50 (n=93) d) Immigrated between ages >50 & 60 (n=33) e) Immigrated between ages >60 & 68 (n=9) a vs. c
a vs. c,d,e
b vs. d,e c vs. d
a vs. c
a vs. b,d,e
e vs. a,d
V. LONGITUDINAL STUDY OF ACCULTURATION AND CHANGES IN BODY MASS INDEX AMONG ASIAN AMERICAN MEN
A. Abstract
Background: Cross-sectional studies examining the association between Western
acculturation and BMI in Asians have been inconsistent, and studies on BMI change are lacking. Objective: This study examined the associations between indicators of acculturation (generational status, length of US residence and age at immigration) and overweight (BMI ≥25kg/m2
) as well as 5-year BMI changes in 7,073 Chinese, Japanese, Korean, Filipino and Vietnamese men who lived in the US and were 44-71 years old at baseline of the California Men’s Health Study (2002-2003).
Methods: Indicators of acculturation were reported at baseline. Repeated clinical measures of BMI were extracted from electronic health records (2005-2012).
Results: Using generalized estimating equations we found that lower generational status, shorter duration of US residence and older age at immigration were inversely associated with being overweight. However, analysis of BMI curves using linear mixed models showed that shorter length of US residence and older age at immigration were associated with larger 5-year increases in BMI.
Conclusions: Asian immigrants who were less acculturated had larger BMI increases as they became more acculturated, but had not achieved overweight status. Healthy weight
B. Background
Asians living in the US (Asian Americans) have a higher prevalence of overweight and obesity compared to Asians living in their ancestral countries 4,23. These differences may be explained by exposure to a Western environment and acculturation, the process of adopting cultural traits of the host country 111. However, cross-sectional studies examining the association between acculturation and body mass index (BMI) in Asian immigrants to Western countries have been inconsistent. Some studies found no association 46,51,58, while others found a positive association 66,68-71. The authors of most studies combined all Asians and do not account for potential heterogeneity between Asian subgroups 72. Additionally, BMI examined in cross-sectional studies might have been the same since pre-migration. Longitudinal studies on BMI change could clarify the previous contradictory results by assuring that the observed changes in BMI associated with different levels of acculturation occurred after immigration.
The obesity epidemic in the US has been linked to consumption of energy-dense foods and physical inactivity, characteristics of an obesogenic environment 112. Acculturation to these norms may have detrimental effects on the health of Asian immigrants 50. A pioneering study of the health consequences of American acculturation in Asians is the Honolulu Heart Program, which approximately 50 years ago recruited 8,006 men of Japanese ancestry living in Hawaii 58,59
prior to the US obesity epidemic, which was first detected in the late 70’s56. More recently, there have been huge transitions in the economy, lifestyles and obesity prevalence in many Asian countries 57. Therefore, early research has limited application to recent waves of Asian immigrants to the US.
Our study determined associations of measures of acculturation (generation, length of US residence and age at immigration), indicating an immigrant’s exposure to the Western
environment, with overweight (≥25kg/m2
) and longitudinal changes in BMI among Asian men. We also sought to examine potential heterogeneity within the Asian population by analyzing results for Asian subgroups separately (Chinese, Japanese, Koreans, Filipino and Vietnamese). To our knowledge this is the first study that has used serial assessments of measured BMI to examine the impact of Western acculturation in Asians.
C. Methods
1. Study population
The California Men’s Health Study is a prospective cohort initiated by Kaiser Permanente Northern and Southern California in 2002-200378. Eligible participants were males aged 44-71 years who had been Kaiser Permanente members for at least one year prior to study enrollment. The baseline questionnaire collected information on demographics, acculturation and
anthropometrics and was completed by 8,634 Asian men (Chinese, Japanese, Korean, Filipino, Vietnamese). Questionnaire data were linked with participants’ electronic health records between 2005-2012 to extract information on weight and height measured at clinic visits.