NETWORKS OF PAST PROFESSIONAL COLLABORATIONS AND LOAN CONTRACT TERMS
Francisco Dimas Peña Romera
A dissertation submitted to the faculty of the University of North Carolina at Chapel Hill in partial fulfillment of the requirements for the degree of Doctor of Philosophy in the
Kenan-Flagler School of Business (Accounting).
Chapel Hill 2019
Approved by:
Wayne R. Landsman Robert M. Bushman Bradley E. Hendricks Mark H. Lang
© 2019
ABSTRACT
Francisco Dimas Pena Romera: Networks of past professional collaborations and loan contract terms.
(Under the direction of Wayne R. Landsman)
I use measures of structural centrality from network theory to examine whether the location of a lead arranger in its network of past syndicate collaborations affects loan
characteristics and outcomes. I hypothesize that more central lead arrangers have access to better information channels that help mitigate adverse selection and moral hazard concerns, and lead to improved financing terms. I find that lead centrality is an important factor in explaining both price and non-price loan terms. Loans granted by more central lead arrangers charge lower spreads than otherwise comparable loans granted by more peripheral arrangers. In addition, more central arrangers grant loans that are typically larger, have longer maturities, and have a lower incidence of restrictive covenants and collateral requirements than loans granted by peripheral arrangers, which suggests that price concessions are not merely substituting for more restrictive clauses elsewhere in the contract. To mitigate the potential for alternative explanations for the effect of lead centrality on spread, I conduct several cross-sectional tests to determine whether the effect is stronger when the value of the information obtained through the network of past collaborations is higher. I hypothesize that information obtained through networks of past
To my mom and the rest of my crazy Canarian family, because they love me the same when I succeed and when I fail. To the handful of mentors that took a gamble on me and pushed
ACKNOWLEDGEMENTS
I am grateful to Wayne Landsman (Chair) for his mentorship and support throughout the PhD program, as well as for his suggestions to improve this draft. I also thank Juan Manuel Garcia-Lara for always having my best interests at heart. I have been influenced by Robert Bushman (committee member), his work and interactions with him in his PhD seminars have inspired many of the ideas in this manuscript. I thank the rest of my committee members: Bradley Hendricks, Yunzhi Hu and Mark Lang for invaluable feedback and guidance. I also thank other faculty and my PhD peers for constructive discussions. Special thanks to Jianxin (Donny) Zhao, Paul Fisher, Jedson Pinto, Nicholas Martin, Gustavo Peralta, Stephen Glaeser, participants of the AAA Rookie Camp (12/2018), UNC Brownbag series (9/2018) and the 2018 AAA J. Michael Cook Doctoral Consortium (6/2018) and workshop participants of University of Tennessee at Knoxville (1/2019), New York University (1/2019), Fordham University (1/2019), Indiana University (1/2019), George Washington University (2/2019), Tulane University
TABLE OF CONTENTS
LIST OF TABLES ... ix
LIST OF FIGURES ... x
CHAPTER 1: INTRODUCTION ... 1
CHAPTER 2: RELATED LITERATURE AND PREDICTIONS ... 8
2.1 Inter-personal linkages in finance and accounting ... 8
2.2 Networks in finance and accounting ... 9
2.3 Background on the syndicated loan market ... 11
2.4 Motivation and predictions... 12
CHAPTER 3: RESEARCH DESIGN ... 17
3.1 Measures of Lead Arranger Centrality ... 17
3.1.1 Degree Centrality ... 18
3.1.2 Betweenness Centrality ... 18
3.1.3 Eigenvector Centrality ... 19
3.1.4 NScore... 20
3.2 Testing for the effect of lead arranger centrality on loan interest spread ... 21
3.4 The effect of centrality on other non-price loan terms ... 25
3.5 Cross sectional tests - is lead centrality more valuable when borrowers are less transparent and harder to screen? ... 26
3.6 Cross sectional test: is lead centrality more valuable when the lead is ex-ante relatively less informed?... 28
CHAPTER 4: SAMPLE AND DESCRIPTIVE STATISTICS ... 29
4.1 Sample Selection ... 29
4.2 Description of the evolution of the global network of loan collaborations ... 30
4.3 Descriptive Statistics: primary variables in my analysis ... 32
CHAPTER 5: EMPIRICAL RESULTS ... 33
5.1 The effect of lead centrality on loan spread ... 33
5.2 Robustness of the effect of lead centrality on loan spread ... 34
5.3 The effect of lead centrality on other, non-price loan terms ... 36
5.4 The effect of lead centrality on spread - conditional on borrower transparency ... 39
5.5 The effect of lead centrality on spread - conditional on measures of lead arranger prior expertise ... 41
CHAPTER 6: ADDITIONAL ANALYSIS... 43
6.1 Within-syndicate information asymmetries and skin in the game ... 43
6.2 Ex-Post Loan Performance... 45
CHAPTER 7: SUMMARY AND CONCLUDING REMARKS ... 46
APPENDIX B – EXAMPLES OF PRACTITIONERS DESCRIBING
INFORMATION FLOWS IN NETWORKS OF LENDING INSTITUTIONS ... 52
APPENDIX C – EXAMPLE OF A SIMPLE NETWORK ... 53
APPENDIX D – MAIN TABLES AND FIGURES ... 54
APPENDIX E – TABLES IN ADDITIONAL ANALYSIS ... 72
LIST OF TABLES
Table 1. Variable Construction ...49
Table 2. Sample selection ...57
Table 3. Descriptives ...58
Table 4. The effect of lead centrality on loan spread ...59
Table 5. Robustness of the effect of lead centrality on loan spread ...61
Table 6. The effect of lead centrality on nonprice loan characteristics ...63
Table 7. The effect of lead centrality on spread conditional on measures of borrower transparency ...65
Table 8. The effect of lead centrality on spread conditional on measures of ex-ante lead expertise ...69
Table 9. Lead centrality and skin in the game ...72
Table 10. The effect of lead centrality on spread in a sample with low within syndicate information asymmetries ...73
LIST OF FIGURES
Figure 1. Measures of structural centrality ...53
Figure 2. Network of loan syndicate participants ...54
Figure 3. Number of institutions that collaborate in loans ...55
CHAPTER 1: INTRODUCTION
I use measures of structural centrality from network theory to examine whether the location of a lead arranger in its network of past loan syndicate collaborations affects loan characteristics and outcomes.
The syndicated loan market is an ideal setting in which to study information flows through networks of professional collaborations. In a syndicated loan, a bank, acting as a lead arranger, typically originates and sells off portions of the loan to other lending institutions. Teams in lending institutions engage in long term relationships with each other when they
repeatedly collaborate in loan syndicates. Lending institutions that collaborate in syndicates must agree on the terms of the loan at origination, must coordinate monitoring efforts as the loan matures, and must vote on amendments and waiver requests when covenant violations occur. The structure of syndicate collaborations can be thought of as a network in which each lending institution is a node, and two nodes are connected if they have collaborated in a loan syndicate in the past. Characterizing syndicate collaborations as a network is useful because network theory has developed a variety of measures that capture the extent to which a node has a more
Chemmanur, Simonyan, & Tehranian (2016), or use their positions of influence for entrenchment purposes (El-Khatib et al., 2015).
In this study, I hypothesize that lead banks in more central positions in the network of past syndicate collaborations have access to better information channels that are valuable in pricing debt claims and structuring loan contracts. Specifically, If networks of past syndicate collaborations promote information sharing between teams in lending institutions, then a lead arranger in a more central position in the network of former syndicate collaborations could be in an advantageous position to extract information useful in the valuation of debt claims, relative to arrangers in more peripheral positions.
There are a number of ways in which valuable information could be moving through networks of past syndicate collaborations. For example, employees at connected institutions could directly share their knowledge about the quality of the borrower, about the prospects of the sector, or about the market appetite for specific loans. In addition, the networks could lower the cost of gathering information, for instance, it may take fewer calls, or prospective lenders may be more forthcoming with their knowledge and expertise when communicating with a former
syndicate partner. Networks of past collaborations could make it easier for a lead arranger to obtain information about similar deals that have recently taken place and this could be helpful because comparable deals serve as a useful pricing benchmark. Moreover, the network can assist the arranger in obtaining information about the exposures of prospective banks to specific
Consistent with this argument, several practitioners have noted that the
well-connectedness of a lead arranger with its peer lending institutions is key for loan pricing, and that information sharing is the main reason why. For example, when describing the pricing strategies of syndicating teams in lead arranger institutions, Campbell & Weaver (2013) pp 260 notes that: “Enquiries with other banks can thus be undertaken only on the basis of trust between the
individuals concerned and it is this feature of the market which is perhaps the most important for a syndication unit, the establishment of a rapport with competitors which does not breach the competitive spirit of the market (any collusion as to pricing being, of course, unacceptable and contrary to competition law) and yet provides for a two-way flow of information”. 1
Motivated by the above assertions, I seek to explore the extent to which the well-connectedness of the lead arranger affects loan characteristics and outcomes, an issue that has received limited research effort. Some notable exceptions are worth mentioning. First,
Engelberg, Gao, & Parsons (2012) explores how past social ties between the top management teams at banks and borrowing firms affect loan contract terms. Second, Godlewski, Sanditov, & Burger-Helmchen (2012) explores the role of bank lending networks as a measure of their experience and reputation in a sample of French syndicated deals. Third, a recent study by Houston et al., (2017) shows that banks whose directors have more shared social connections partner more frequently in the syndicated loan market, and that more central banks in the network of social connections take lead roles more frequently in syndicates.
I expand the above literature by computing measures of lead centrality in the global network of syndicate collaborations and exploring how lead centrality measures affect a broad set of loan contract terms in a comprehensive sample of 41,447 US loans from 1987 to 2016. I
find that lead centrality is an important factor in explaining loan contract terms. Specifically, loans granted by more central lead arrangers in the network of global syndicate collaborations charge a lower loan spread than otherwise comparable loans granted by more peripheral arrangers in the network. A one standard deviation increase in the composite measure of lead centrality is associated with between an 11 bps and a 13 bps decrease in the loan spread charged. This finding is consistent with more central lead arrangers having access to better information channels that mitigate financing frictions, and at least part of the information benefits being passed on to borrowers in the form of lower loan spreads.
To reduce concerns that the result of lead centrality on spread is driven by omitted correlated variables, I conduct a battery of robustness tests. First, I control for a large set of firm-, loan- and bank- variables that prior literature has found to predict interest spreads. Secondfirm-, I include several proxies for the reputation of the lead bank holding company based on prior literature (Bushman and Wittenberg-Moerman, 2012; Ross, 2010), and find that the effect of centrality on spread remains significantly negative. Third, I drop observations arranged by the largest lead bank holding companies, and observations in which there are more than one bank in a lead role in the syndicate. Fourth, I estimate a specification that inserts lead arranger fixed effects, to control for time invariant lead arranger level con-founders. Fifth, I create a
dichotomous treatment variable (i.e., High Centrality) and use entropy matching to ensure that the covariates are balanced in the treatment and control sub-samples. Sixth, I keep only rated firms and estimate a specification with Industry×Rating×Year fixed effects. In all specifications, the effect of lead centrality on loan spread remains significantly negative.
In addition, I find that arrangers in a more central position in the network of past
lower incidence of restrictive covenants and collateral requirements than otherwise comparable loans granted by more peripheral arrangers. This is important because showing that non-price loan terms such as loan amounts, loan maturities, loan covenants and collateral requirements respond to centrality in the same way loan spread does, helps mitigate concerns that any price concessions warranted by more central leads are merely substituting for other, more restrictive non-price clauses elsewhere in the loan contract. If those trade-offs do occur, then the net effect of lead arranger centrality on loan terms becomes uncertain.
To further substantiate my inferences and mitigate the potential for alternative explanations for more central lead arrangers charging a lower loan spread than peripheral arrangers, I conduct several additional tests to determine whether the effect of lead centrality on spread is stronger when the value of the information obtained through the leads network is likely to be higher.
First, I predict that the information obtained from networks of past syndicate collaborations is likely higher when borrowers are relatively less transparent and harder to screen. I find evidence consistent with this prediction. Specifically, the effect of lead centrality on spread is higher for borrowing firms that are relatively less followed by analysts, for firms that do not have an S&P credit rating, for firms in high tech industries, for firms involved in R&D activities, and for firms whose financial statements are not audited by a Big5 audit firm.
Second, I predict that the information obtained from networks of past syndicate
a relationship bank. Consistent with lead arrangers extracting valuable information through their network of past syndicate collaborations, I find evidence supporting each of these predictions.
Third, I explore the possibility that the effect of lead centrality on spread is primarily driven by the ability of more central lead arrangers to use their well-connectedness to mitigate ‘within syndicate’ information asymmetries (i.e., information asymmetries between better informed lead arrangers and less informed syndicate participants). I re-run my main analysis, but I focus on a sub-sample of loans for which I expect within-syndicate information asymmetries to be either low or nonexistent. Specifically, I focus on loans granted to New Firms, that is, loans with an origination date that is earlier than three years after the borrowing firms’ IPO, as well as loans in which the lead arranger is the sole lender. The effect of lead centrality on loan spread remains significantly negative in both of these sub-samples. This mitigates the possibility that the effect of lead centrality on loan interest spread is solely driven by more central lead arrangers using their well-connectedness to reduce within syndicate information asymmetries, and suggests that at least part of the benefits of lead centrality stem from lead arrangers extracting (rather than only disseminating) information from their network of past collaborations.
Finally, I explore the relation between lead centrality and ex post loan performance, in an attempt to understand whether the price (and non-price) concessions granted by more central lead arrangers are a good decision ex-post. The findings reveal that, controlling for observable firm-, loan- and bank- level characteristics, lead arranger centrality is significantly negatively associated with the probability that the loan defaults during its life.
CHAPTER 2: RELATED LITERATURE AND PREDICTIONS
Two streams of literature are the most relevant antecedents to this paper. The first is the stream of literature that explores the extent to which social ties between agents and firms have implications for capital markets. The second is the emerging literature that uses graph theory and measures of structural centrality to capture the extent to which certain individuals or firms have better access to resources and information.
2.1 Inter-personal linkages in finance and accounting
Numerous studies focus on the role of inter-personal connections and their effect on capital markets. For example, Cohen et al., (2008) studies portfolio allocation decisions of mutual fund managers that share past educational connections with corporate board members (such as when fund managers and corporate board members have a common alma-mater). Consistent with connected fund managers having access to better information channels through their network of past educational connections, the findings reveal that managers place more concentrated bets on connected stocks and that trades on connected positions outperform trades on unconnected positions. In a similar vein, Cohen and Malloy, (2010) shows that sell-side analysts use their network of past educational connections to gather information about the firms that they analyze. The study finds that sell side analyst with shared past educational ties issue more accurate recommendations. On the other hand, several studies uncover some of the
effectiveness of the board is weaker. Similarly, Guan et al., (2016) shows that audit quality is compromised when auditors and clients share past educational connections.
More closely related to this study are studies that explore the role played by social connections in the syndicated loan market. For example, Engelberg et al., (2012) shows that when banks and borrowers share past educational connections, interest rates and other loan terms are considerably reduced. Houston et al., (2017) shows that bank with social connections partner together in the syndicated loan market more frequently and that banks in more central positions in the network of social connections contribute more to the systemic risk of the system.
Although the studies described here focus on the existence of an explicit social link between top individuals at firms (for example, in Engelberg et al., (2012) the top managers of a bank and a borrowing firm either share a past social connection or they do not), a growing stream of literature considers the network structure that emerges from the overall set of connections between firms or agents.
2.2 Networks in finance and accounting
Several studies use networks of connections to compute measures of structural centrality that capture the extent to which top individuals at firms are in more influential positions in the overall network, and purport that firms with individuals in more influential positions have access to better resources and information channels. 2 For example, Larcker et al., (2013) shows that firms with more central boards of directors in the network of shared directorates earn superior risk-adjusted returns than firms whose boards have more peripheral positions. On the other hand, El-Khatib et al., (2015) shows that more central CEOs in the network of social connections use
2 See Freeman, (1978) for a discussion of the notion of structural centrality, and Jackson, (2010) for a comprehensive treatment
their positions of influence to engage more frequently in empire building and value-decreasing M&A activities.
The literature outlined thus far focuses on the role of social connections between top individuals in firms (i.e, directors, CEOs, top executives etc.). However, many important decisions are not made at the highest levels of the chain of command, and relevant information sharing happens at lower levels in the hierarchy of organizations as well. More importantly, while the above literature emphasizes the importance of social connections, for example when the top management in two firms share an alma-mater, the literature largely neglects that much of the information sharing between organizations occurs from professional connections, rather than social connections, such as when the teams of two firms repeatedly collaborate in projects. If information sharing occurs between teams of mid-ranked individuals engaged in repeated collaborations, then it is possible that more central firms in the network of professional
I expand the literature that explores the role of networks of professional collaborations by focusing on the syndicated loan market, a setting in which repeated collaborations between the teams of lending institutions is particularly prominent. Specifically, I study whether the location of the lead arranger in the global network of peer syndicate lenders has implications for loan characteristics and outcomes.
Before outlining my motivation and predictions it is useful to provide some institutional background on the functioning of the syndicated loan market.
2.3 Background on the syndicated loan market
Corporate loans remain the primary source of funds for corporations. Prior to the 1980’s, the lending market was dominated by large commercial banks that granted loans and held them to maturity. Now, syndicated loans in which a bank, acting as a lead arranger, originates and sells off pieces of the loan to other lending institutions, are a sizable portion of the market.
Syndicated lending typically involves several important stages. 3 First, in a pre-mandate stage, a borrower expresses its need from the syndicated loan market and solicits bids from one or multiple banks that compete for the mandate. Banks competing for the mandate gather information about the purpose of the loan, the credit quality of the borrower, as well as current market conditions that may affect the banks ability to offload portions of the loan to other lending institutions either during the syndication phase or through the use of the secondary loan market after the syndication has been completed. Once all pertinent information has been gathered, competing banks submit a bid for the mandate. The bid typically involves both a pricing range as well as a syndication strategy. The syndication strategy includes a proposed list
3 see Campbell and Weaver, (2013) for a more comprehensive discussion of the syndicated loan market, its evolution and
of prospective lenders predicted to have an interest in joining the syndicate and acquiring a portion of the loan. Once the mandate has been awarded (i.e, when the borrower selects a winner among the competing bids), the mandated lead arranger prepares an ‘information memorandum’ that contains all pertinent information about the borrower that will be relevant to prospective banks and lending institutions. 4 It has become increasingly prevalent that the borrower and the lead arranger organize a roadshow in which the borrower meets with prospective lenders and presents its forecast and financial performance followed by a Q&A session. After borrower and loan information has been disseminated to prospective lenders, a term sheet and formal invitation letters are sent out to prospective lenders that can choose to participate in the loan in various amounts. Upon the successful signing of the transaction, a member of the syndicate group is assigned the ‘agent’ duty. The agent is in charge of coordinating the administration of the facility, gathering covenant compliance information and disseminating it to the lender group, collecting fees, arranging for covenant waivers and amendments in the event of technical default, etc. In addition, the secondary loan market has become increasingly important in the post signing phase. The secondary loan market allows lenders to offload portions of their loans to other bank and non bank institutional investors should the need to reduce exposure to a specific sector, borrower or geography arise (Parlour and Plantin, (2008)).
2.4 Motivation and predictions
The syndicated loan market is an ideal setting in which to study information flows through networks of professional collaborations. Teams in lending institutions engage in long
4 The information memorandum frequently contains material, non-public information such as cash flow projections, interim
performance measures, etc. This information memorandum is sent out to an agreed upon list of banks, who must sign
term relationships when they jointly fund loans. The structure of syndicate collaborations can be thought of as a network in which a lending institution is a node, and two nodes are connected if they collaborate in a syndicate. To the extent that syndication networks facilitate information sharing, a more central lead arranger in the network of former syndicate collaborations could be in a better position to extract information useful in the valuation of debt claims. That is,
information sharing in the network of former syndicate partners grants central lead arrangers access to better information about the credit risk of the borrower and/or market appetite for loans.
There are a number of ways in which valuable information could be moving through networks of past syndicate collaborations. For example, employees at connected institutions could directly share their knowledge about the quality of the borrower, about the prospects of the sector, or about the market appetite for specific loans. In addition, the networks could lower the cost of gathering information, for instance, it may take fewer calls, or prospective lenders may be more forthcoming with their knowledge and expertise when communicating with a former
syndicate partner. Networks of past collaborations could make it easier for a lead arranger to obtain information about similar deals that have recently taken place and this could be helpful because comparable deals are typically a useful pricing benchmark. Moreover, the network can assist the arranger in obtaining information about the exposures of prospective banks to specific industries, geographies, borrowers, as well as changes in credit policies at such banks, all of which facilitate the arranging bank’s ability to predict which set of banks are likely to participate in the loan and what price will clear the market.
For example, consistent with syndicating units at lead arranger institutions gathering information through their network of peer institutions, Campbell and Weaver, (2013) pp 260 notes that: “Enquiries with other banks can thus be undertaken only on the basis of trust between the individuals concerned and it is this feature of the market which is perhaps the most important
for a syndication unit, the establishment of a rapport with competitors which does not breach the
competitive spirit of the market (any collusion as to pricing being, of course, unacceptable and
contrary to competition law) and yet provides for a two-way flow of information”.
Appendix B contains additional examples of practitioners highlighting the importance of relationships with peer institutions for the success in the banking business. Several of the
examples explicitly mention that nurturing a network of contacts and developing relationships of trust with peer institutions is fundamental in order to gain access to timely information.
Motivated by the above assertions, my study seeks to explore the extent to which the well connectedness of the lead arranger affects loan characteristics and outcomes.
A vast number of theoretical studies have explored market failures and financing frictions that arise from adverse selection concerns when there is information asymmetry between
central arrangers should be willing to accept lower interest terms (holding all else constant). 5 Moreover, if competition in the lending market leads to some of the information benefits being shared with borrowers, then I expect a negative relation between lead arranger centrality and interest spread. This leads to my first hypothesis (all hypotheses are stated in alternative form):
Hypothesis 1: Lead Arrangers with more central positions in the network of syndicate collaborations charge a lower loan spread.
Interest spread is only one of multiple loan terms that are bargained in lending
agreements. For example, when asset substitution and risk shifting are a concern, lenders may seek protection with the use of net worth and financial covenants (Smith and Warner (1979)), or by lending in lower amounts, shorter maturities, and by requiring more collateral backing. If more central lead arrangers have access to better information channels that are helpful in mitigating risk shifting and asset substitution, then I expect that loans granted by more central lead arrangers are larger, have longer maturities and have a lower incidence of restrictive covenants and collateral requirements than otherwise comparable loans granted by arrangers in more peripheral positions in the network. Note that testing whether non-price loan terms respond to centrality in the same way loan spread does, helps mitigate concerns that any price
concessions warranted by more central leads are merely substituting for other, more restrictive non-price clauses elsewhere in the loan contract. If those trade-offs do occur, then the net effect of lead arranger centrality on loan terms becomes uncertain. This leads to my second hypothesis:
5 The logical framework here parallels that in Petersen and Rajan, (1994) where relationship lenders have access to better
Hypothesis 2: Lead Arrangers in more central positions in the network of past syndicate collaborations lend in larger amounts, over longer maturities, with lower incidence of restrictive covenants and with less frequent collateral requirements.
To further substantiate my inferences and mitigate the potential for alternative
explanations as to why more central lead arrangers charge a lower loan spread, I conduct several cross sectional tests to determine whether the effect of centrality on spread is stronger in
instances in which the access to better information channels is likely to be more valuable for lead arrangers. First, I expect the information obtained through networks of prior syndicate
collaborations to be particularly valuable when borrowers are less transparent and harder to screen. This leads to my third hypothesis:
Hypothesis 3: The effect of lead arranger centrality on loan spread is more pronounced for firms that are less transparent and harder to screen.
Second, if lead arrangers use their network of past syndicate collaborations to acquire information that is valuable in loan pricing, I expect the value of the syndicate network to be higher in cases in which the lead arranger is ex-ante less informed about the borrower. This can occur when the lead arranger is new to the industry of the borrower, the geography, the lead arranger is not a local bank, or when the lead arranger is not a relationship bank. This leads to my fourth hypothesis:
CHAPTER 3: RESEARCH DESIGN 3.1 Measures of Lead Arranger Centrality
A key element in my research design requires the computation of lead arranger centrality. To do so, I largely follow Bajo et al., (2016) and Hochberg et al., (2007), and consider each lending institution as a node in a network, and two lending institutions are connected when they collaborate in at least one common loan syndicate in the 5 years prior to a loan initiation. 6
Because structural centrality is a multi-dimensional construct (see Freeman, (1978) for a discussion), I follow El-Khatib et al., (2015); Houston et al., (2017) and Larcker et al., (2013) and use three common centrality measures widely used in network theory. The first, Degree, simply measures the number of institutions that the focal institution is connected to, the second, Betweenness, measures the frequency with which an institution is located in the shortest path between other institutions, and the third, Eigenvector, measures the extent to which an institution is connected to institutions that are themselves central.
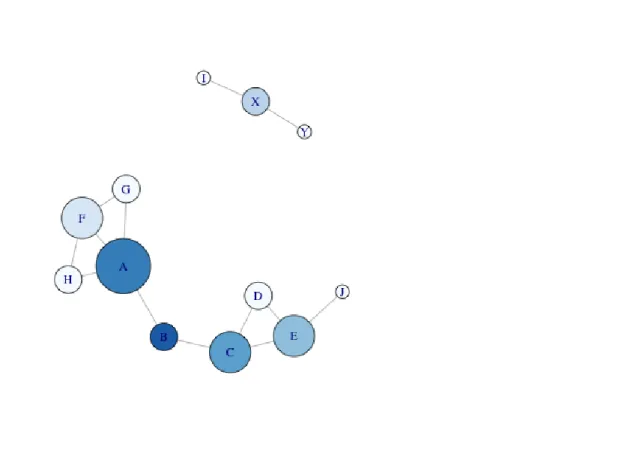
I describe each in turn with the use of a simple network.
6 Dealscan provides unique identifiers for each lending institution involved in a loan. In addition, Dealscan also provides
3.1.1 Degree Centrality
Degree is the simplest measure of node centrality. The degree of a node in a network is simply the count of the number of its adjacent nodes, i.e., the number of distinct relationships a lending institution has established with other institutions through its collaboration in prior loan syndicates. An institution with relatively more connections has more communication channels through its partner institutions, and this likely improves an institutions’ ability to extract and/or disseminate information through the network. Degree centrality is computed as follows:
, , i j j i i x Degree n ≠
=
∑
(1)where xi,j is 1 when institutions i and j collaborate in at least one syndicate, and n is the number of nodes in the network.
In the example provided in figure 1, the un-scaled degree centrality score of node C is 3 because node C is connected to three other nodes, that is, nodes {B,E,D}.
3.1.2 Betweenness Centrality
Betweenness centrality measures the frequency witch which a node is located on the shortest path between any other two nodes of the network. Lending institutions that score high on Betweenness act as gatekeepers of information because an institution located between two other institutions (or clusters of institutions) can either facilitate or impede the information flow between institutions.
Betweenness Centrality is computed as follows:
: ,
( , ) / ( , ) , ( 1)( 2) / 2
i j i i k j i
where G(k,j) are all the shortest paths existent between nodes k and j, and Gi(k,j) are all the shortest paths between nodes k and j that go through node i.
In the example provided in figure 1, the un-scaled betweenness centrality score of node F is 0.5. Note that node F is only in the shortest paths that connect nodes H and G and we can therefore disregard the rest of the nodes. There are a total number of 2 shortest paths from node H to node G (i.e., H → A → G and H → F → G), and a total of two shortest paths from node G to node H (i.e., G → A → H and G → F → H). Two out of the four shortest paths go through node F, and therefore the unscaled betweenness score of node F is 0.5. In addition, it is worth noting that while node B scores lower in degree centrality than, for example, node E (node, E has 3 friends while node B has only 2), node B has a larger betweenness centrality score than node E. This is because node B is more frequently in the shortest path between all nodes (betweenness of B is 16, whereas betweenness of E is 7). This illustrates the multi-dimensional nature of centrality. While node E has more direct contacts and could conceivably extract information from a larger number of institutions, node B is a gatekeeper because it lays in between two clusters of
institutions and it could use its position to facilitate or impede information flows between those clusters.
3.1.3 Eigenvector Centrality
have a access to better information channels through their connections to lending institutions that are themselves central. Eigenvector Centrality is computed by solving the following:
1 , 1
,
i i j j
j
Eigen λ− Eigen =
=
∑
Ω (3)where Ωi,j is 1 when institutions i and j collaborate in at least one syndicate and λ
is the largest eigen-value of the adjacency matrix Ω. An adjacency matrix (or matrix of
connections) is simply a convenient way of describing a network. A network composed by a set of nodes or banks, B = {1,2,··· ,n} and a set of links (or relationships between banks) ω. If a link exists between banks i and j, we indicate it as (i,j) ∈ ω . The adjacency matrix is the n × n matrix Ω = [Ωij] whose element Ωij 6= 0 whenever (i,j) ∈ ω. The network is un-directed if links are such that Ω = ΩT, meaning that if bank A is connected to bank B, then bank B is also connected to Bank
A. A network is un-weighted if Ωi,j ∈ {0,1}, meaning that connections are binary, banks are either connected or they are not, but there is no weight assigned to the strength of the
relationship. In the example provided in figure 1, it is worth noting that while node F and node E both have a score of 3 in degree centrality, the eigenvector centrality of node F is higher than that of node E (eigen of node F = 0.87, eigen of node E = 0.24). This occurs because despite having the same number of friends, the friends of node F are themselves more popular than those of node E.
3.1.4 NScore
Because as shown above, each of the three centrality measures described reflects
and assign the bank a rank value (i.e., the least central bank is assigned a 1, the second least central bank is assigned a 2, and so forth). I then divide the centrality rank by the number of distinct banks in each year in my sample. The rank transformation preserves the rank order of centrality scores and simplifies the interpretation of coefficients. NScore will be the primary centrality measure that I used throughout my analysis and when discussing results. Results are generally the same when using the normalized raw scores of each of the centrality measures, but NScore, by averaging accross the various dimensions of centrality, likely reduces noise when measuring the construct of interest. I compute NScore as follows:
10( _ ( ) _ ( ) _ ( )),
3 #_ _ _
i i i
i
Year Rank Degree Year Rank Betweenness Year Rank Eigen NScore
Banks in Year
+ +
=
×
(4) Using the example provided in figure 1 as the network for a given year in my sample, degrank, eigenrank and betwrank are the scaled ranked values of degree, betweenness and eigenvector centrality respectively. Taking the average and multiplying by 10, we get NScores with values ∈ (0,10].
3.2 Testing for the effect of lead arranger centrality on loan interest spread
I generally base my research design in that of Bajo et al., (2016) and Chuluun,( 2015). I test for the effect of Centrality on Spread by estimating the following equation by OLS:
, 0 1 , 1 2 1,
1, 1,
_ _
_ _
i t i t j j k
k l l m
Spread Centrality Loan Controls Firm Controls
Bank Controls Fixed Effects
β β β β
β β
− − +
+ +
= + + + +
Each observation in the analysis corresponds to one loan (facility). 7 The dependent variable, Spread, is the interest margin over the LIBOR (London Inter-bank Offered Rate) for each loan. Centrality is each of the measures of lead arranger centrality described in section 3.1. β1 reflects the change in spread for a one unit increase in the measure of lead arranger centrality. Hypothesis 1 predicts β1 is negative, which is consistent with more central lead arrangers with
access to better information channels accepting lower loan spreads than arrangers in more peripheral positions in the network.
Equation 3.5 includes a set of control variables for a variety of firm- and loan-specific characteristics that prior research identifies as affecting loan spread. Firms whose loans are arranged by more central lead arrangers could possess observable (and unobservable)
characteristics that, while unrelated to the hypothesized mechanism by which more central lead arrangers can access better information channels, make them more attractive to more central lead arrangers and simultaneously affect interest spread. For example, it is possible that loans
arranged by more central lead arrangers are larger and riskier. Inclusion of observable firm- and loan-specific characteristics that are correlated with loan spread and plausibly correlated with Centrality helps mitigate the potential for coefficient bias for the explanatory variable of interest, Centrality.
The firm characteristics are the ratio of long-term debt plus debt in current liabilities divided by total assets, Leverage; firm size as measured by the natural logarithm of total assets, AtLog; the ratio of property plant and equipment plus inventory divided by total assets,
Tangibility; return on assets, Roa; an indicator variable for firms with negative income before extraordinary items, Dloss; the ratio of capx to total assets, Capx Intens; the Altman Z-score,
AltmanZ 8; an indicator variable for firms with an S&P long-term rating greater than or equal to BBB-, InvG. In addition to time varying firm characteristics, I estimate eq. 3.5 using either industry fixed effects or firm fixed effects. Including industry (firm) fixed effects, controls for unobservable industry (firm) characteristics that are constant over time, Industry FE (Firm FE). All firm-level variables are measured as of the most recent annual financial reporting date prior to the loan origination.
I include loan characteristics that prior research identifies as being related to loan spread (see, for example Amiram et al., (2017); Nandy and Shao, (2007) and Shan et al., (2016)).
The loan characteristics I include in equation 3.5 are the natural log of the loan dollar amount, LoanAmtLog; the natural log of the loan term in months, MatLog; an indicator variable that equals one if the loan has a performance pricing provision, DPerfpricing; the natural log of then number of distinct lenders, Nlenders; an indicator variable that equals one if a loan is secured, DSecured; an indicator variable that equals one if a loan has covenants, DCovenants; a set of 37 indicator variables for loan purpose, e.g., whether a loan is used to finance an
acquisition or whether a loan is used to execute a leveraged buyout; an indicator variable for whether a loan is a Term Loan B loan and below, DTermB 9; an indicator variable of whether the loan is a Revolver/Line of credit, DRevolver; an indicator variable that takes value one if the parent bank holding company that arranges the loan is classified by dealscan as either “Bank of America Merrill Lynch”, “JP Morgan” or “City” or any of its predecessors (based on Ross,
8 Following Altman, (1968) I calculate Altman Z-score using the following equation: (1.2 ∗ (act − lct)/at) + (1.4 ∗ re/at) + (3.3 ∗
(ni + xint + txt)/at) + (0.6 ∗ csho ∗ prcc/lt) + (0.999 ∗ sale/at).
9 Landsman et al., (2017); Lim et al., (2014); Nandy and Shao, (2007) show that loans involving non-bank institutions charge an
(2010)), BH Reputation 10; an indicator variable that takes a value of one if the lead arranger has arranged at least one other loan by the same borrower in the previous 5 years , Relationship.
Equation 3.5 also includes year fixed effects, Year FE to control for common
macroeconomic factors that explain Spread; as well as an indicator variable for loans involving multiple lending institutions with a lead role in the syndicate, Multi Lead, to control for
systematic differences in loans with multiple lead arrangers). 11 All indicator variables take on the value of zero otherwise. Appendix A provides definitions of all variables used in equation 3.5 and following equations and details on how the variables are constructed.
3.3 Sensitivity analysis of the effect of centrality on loan spread and omitted correlated variables
Although, as described in section 3.2, I attempt to reduce omitted variable bias by including several firm-, loan- and bank- level control variables, my design does not include an instrument capable of identifying a causal relation. I further address the potential for omitted variable bias in several ways. First, I estimate a modified version of equation 3.5 in which I include lead arranger fixed effects to create a within-lead arranger research design. Lead arranger fixed effects control for all lead arranger level time invariant observable and un-observable characteristics that explain Spread and are correlated with centrality.
Multivariate matching techniques are a second approach frequently used in finance and accounting research to address omitted variable bias (see Roberts and Whited, (2013) for a
10 I repeat my analysis using variations of the control for lead arranger reputation, measured both at the parent Bank Holding
Level as well as at the coarser Lead Arranger level. In all variations, inferences remain unchanged. Specifically, I replace BH Reputation with the market share of the bank holding company (BH MktShare) and with an indicator variable that equals one if the Market Share of the Lead Arranger is greater than 2% in the year prior to the loan origination, based on Bushman and Wittenberg-Moerman, (2012) (LA Reputation). I report the results of these variations in table 5. In addition, in untabulated analysis, I use the linking table provided by Schwert, (2018) to link in financial information of the largest lead bank holding companies in DealScan, for a sub sample that spans until 2012. I use the log of total assets of the lead Bank Holding company as a control variable for reputation and again, inferences remain unchanged.
discussion). While propensity score matching is the main form of multivariate matching used in accounting research, several recent studies indicate that propensity score matching often
exacerbates differences between the individual variables used in the first stage of the propensity score estimation (e.g., Imbens and Rubin, (2015); King and Nielsen, (2016)). On the other hand, entropy balancing uses continuous weights that exactly account for inequalities in the first, second, and possibly higher moments of the co-variate distributions (Hainmueller, (2012)). My use of entropy balancing is complicated by the fact that my treatment variables are not binary. Despite this limitation, I seek to provide additional evidence of the robustness of my inferences. Thus, I create an indicator variable, Hi Centrality that takes the value of one if Centrality is above the sample median in a given year. I then include all the independent variables from Equation 3.5, with the exception of Centrality, as variables in the first-stage that estimates continuous weights to achieve covariate balance.
In addition, to mitigate the possibility that the effect of Centrality on Spread is driven by a few number of extremely large bank holding companies, or by syndicates involving multiple lead arrangers, both of which could be systematically different to the rest of the sample, I re-estimate equation 3.5 for sub-samples that a) exclude loans issued by the top 3 bank holding companies (based on Ross, (2010)), and b) exclude loans with syndicates that involve multiple banks in lead roles.
3.4 The effect of centrality on other non-price loan terms
I test for the effect of Centrality on other non-price loan terms using modified versions of equation 3.5. Specifically, I estimate the following equation:
, 0 1 , 1 2
1, 1,
1,
_ _
_ _
_
i t i t j
j k k l
l m
Loan Feature Centrality Loan Controls
Firm Controls Bank Controls
Fixed Effects
β β β
Loan Feature is equal to either a) the natural logarithm of the loan amount in million USD, LoanAmtLog; b) the natural logarithm of the loan maturity in months, Matlog; c) an indicator variable that takes a value of one if the loan has a financial or a net-worth covenant, DCovenants; and d) an indicator variable that takes a value of one if the loan is secured by collateral, DSecured. All control variables remain the same as those described in the section 3.2 for spread specifications, with the exception that in each case the dependent variable is excluded from the controls (i.e, LoanAmtLog can not be a control when LoanAmtLog is the dependent variable).
Hypothesis 2 predicts β1 is positive in specifications in which LoanAmtLog or MatLog is the dependent variable, and negative in specifications in which DCovenants or DSecured is the dependent variable. These predictions are consistent with more central lead arrangers having access to better information channels that are helpful in mitigating the risks associated with debt contracting, and at least some of these information benefits being shared with borrowers both in the forms of lower spread, as well as with better non-price loan terms. Moreover, showing that non-price loan terms such as LoanAmtLog, MatLog, DCovenants and DSecured, respond to centrality in the same way Spread does, helps mitigate concerns that any price concessions warranted by more central leads are merely substituting for other, more restrictive non-price clauses elsewhere in the loan contract (see Amiram et al., (2017)). If those trade-offs do occur, then the net effect of lead arranger centrality on loan terms becomes uncertain.
3.5 Cross sectional tests - is lead centrality more valuable when borrowers are less transparent and harder to screen?
sources of readily available information, I re-estimate equation 3.5 for sub-samples based on borrower transparency. I consider multiple measures for borrower transparency. The first measure, Low Numest, is based on prior studies that find evidence that analyst produce useful information for debt capital providers (see, for example, (Güntay and Hackbarth, (2010) and Mansi et al., (2011). Low Numest is an indicator variable that equals one when the number of analyst that follow the borrower in the year prior to the loan origination is below the sample median. The second measure, No Rated, is an indicator variable that takes a value of one when the firm’s debt does not have an S&P long term rating in the year prior to loan origination. The third, fourth, and fifth measures: Has Rd, Hi Tech and Big5 are based on prior studies that purport that borrowers with high R&D or in high tech industries are harder to screen (see Chuluun, (2015) and Sufi, (2007)) as well as studies that show that audit quality and accounting quality are priced by lenders (see, for example, Bharath et al., (2008); Chen et al., (2016); Graham et al., (2008); Longstaff et al., (2005); Minnis, (2011), among others). Has Rd is an indicator variable that takes a value of one when the firm reports positive R&D expenses in the year prior to loan origination. Hi Tech, is an indicator variable that takes a value of one when the firm is in a high tech two digit SIC code (I use the classification of high tech industries in
3.6 Cross sectional test: is lead centrality more valuable when the lead is ex-ante relatively less informed?
To test the prediction that the information obtained through networks of past syndicate collaborations is particularly valuable when the lead is ex-ante relatively less informed about the borrower, the industry, or the geography, I re-estimate equation 3.5 for sub-samples based on the lead arrangers prior experience. I consider multiple indicator variables of a leads relative
CHAPTER 4: SAMPLE AND DESCRIPTIVE STATISTICS 4.1 Sample Selection
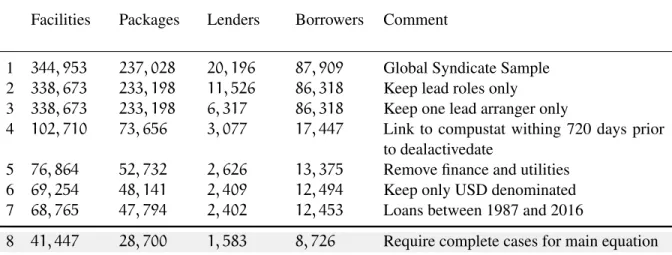
I begin by obtaining all available loan pricing and contract data from DealScan, as well as information on the composition of each loan syndicate (lender names, lender identifiers, lender roles, etc.). The starting sample consists of approximately 345 thousand loans (or facilities), 237 thousand deals, with approximately 20 thousand distinct lenders and 88 thousand distinct
borrowers. I compute measures of lead arranger centrality using this initial sample, which involves approximately 1.9 million loan-lender combinations. See section 3.1 for details on the construction of lead centrality measures. There is no straightforward way of identifying the lead arranger in a loan in cases in which more than one institution has a lead role in the syndicate. I perform sequential filters to identify the lead arranger (largely based in Amiram et al., (2017); Sufi, (2007) and institutional details on the common terminology used to describe syndicate members from Campbell and Weaver, (2013)).12 Borrower accounting information used as control variables and in cross sectional tests are obtained from Compustat North America. I
12 To identify lead arrangers, I first require that loans in my sample have at least one lender in a lead role, that is, at least one
merge Compustat and DealScan using the updated linking table provided by Chava and Roberts through WRDS (Chava and Roberts, (2008)). To be included in the sample, each loan facility observation must have non-missing data from DealScan and Compustat used to construct the primary variables in my analysis for the period 1987 to 2016. Table 2 provides details on the filters applied resulting in the final sample of 41,477 loans (facilities), 28,700 deals (packages) granted to 8,726 distinct borrowers.
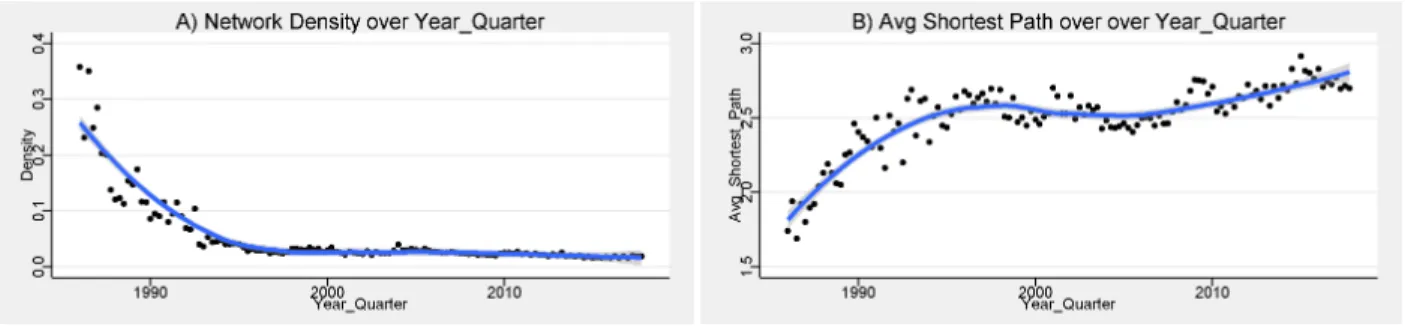
4.2 Description of the evolution of the global network of loan collaborations Figure 2 provides a description of the evolution of the global network of syndicate collaborations from 1987 to 2016. Figure 2 plots the quarterly networks that emerge from collaborations in loan syndicates. Each node is a lending institution and two nodes are linked when they participate in the same syndicate in the quarter. The size of the nodes depicted is proportional to their degree centrality (the number of distinct nodes that connect to the focal node within the quarter). The color of the nodes are based on their modularity class, an estimate of the extent to which nodes in the network are highly connected within a cluster but are sparsely connected with other clusters. Focusing on the 2008Q4 depicted in panel B of Figure 2, it is evident that geographic clusters emerge. The green section on the top of the plot contains mainly North American lending institutions (where banks such as Bank of America and JP Morgan show up as some of the most central players in the cluster). The black section in the bottom of the plot is mostly comprised by South American institutions, with the two largest Spanish banks Banco Santander and BBVA acting as gatekeepers and linking the South American cluster (black) with the European cluster (pink).
isolated lenders, that is, lenders that are not part of the fully connected component of the network, is very small (dark blue portion). It appears that a structural shift occurred in the mid 1990’s, with the number of distinct lending institutions growing considerably (below 500 prior to 1990 but averaging around 1500 since the mid 1990’s). This can be explained by the fact that prior to the mid 1990’s, loan syndicates were comprised mainly of bank-only lenders. In the mid-1990s, non-bank institutional lenders, such as hedge funds, mutual funds, and finance
companies, increased their participation in loan syndicates, largely because the introduction of loan ratings by rating agencies facilitated the syndication process and allowed for portfolio strategies to be applied to the valuation of the loan asset class (Campbell and Weaver, (2013); Nandy and Shao, (2007)). Also worth noting is the sharp drop in lending institutions and subsequent recovery during the global financial crisis around 2008.
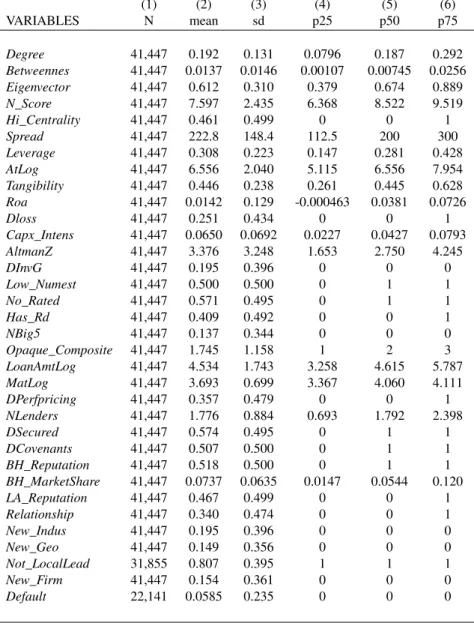
4.3 Descriptive Statistics: primary variables in my analysis
Table 3 presents summary statistics for the sample of 41,447 loans originated between 1987 and 2016 with non-missing information on the variables used for my primary analysis. Panel A presents summary statistics for loan-, firm- and bank- variables relating to all loans in my analysis. The average loan spread is 222.8 bps with a standard deviation of 148.4 bps. The average leverage ratio is 0.308, 43% of the observations have a credit rating, and 19.5% of the 25 observations have investment grade ratings (BBB- or above). 34% of the observations are
CHAPTER 5: EMPIRICAL RESULTS 5.1 The effect of lead centrality on loan spread
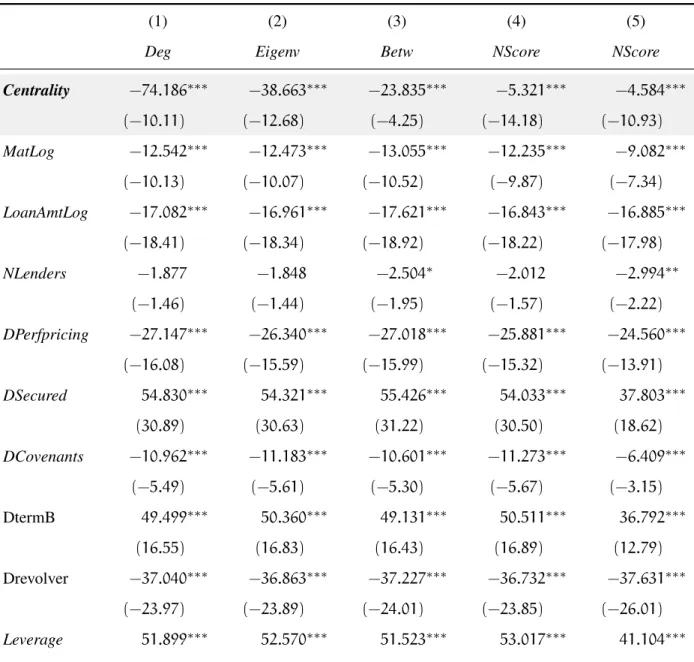
Table (4) presents results of OLS regressions investigating the effect of lead centrality on loan spread, i.e., the estimation of equation 3.5. The dependent variable in columns (1) through (5) is Spread, the interest margin over the LIBOR (London Interbank Offered Rate) for each loan. The main explanatory variable of interest is Centrality. Centrality is measured by Degree in column (1), by Eigenvector in column (2), by Betweenness in column (3), and by the composite measure, NScore, in columns (4) and (5). All specifications include firm-, loan-, and bank- level control variables, as well as industry, loan purpose, year, and Multi Lead arranger fixed effects, with the exception of column
(5), in which industry fixed effects are replaced by firm fixed effects. 13 The key finding in the table (4) regarding hypothesis 1 is that the coefficient on Centrality, β1, is significantly negative in all five estimations, with t-statistics ranging from -4.25 to -14.18. 14. In terms of economic magnitude, a one standard deviation increase in NScore (2.44, see table 3) is associated with between an 11 bps (2.44 × 4.59) and a 13 bps (2.44 × 5.32) decrease in loan spread. This effect is roughly equivalent to that of including a loan covenant in my sample. This
13 For the sake of parsimony I do not tabulate the constant and fixed effects coefficients. Also, while I tabulate the results for the
raw centrality scores in columns (1), (2) and (3) of this table, in subsequent tables I will only discuss the results for the aggregate measure NScore.
14 Throughout, I include *, **, *** next to regression coefficients to indicate significance at the 10%, 5% and 1% level
finding is consistent with lead arrangers in more central positions in the network being able to offer lower loan spreads than lead arrangers with more peripheral positions in the network. 5.2 Robustness of the effect of lead centrality on loan spread
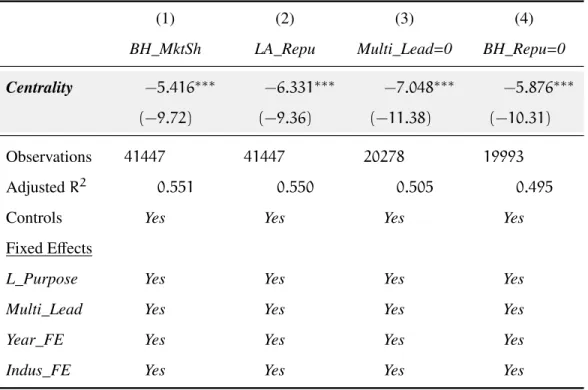
Table (5) presents regression summary statistics for a battery of plausible variations of equation 3.5. All specifications in both panel A and panel B include firm-, loan- and bank- level control variables as well as Loan Purpose, Multi Lead, Year and Industry fixed effects except when otherwise noted below. 15
Panel A Columns (1) and (2) present findings corresponding to versions of equation (3.5) in which I use alternative measures of the reputation of the lead bank holding company.
Specifically, in column (1), I replace BH Reputation which is an indicator variable that equals one if the lead bank holding company is either Bank of America Merrill Lynch, JP Morgan or Citi, or any of their predecessors, based on (Ross, 2010), and include instead the variable BH MktShare, which is the market share of the lead bank holding company computed in the year before the loan origination. The estimated coefficient β1, on Centrality, remains negative and significant (coefficient = -5.42, t-statistic = -9.72). In column (2), I replace BH Reputation with an indicator variable LA Reputation which takes a value of one when the lead arranger has a market share greater than 2% in the year prior to the loan origination, based on Bushman and Wittenberg-Moerman, (2012)). The coefficient β1, on Centrality, remains negative and
significant (coefficient = -6.33, t-statistic = -9.36). In addition, in untabulated analysis, I use the linking table provided by Schwert (2018) to add financial information of the largest lead bank holding companies by participation in DealScan. The linking table contains information for a sub
15 For the sake of parsimony, in this table as well as in subsequent ones, I do not tabulate coefficients on control variables, as well
sample that spans until 2012. I re estimate equation 3.5 but using the natural log of total assets of the lead Bank Holding company, as an alternative control variable for lead arranger reputation and again, the coefficient on Centrality remains significantly negative.
To mitigate the possibility that results are driven by loans with multiple banks in lead roles in the syndicate, Panel A, column (3) estimates equation (3.5) but dropping observations in which Multi Lead is equal to one. Consistent with measurement error being introduced in
Centrality in syndicates with multiple institutions acting in lead roles (because of miss-classification of lead banks), the coefficient on Centrality increases in magnitude and
significance for the sub-sample of loans with only one lead bank (coefficient = -7.05, t-statistic = -11.38)To mitigate the possibility that results are driven by a small number of very large bank holding companies, in column (5), I remove all loans arranged by the largest three bank holding companies (i.e, keep only observations where BH Reputation equals 0). The coefficient on Centrality remains negative and significant (coefficient = -5.88, t-statistic = -10.31). To help reduce concerns of omitted correlated variables at the lead arranger level biasing the explanatory variable of interest, Panel B, column (1) estimates a variation of equation 3.5 that includes lead arranger fixed effects, thus creating a within lead arranger design. The identifying assumption here is that any unobservable bank level confounders are constant over time. The coefficient on Centrality remains negative and significant (coefficient = -3.83, t-statistic = -4.92).
Despite the fact that my treatment variable of interest is not dichotomous, in column (2) of Panel
specification that uses Entropy weights (based on (Hainmueller, 2012)), to achieve co-variate balance between High Centrality observations and Low Centrality observations in all covariates in equation 3.5. The coefficients on Hi Centrality remain negative and significant (coefficient = -9.68, t-statistic = -4.88 in column (2) and coefficient = -8.31, t-statistic = -4.51 in column(3)).
Finally, column (4) in Panel B presents results from estimating a modified version of equation 3.5 only for the sub-sample of observations with a non-missing long term credit rating. In addition, the estimation in column (4) includes a more demanding fixed effects structure than previous specifications. Specifically, I include Industry × Rating × Year fixed effects, creating a within Industry-Year-Rating research design. The coefficient of interest, Centrality, is identified by variation in Centrality for borrowers in the same industry, the same year and the same credit rating. The coefficient on Centrality, albeit smaller, remains negative and significant (coefficient = -3.21, t-statistic=3.44).
Overall, the combined evidence in tables 4 and 5 suggests that lead arrangers in more central positions in the network of past syndicate collaborations are able to offer lower loan spreads than arrangers in more peripheral positions. This findings are consistent with the well-connectedness of the lead arranger being an important factor in the pricing of debt claims, and in support of hypothesis 1, as well as the emphasis placed by practitioners when describing
relationships between banks as fundamental for the success in the syndication business. 5.3 The effect of lead centrality on other, non-price loan terms
specifications (i.e, the same controls as those in table 4), with the exception of the control variable that corresponds to the dependent variable used in each case.
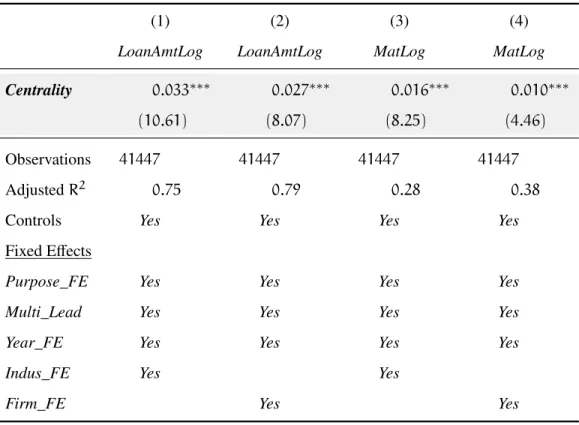
Panel A columns (1) and (2) correspond to specifications that investigate the effect of lead centrality on loan size, LoanAmtLog. Column (1) includes industry fixed effects, whereas column (2) includes firm fixed effects. The key finding in columns (1) and (2) regarding
hypothesis 2 is that the coefficient on Centrality is positive and significant in both specifications (coefficient = 0.033, t-statistic=10.61 in column (1), and coefficient = 0.027, t-statistic=8.07 in column (2)). This findings suggest that arrangers in a more central position in the network of past syndicate collaborations loan in larger amounts than arrangers in more peripheral positions. In terms of economic magnitude, a one unit increase in NScore is associated with between a 3.3% and a 2.7% increase in the loan size.
Panel A columns (3) and (4) correspond to specifications that investigate the effect of lead centrality on loan maturity, MatLog. Column (3) includes industry fixed effects, whereas column (4) includes firm fixed effects. The key finding in columns (3) and (4) regarding
hypothesis 2 is that the coefficient on Centrality is positive and significant in both specifications (coefficient = 0.016, t-statistic=8.25 in column (3), and coefficient = 0.01 t-statistic = 4.46 in column (4)). This suggests that holding other covariates constant, more central leads are able to grant loans with larger maturities than peripheral leads. In terms of economic magnitude, a one unit increase in Centrality is associated with between a 1% and a 1.7% increase in the loan maturity.
effects. The key finding in columns (1) and (2) regarding hypothesis 2 is that the coefficient on Centrality is negative and significant in both specifications (coefficient = -0.006, t-statistic=-4.53 in column (3), and coefficient = -0.006, t-statistic=-3.97 in column (4)). This findings suggest that arrangers in a more central position in the network of past syndicate collaborations loan with fewer covenants than arrangers in more peripheral positions. In terms of economic magnitude, a one unit increase in NScore is associated with a 0.6% decrease in the probability of the loan containing a Covenant. Untabulated findings show that using HI CENT, an indicator variable that takes a value of one when NScore is above the mean in every year, leads to a 3.1% reduction in the probability of the loan having a covenant (t-statistic = -5.28).
Panel B columns (3) and (4) correspond to specifications that investigate the effect of lead centrality on the probability that the loan is secured, DSecured. Column (3) includes industry fixed effects, whereas column (4) includes firm fixed effects. The key finding in columns (3) and (4) regarding hypothesis 2 is that the coefficient on Centrality is negative and significant in both specifications (coefficient = -0.011, t-statistic=-8.67 in column (3), and coefficient = -0.008, t-statistic=-5.07 in column (4)). This findings suggest that arrangers in a more central position in the network of past syndicate collaborations loan with fewer incidence of collateral requirements than arrangers in more peripheral positions. In terms of economic magnitude, a one unit increase in NScore is associated with between a 1.1% and a 0.8% decrease in the probability that the loan is secured.
Overall, the evidence in table 3.6 suggests that lead arrangers in more central positions in the network of past syndicate collaborations are able to offer better non-price terms than
well-connectednesss of the lead arranger being an important factor, not only for the pricing of debt claims, and in support of hypothesis 1, but also for non-price loan terms.
5.4 The effect of lead centrality on spread - conditional on borrower transparency In this subsection, I present results from cross-sectional tests to determine if the effect of lead centrality on spread varies when the borrower is relatively less transparent and is harder to screen. Hypothesis 3 predicts that the value of lead centrality increases when the borrower is opaque. I use five measures of borrower transparency and, in each case, table 7 reports summary statistics for the estimation of equation 3.5 for the sub-samples of transparent and opaque
borrowers, respectively.
Panel A Columns (1) and (2) correspond to sub-sample estimations based on the variable Lo Numest. The key finding in columns (1) and (2) is that the coefficient on Centrality is
significantly higher in the opaque sub-sample with a low number of analyst following
(coefficient = -3.29 in the high analyst sub-sample versus coefficient=-6.02 for the low analyst sub-sample, with a χ2
statistic for a test of sub-sample difference in coefficients = 15.83, p-value = 0.000)
Panel A Columns (3) and (4) correspond to sub-sample estimations based on whether the borrowing firm has a long term rating in the year prior to the loan origination. Firms without a credit rating are considered opaque. The key finding in columns (3) and (4) is that the coefficient on Centrality is significantly higher in the opaque sub-sample without a credit rating (coefficient = -3.06 in the rated sub-sample versus coefficient=-6.14 in the non-rated , with aχ2
statistic for a test of sub-sample difference in coefficients = 15.24, p-value =0.000)