Weight Gain Trajectories Associated With Elevated C-Reactive Protein
Levels in Chinese Adults
Amanda L. Thompson, PhD, MPH; Elizabeth Koehler, MS; Amy H. Herring, ScD; Lauren Paynter, MPH; Shufa Du, PhD; Bing Zhang, PhD; Barry Popkin, PhD; Penny Gordon-Larsen, PhD
Background-—Recent longitudinal work suggests that weight change is an important risk factor for inflammation across the full range of BMI. However, few studies have examined whether the risk of inflammation differs by patterns of weight gain over time. Using latent class trajectory analysis, we test whether patterns of weight gain are associated with elevated high-sensitivity C-reactive protein (hs-CRP 2–10 mg/L).
Methods and Results-—Data come from China Health and Nutrition Survey (CHNS) participants (n=5536), aged 18 at baseline to 66 years in 2009, with measured weight over 18 years. Latent class trajectory analysis was used to identify weight-change trajectories in 6 age and sex strata. Multivariable general linear mixed-effects modelsfit with a logit link were used to assess the risk of elevated hs-CRP across weight trajectory classes. Models werefit within age and sex strata, controlling for baseline weight, adult height, and smoking, and included random intercepts to account for community-level correlation. Steeper weight-gain trajectories were associated with greater risk of elevated hs-CRP compared to more moderate weight-gain trajectories in men and women. Initially high weight gain followed by weight loss was associated with lower risk of elevated hs-CRP in women aged 18 to 40.
Conclusions-—Latent class trajectory analysis identified heterogeneity in adult weight change associated with differential risk of inflammation independently of baseline weight and smoking. These results suggest that trajectories of weight gain are an important clinical concern and may identify those at risk for inflammation and the development of cardiometabolic disease. (J Am
Heart Assoc. 2016;5:e003262 doi: 10.1161/JAHA.116.003262)
Key Words: inflammation•latent-class trajectory analysis•obesity•weight gain
I
ncreasing evidence establishes chronic, low-grade infl am-mation as an important risk factor for the development of cardiometabolic disease.1–5 Elevations in C-reactive protein (CRP), an acute-phase protein commonly used as a marker of systemic inflammation, predict mortality from all causes of heart disease1 and are associated with components of the metabolic syndrome including high blood pressure, elevatedfasting glucose, insulin resistance, and impairedfibrinolysis.3 Overweight and obesity appear to be major drivers of inflammation, with a number of recent studies demonstrating a strong association between BMI category and CRP levels.6,7 Similar associations have been seen across samples and ethnic groups7–10 and may reflect the production of proin-flammatory cytokines stimulating CRP production11,12
by adipose, and particularly visceral adipose, tissue.13–15
The bulk of the literature on the association between inflammation and obesity has been cross-sectional, but recent longitudinal work suggests that weight gain is an important risk factor for elevations in CRP across all BMI classes. CRP increased linearly with weight over approximately a decade of follow-up in middle-aged American6and British adults,16with a somewhat stronger effect seen in those already overweight or obese at baseline.6Similarly, the prevalence of elevated CRP was highest among women gaining the greatest amounts of weight compared to women maintaining their weight or gaining fewer kilograms across 20 to 40 years, measured retrospec-tively.17,18 Conversely, weight loss has been associated with reduced CRP levels across a range of weights, interventions (diet, physical activity, surgery, etc), and lengths of follow-up.19,20However, these studies have generally been limited to 2
From the Departments of Biostatistics (E.K., A.H.H.) and Nutrition (A.L.T., L.P., S.D., B.P., P.G.-L.), Gillings School of Global Public Health, and Carolina Population Center (A.L.T., A.H.H., S.D., B.P., P.G.-L.) and Department of Anthropology (A.L.T.), University of North Carolina at Chapel Hill, Chapel Hill, NC; National Institute for Nutrition and Health, China Center for Disease Control, Beijing, China (B.Z.).
Accompanying Tables S1 and S2 and Figures S1 through S3 are available at http://jaha.ahajournals.org/content/5/9/e003262/DC1/embed/inline-supplementary-material-1.pdf
Correspondence to:Amanda L. Thompson, PhD, MPH, 137 East Franklin St., CB#8120, Chapel Hill, NC 27515. E-mail: [email protected] Received February 23, 2016; accepted July 14, 2016.
measures of weight due to short periods of follow-up8,21 or reliance on self-reported weight from earlier in the lifecy-cle17,18,22and have not been able to examine the pattern of weight gain as a risk factor for inflammation. Yet, weight-gain trajectory may play an important role in determining risk of inflammation because weight-gain trajectories have been associated with other cardiometabolic risk factors including obesity23,24 and markers of insulin resistance.25,26 Under-standing whether different patterns of weight gain—early onset maintained over the lifecycle or recent rapid gains, for instance —predict inflammation is important for understanding the etiology of inflammation with weight change, identifying groups at particularly high risk, and shaping prevention strategies.
Previous research on weight gain and inflammation has generally been limited to high-income Western countries; however, the rapid emergence of obesity and its comorbidities in developing countries may provide a critical context for understanding the impact of heterogeneity in patterns of weight gain on cardiometabolic risk. Thus, we take advantage of repeated measures of weight collected over 2 decades in 5536 adult participants (aged 18–66 years) in the China Health and Nutrition Survey27 to examine how patterns of weight gain shape current inflammation. We use latent class trajectory analysis (LCTA) to generate empirically derived weight-change trajectories across sex and age strata and test whether these trajectories are associated with the differential risk of elevated hs-CRP (2–10 mg/L).
Materials and Methods
The China Health and Nutrition Survey
The China Health and Nutrition Survey (CHNS) collected health data in 228 communities across 9 diverse provinces (Guangxi, Guizhou, Heilongjiang, Henan, Hubei, Hunan, Jiangsu, Liaoning, and Shandong). Survey procedures have been described elsewhere.27 Briefly, counties in the 9 provinces were stratified by income. Multistage random cluster sampling was used to select 4 counties in each province. Villages and small towns within counties and urban and suburban neighborhoods within cities were selected randomly into primary sampling units that were politically and geographically classified based on State Statistical Office definitions. The surveyed provinces represent 56% of the Chinese population. Eight rounds of surveys were conducted from 1989 to 2009, and fasting blood wasfirst collected in the 2009 survey. This study protocol and the analysis were approved by the Institutional Review Board at the University of North Carolina at Chapel Hill, the China-Japan Friendship Hospital, Ministry of Health of China, and Institute of Nutrition and Food Safety, China Centers for Disease Control. Subjects gave informed consent for participation.
Analysis Sample
The analytic sample includes adult men and nonpregnant women with measured hs-CRP at the 2009 exam, between the ages of 18 at the baseline exam and <66 years at the 2009 exam, with at least 2 repeat anthropometric measures and with hs-CRP≤10 mg/L, an accepted indicator of current infection.4 A total of 8149 adults had measured biomarkers and were <66 years of age at the 2009 exam. Of these, 6470 had at least 2 weight measures and could be assigned to a weight trajectory, 6457 were not currently pregnant, and 5536 had CRP ≤10 mg/L. The majority of the sample (56%) had 5 or more repeated weight measures (range 2–7), yielding a final sample of 5536 participants with 26 118 observations. Final age, baseline weight, average adult height, urbanization, and smoking differed significantly between the total adult and analytic sample in 2009 (Table S1). Those excluded tended to be younger, more urban, and less likely to smoke.
Measures
High-Sensitivity C-Reactive Protein
Blood (12 mL) was collected by venipuncture after an overnight fast. Whole blood was immediately centrifuged, and plasma and serum samples were frozen and stored for analysis. The hs-CRP was measured using the immunoturbid-metric method (Hitachi 7600 automated analyzer, Hitachi, Tokyo, Japan) with Denka Seike (Tokyo, Japan) reagents. All samples were processed in a national lab in Beijing, awarded a medical laboratory accreditation certificate (ISO 15189:2007). Values of>2 mg/L were considered indicative of inflammation because values above this cut point are associated with high risk of future cardiovascular events4,5 and have been previously used in Asian samples.10
Anthropometry
Weight and height were collected by 2 trained health workers using standard protocols. Weight was measured without shoes and in light clothing to the nearest 0.1 kg on a calibrated beam scale. Height was measured without shoes to the nearest 0.2 cm using a portable SECA stadiometer and averaged across all repeated measures for analyses. BMI was calculated as kg/m2.
Latent Class Trajectories
Weight-change trajectories were identified using latent class trajectory analysis (LTCA), a method that has been used to identify otherwise unobserved trajectory classes in epidemi-ological data.28LCTA has the advantage of identifying distinct groups with similar underlying trajectories.29–31 These
N
AL
RESE
trajectories can vary in functional form across a number of different order polynomials, allowing the best-fitting polyno-mial form to be specified for each trajectory separately. This property may be particularly important in our sample given the differential age-related patterns of weight gain observed over the past 20 years in China.32The procedure used to derive the trajectories is more fully described elsewhere.33 Briefly, LCTA was conducted using SAS version 9.2 (SAS Institute, Cary, NC) with the TRAJ procedure.34,35 We modeled weight change, calculated as current weight minus baseline weight, over time for 6 sex and age subgroups corresponding to the following baseline age categories: 18 to<30, 30 to<40, and 40 to<66 (with a maximum age of 66 at the 2009 visit). All trajectories for the individual sex and age strata were assumed to follow the same order polynomial, with different models fit for linear, quadratic, cubic, and fifth-order polyno-mials. The best-fit models were chosen based on (1) lowest Bayesian information criteria (BIC) and (2) each trajectory containing at least 2% predicted sample size. Because these trajectories are empirically derived, the number of resulting trajectories is expected to vary between sex and age strata if underlying patterns differ across sex and age. Once weight gain trajectories were determined, individuals were assigned to the class with the highest posterior probability.29Trajectory membership was then treated as an indicator variable in the current analyses.
Demographic and Clinical Variables
Demographic variables included income, urbanization, and smoking measured as ever/never and number of cigarettes smoked per day. Income was derived from total household income and measured in yuan.36Urbanicity was defined using a multidimensional 12-component urbanization index captur-ing community-level physical, social, cultural, and economic environments.37To more fully describe the clinical history of the sample, we include descriptive data on medical history of hypertension or diabetes mellitus and laboratory data assess-ing lipid profiles, glucose levels, renal function, and liver function. Because clinical diagnoses are less common in China, we defined as hypertensive individuals with a diagnosis of hypertension or currently taking antihypertensive medica-tion or a mean systolic blood pressure ≥140 mm Hg or diastolic blood pressure ≥90 mm Hg. Similarly, we defined individuals as diabetic if they had been diagnosed with diabetes mellitus, were taking insulin or other medications, or had a fasting blood glucose level≥7 nmol/L. Cardiometabolic biomarkers including low-density lipoprotein (LDL), high-density lipoprotein (HDL), triglycerides (TG), total cholesterol (TC), glucose, creatinine (CRE), and alanine aminotransferase (ALT) have been previously described in detail for this sample38,39 and are presented to provide context only.
Statistical Analyses
Analyses were done in R version 2.13 statistical software (R Development Core Team, Vienna, Austria) using the SAS-defined weight gain trajectory classes. Demographic variables are summarized across age and sex strata with percentages for categorical variables and with the median and 25th and 75th percentiles for continuous variables. The odds of elevated hs-CRP were compared across weight-trajectory classes within age and sex strata in multivariable general linear mixed-effects modelsfit with a logit link with covariates corresponding to measures that were determined a priori to be of interest: baseline weight (included as a quadratic term), height (averaged across all repeated measures), and, for men, smoker status (ever/never) and current number of cigarettes. Random intercepts were included to account for potential community-level correlation. Models were structured similarly across all age and sex groups, although smoking variables were not included in models for women given their low prevalence of smoking (3.3%). We tested whether the effect of weight-gain trajectories was moderated by their relationship with weight by testing for significant interaction effects (P<0.05) between baseline weight (measured linearly) and trajectory group with a likelihood ratio test. The combination of baseline weight by trajectory effectively describes individ-ual weight in 2009. No interaction terms were significant at theP<0.05 level, and thus, no interaction terms were retained in thefinal models.
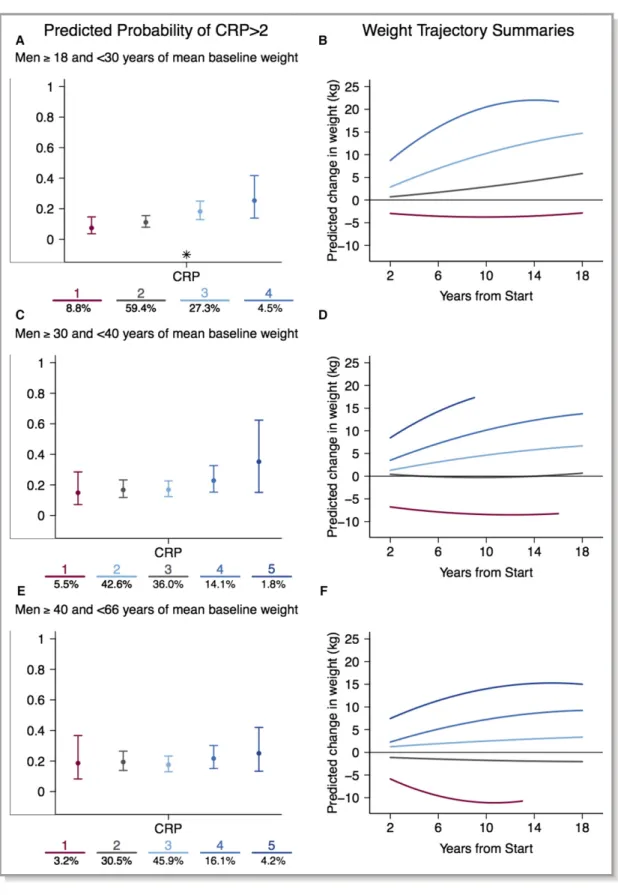
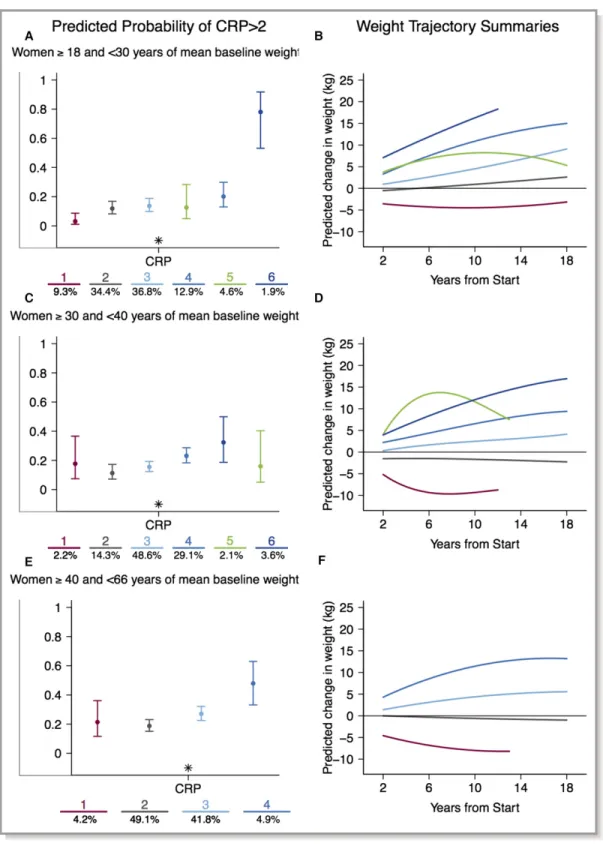
Expected percentage with elevated hs-CRP with 95% confidence intervals is presented for each trajectory across age and sex strata for never smokers along with the sex-specific mean baseline weight (men 61 kg, women 54 kg) and the sex-specific mean average adult height (men 167 cm, women 156 cm), living in an average community. For ease of interpretation, trajectories characterized by weight gain are presented in blue, stable trajectories in gray, and weight-loss trajectories in maroon. For each model an overall test for weight trajectories was performed; statistically significant differences in risk of elevated hs-CRP for each given weight-class trajectory are indicated with asterisks. For models where this overall test was significant, pairwise comparisons between groups were also conducted.
Sensitivity analysis was conducted excluding individuals (n=210) who were currently taking medications identified as having anti-inflammatory properties,40including statins, anti-coagulants, antibiotics, cancer treatment, glucocorticoids, sex hormones, nonsteroidal anti-inflammatories, and aspirin. Finally, we conducted a simulation study to test the stability of the ranking of the risk of elevated hs-CRP by trajectory group. Ranks were assigned to the groups by their associated probability of elevated hs-CRP, with a rank of 1 given to the trajectory class with the highest probability. Ranks were
N
AL
RESE
recorded for each group, and this process was repeated 10 000 times to determine the frequency of each ranking for each trajectory class.
Results
Subject Characteristics
Overall median age was 48.8 years, ranging from 21 to 66 in 2009 (Table 1). Median duration of follow-up was 12 years, ranging from 9 to 18 (Table 1; further information on baseline year for each age-sex stratum is presented in Table S2). Median baseline weight, 60 kg for men and 53.3 kg for women, was higher in the older relative to the younger age groups, whereas median adult height, 167.0 cm for men and 156.6 cm for women, was lower in the older age groups. Among women, urbanicity and proportion of ever smokers were higher, and household income lower, in the older age groups. The prevalence of elevated hs-CRP was higher in the older age groups for both sexes (Table 2). The prevalence of hypertension and diabetes mellitus and most cardiometabolic biomarkers increased with age with the exception of HDL and ALT, which declined with age, and creatinine, which remained relatively constant.
Weight Trajectories and hs-CRP
In men aged 18 to<30 at baseline (Figure 1A and 1B), the risk of elevated hs-CRP significantly varied across trajectory classes (P=0.001; Table 3), despite some overlap in confi -dence intervals. Pairwise comparisons indicated that the risk of elevated hs-CRP is highest in the trajectory groups with steepest weight change (groups 3 and 4) relative to the initial weight loss group (group 1) and the group with stable, lower weight gain (group 2). Similar patterns were observed in men aged 30 to <40 and 40 to 66 at baseline: those with the steepest weight-change trajectories have the highest risk of elevated hs-CRP (Figure 1C through 1F). However, these patterns were not statistically significant in the 2 older age strata.
Across age strata in women, those with the steepest weight-change trajectories had the greatest risk of elevated hs-CRP despite some overlap in confidence intervals (Fig-ure 2A through 2F). In women aged 18 to <30 at baseline (Figure 2A and 2B), the risk of elevated hs-CRP is significantly higher in the steeper weight-gain trajectories (groups 4 and 6) compared to the maintenance group (group 2) and is highest in the steepest weight-gain trajectory (group 6) relative to all other groups (Table 3). Compared to those groups with high weight gain that continue to gain weight (groups 4 and 6), the group with high early weight gain and subsequent loss (group 5) has a significantly lower risk of elevated hs-CRP. Table
These patterns are repeated in women aged 30 to<40 and 40 to 66, with the steepest weight-change trajectories (groups 4 and 6 and groups 3 and 4, respectively) having the highest risk of elevated hs-CRP (Figure 2C through 2F) compared to the maintenance referent group (Group 2). Similarly, in the 30- to <40-year-old strata, the high initial weight-gain and subsequent weight-loss group (group 5) had lower risk of elevated hs-CRP than the high weight gain groups (groups 4 and 6).
Sensitivity Testing and Model Simulation
Sensitivity analysis excluding 210 individuals who reported taking medications with anti-inflammatory properties (Figures S1 and S2) revealed no strong differences in point estimates or confidence intervals from our main analyses. Results from our simulation study examining the relative ranking of trajectories for risk of elevated CRP across 10 000 model runs are shown in Figure S3. Groups with the highest risk of elevated CRP are labeled with rank 1, and the colored bands show the stability of the ranking of the groups. For example, for women with baseline age 18 to<30, the group with the highest weight trajectory (group 6) always has the highest risk of inflammation, the group with initial weight loss (group 1) always has the lowest risk, and the groups with more intermediate gains have tended to be classified in their central positions. Results for the younger male strata were even more consistent, with groups retaining their relative ranking in the majority of cases in each simulation.
Discussion
Our empirically derived weight-gain trajectories, measured over 18 years in a longitudinal sample of adults from the China Health and Nutrition Survey, identified patterns of weight change across age and sex strata that were differentially predictive of elevated hs-CRP levels. Steeper weight-gain trajectories were associated with elevated risk of inflammation and weight loss associated with lower risk of inflammation compared to more moderate weight gain trajectories, even after adjustment for initial weight, height, and smoking behaviors.
Across sex and age strata, we found that those with higher, steeper weight gains were more likely to have elevated hs-CRP regardless of initial weight. These results are similar to other longitudinal studies of weight change and inflammation, which have found that individuals with the highest weight gain over follow-up have the greatest odds of elevated CRP.17,18,41 In addition to these similarities with the published literature, we also identified unique classes of weight change associated with risk of inflammation. Among men aged 18 to 30 at baseline, risk of elevated hs-CRP was similar in those who gained weight more recently and rapidly (group 3) compared
Figure 1. The probability of elevated hs-CRP (A, C, and E) by weight-change trajectory (B, D, and F) across 3 age
strata in men: (A and B) 18 to 29 years; (C and D) 30 to 39 years; (E and F) 40 to 66 years. Expected percentage (95%
confidence interval) with elevated hs-CRP are presented from left to right corresponding to the relative level of weight
change in the color-matched trajectory. For ease of interpretation, trajectories characterized by weight gain are presented in blue, stable trajectories in gray, and weight-loss trajectories in maroon. The number of participants in
each class is presented at the bottom of eachfigure. The trajectory numbers under graphs in A, C, and E correspond to
the similarly colored trajectories in B, D, and F, respectively. Significant effects of the trajectories are indicated with an
asterisk. CRP indicates C-reactive protein; hs-CRP, high-sensitivity C-reactive protein.
N
AL
RESE
to those with the highest levels of weight gain (group 4) despite overall gains andfinal weights that were 8 to 10 kg lower. It has previously been proposed that more rapid weight gain may produce greater inflammation in the adipose tissue,17 an interpretation supported by rodent models showing that rapid-onset, high-fat, high-sugar diet-induced obesity leads to a dramatic increase in proinflammatory
macrophages42 and the rapid expression of infl ammation-related genes43 in adipose tissue. Our results provide preliminary evidence that rapid weight gain may place individuals at greater risk for inflammation and contrast those results recently described for US adults, in whom the severity of obesity, rather than its duration, was associated with elevated cardiometabolic risk.22
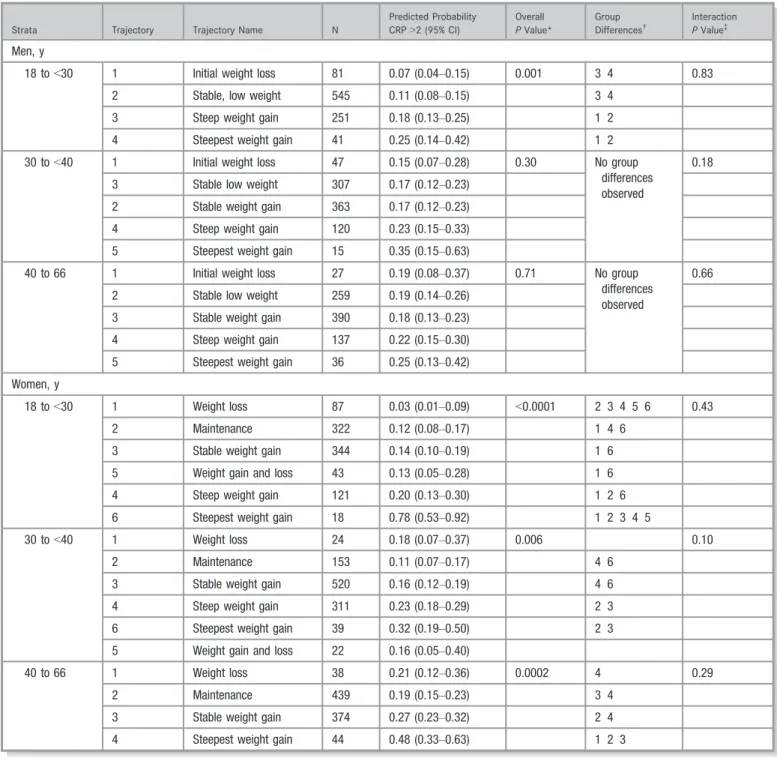
Table 3. Intertrajectory Differences in Probability of Elevated hs-CRP (2–10 mg/L)
Strata Trajectory Trajectory Name N
Predicted Probability CRP>2 (95% CI)
Overall
PValue*
Group Differences†
Interaction
PValue‡
Men, y
18 to<30 1 Initial weight loss 81 0.07 (0.04–0.15) 0.001 3 4 0.83
2 Stable, low weight 545 0.11 (0.08–0.15) 3 4
3 Steep weight gain 251 0.18 (0.13–0.25) 1 2
4 Steepest weight gain 41 0.25 (0.14–0.42) 1 2
30 to<40 1 Initial weight loss 47 0.15 (0.07–0.28) 0.30 No group differences observed
0.18
3 Stable low weight 307 0.17 (0.12–0.23)
2 Stable weight gain 363 0.17 (0.12–0.23)
4 Steep weight gain 120 0.23 (0.15–0.33)
5 Steepest weight gain 15 0.35 (0.15–0.63)
40 to 66 1 Initial weight loss 27 0.19 (0.08–0.37) 0.71 No group differences observed
0.66
2 Stable low weight 259 0.19 (0.14–0.26)
3 Stable weight gain 390 0.18 (0.13–0.23)
4 Steep weight gain 137 0.22 (0.15–0.30)
5 Steepest weight gain 36 0.25 (0.13–0.42)
Women, y
18 to<30 1 Weight loss 87 0.03 (0.01–0.09) <0.0001 2 3 4 5 6 0.43
2 Maintenance 322 0.12 (0.08–0.17) 1 4 6
3 Stable weight gain 344 0.14 (0.10–0.19) 1 6
5 Weight gain and loss 43 0.13 (0.05–0.28) 1 6
4 Steep weight gain 121 0.20 (0.13–0.30) 1 2 6
6 Steepest weight gain 18 0.78 (0.53–0.92) 1 2 3 4 5
30 to<40 1 Weight loss 24 0.18 (0.07–0.37) 0.006 0.10
2 Maintenance 153 0.11 (0.07–0.17) 4 6
3 Stable weight gain 520 0.16 (0.12–0.19) 4 6
4 Steep weight gain 311 0.23 (0.18–0.29) 2 3
6 Steepest weight gain 39 0.32 (0.19–0.50) 2 3
5 Weight gain and loss 22 0.16 (0.05–0.40)
40 to 66 1 Weight loss 38 0.21 (0.12–0.36) 0.0002 4 0.29
2 Maintenance 439 0.19 (0.15–0.23) 3 4
3 Stable weight gain 374 0.27 (0.23–0.32) 2 4
4 Steepest weight gain 44 0.48 (0.33–0.63) 1 2 3
*Overall test of trajectory significance in full models adjusted for baseline weight (quadratic), height (averaged across repeated measures), smoker status (ever/never) and current number of cigarettes (both for men only), and a random intercept for community.
†Numbers indicate groups that were significantly different in pairwise comparison tests. For example, for men aged 18 to 30, group 1 differed significantly from groups 3 and 4. ‡Likelihood ratio test for interaction effects between baseline weight (measured linearly).
N
AL
RESE
Figure 2. The probability of elevated hs-CRP (A, C, and E) by weight-change trajectory (B, D, and F) across 3 age strata in women: (A and B) 18 to 29 years; (C and D) 30 to 39 years; (E and F) 40 to 66 years. Expected
percentages (95% confidence interval) with elevated hs-CRP are presented from left to right corresponding to
the relative level of weight change in the color-matched trajectory. For ease of interpretation, trajectories characterized by weight gain are presented in blue, stable trajectories in gray, and weight-loss trajectories in
maroon. The number of participants in each class is presented at the bottom of eachfigure. The trajectory
numbers under graphs in A, C, and E correspond to the similarly colored trajectories infigures B, D, and F,
respectively. Significant effects of the trajectories are indicated with an asterisk. CRP indicates Creactive
protein; hs-CRP, high-sensitivity C-reactive protein.
N
AL
RESE
Despite similar weight-gain trajectories across age strata for men, and in contrast to the significant results across all age strata in women, we did not find a significant association between weight-gain trajectories and risk of inflammation in men in the 2 older age strata (30 to <40 and 40–66 years). These results suggest that, for men, steeper weight gains at younger ages may be riskier for the development of infl amma-tion than weight gain at older ages. This associaamma-tion between weight gain and inflammation in younger, but not older, men may reflect a cohort-related difference in the composition of excess weight gain. Recent studies document that waist circumference has increased disproportionally to body mass in Chinese men over the past 15 years.44,45Thus, the weight gain seen in our younger male age strata may reflect greater visceral fat gain, with a concurrent risk for increased inflammation.46 Alternatively, the lack of association between patterns of weight gain and inflammation in the 2 older age strata may reflect the“proinflammatory state”previously seen with aging in men due to their higher prevalence of cardiovascular risk factors and morbidity.47In the CHNS sample, inflammation and comorbidities, such as hypertension, hyperlipidemia, and diabetes mellitus all increase with age,38,39,48 potentially attenuating the association between weight gain and infl am-mation in these men.38,39
We also found a relatively small, distinct group of women in the 18 to<30 and 30 to<40 age strata with initially high weight gain and subsequent loss (group 5). Despite initial weight gains that were similar to or higher than those of the highest gainers, these women had significantly reduced risk of elevated hs-CRP in 2009 compared to those whose weight continued to increase over time. A number of studies have found that CRP declines with weight loss,19and these results, along with thefinding of lower risk of hs-CRP among men aged 18 to 30 with weight loss (group 1), indicate that weight loss is beneficial independently of initial weight and early weight gain. Further, these results are similar to those from the Coronary Artery Risk Development in Young Adults (CARDIA) study.49 In 15 years of follow-up, CARDIA participants with stable or decreased BMI had markedly lower incidence of metabolic syndrome in middle age and correspondingly stable or“minimally adverse”changes in component risk factors.49Ourfinding that hs-CRP declines with weight loss even in groups with high initial gain across age strata in women suggests that adverse effects of weight gain on cardiometabolic risk are not immutable, even at older ages.
Taken together, thesefindings that the association between weight gain and inflammation varies across age strata in men and that a weight-gain and weight-loss trajectory associated with lower CRP is seen only in women, point to significant sex differences in the association between weight gain and inflammation in this sample. Sex differences in the association between weight gain and inflammation have been previously documented50and have been attributed to differing amounts
and distribution of adipose tissue in men and women. Adiposity is more closely associated with inflammation in women than un men in a number of studies,50–52even when one is controlling for metabolic characteristics and exogenous hormone use.53 The mechanism underlying these differences is not well understood but has been proposed to be linked to leptin, which varies with fat mass, plays an important role in regulating the innate immune response, and is significantly correlated with CRP in women but not men.54
No previous studies have utilized LCTA to identify risk for inflammation or how this risk may differ between men and women. However, several studies have incorporated latent trajectory methods to identify heterogeneity in the develop-ment of body fatness and obesity across the life course,23,55–
58or used latent trajectory models to identify weight and BMI
trajectories associated with cardiometabolic risk fac-tors.25,55,58Similarly to ourfindings that steeper weight-gain trajectories are associated with elevated risk of inflammation, increasing weight/BMI trajectories were associated with negative cardiometabolic outcomes despite differences in sample ages, ethnicities, and lengths of follow-up. Among middle-aged participants in the Amsterdam Growth and Health Longitudinal Study, for example, membership in the
“progressively overweight” BMI trajectory, measured from adolescence into adulthood, was associated with higher arterial pressure and lower HDL cholesterol at age 42.55 Similarly, middle-aged participants in the National Longitudi-nal Survey of Youth 1979 Cohort with higher BMI trajectories from ages 18 to 49 had elevated risk of adverse health outcomes, measured through a self-rated health survey, at age 40.58These studies provide support for ourfindings that the pattern and timing of weight gain are important risk factors for inflammation and for the utility of LCTA in describing clinically relevant patterns of weight gain.
Similar conclusions may have been drawn from models incorporating individual intercepts and slopes for those with steady weight gain; however, LCTA identified unique, easy-to-interpret classes—recent, rapid weight gain and steep weight gain—that may facilitate public health intervention. Along with these strengths, our study has several important limitations. Despite our overall large study sample size, the number of individuals in some trajectories was quite small, limiting our ability to detect significant differences in risk between groups. However, the smallest groups, the initial weight loss and most rapid weight gain groups, are clinically relevant, biologically plausible, and relatively consistent in predicting the risk of elevated hs-CRP in our simulation study. The analytic sample differed from the overall study sample in a number of characteristics that could potentially influence patterns of weight gain and risk of inflammation. Those excluded from analysis due to lack of biomarker measures or shorter length of participation in the study tended to be younger, more urban, and
N
AL
RESE
less likely to smoke. Despite the wealth of longitudinally measured weight and lifestyle variables over 18 years in multiple age groups, biomarkers were collected for thefirst time in 2009, and hs-CRP was the only measured inflammatory biomarker. The use of a single inflammatory biomarker limits our ability to more fully describe the pathways linking weight gain and inflammation. This single hs-CRP measure also limits our ability to distinguish whether elevated hs-CRP is a consequence or cause of weight gain, an ongoing debate in the literature.59,60Nonetheless, our consistentfinding across age and sex strata that different patterns of weight gain (rapid, recent gain vs slow and steady) are associated with differential risk of inflammation independently of weight lends preliminary support to the more common assertion that CRP is a consequence of increased adiposity. The use of a cut point for elevated hs-CRP does not fully capture the range of association between weight gain and inflammation across the full range of hs-CRP levels; however, the use of this dichoto-mous measure is important for identifying cardiometabolic disease risk, excluding those with infectious disease symptoms, and for establishing the clinical relevance of patterns of weight change.
Using LCTA, we have identified distinct empirically derived patterns of weight change in a sample of Chinese adults and have shown that these differing trajectories of weight change measured across 18 years are associated with inflammation risk across sex and age strata. Over one-third of individuals in the sample belonged to the groups with high weight gain and increased risk of inflammation. This risk of inflammation associated with steep rates of weight gain was independent of baseline weight and smoking status, suggesting that even after controlling for weight, trajectories of weight gain are highly informative about risk status. As individuals continue to transition to Western diets and reduced physical activity, weight gain patterns may become even more important for identifying those at risk for inflammation and the development of cardiometabolic disease.
Sources of Funding
This work was supported by NIH R01HL108427,
R21DK089306, and R01DK104371. The CHNS is funded by NIH: NICHD (R01-HD30880), although no direct support was received in the form of a grant for this analysis. Thompson is supported by NIH: NICHD (K01 HD071948-01). We also are grateful to the Carolina Population Center (R24 HD050924) for general support.
Disclosures
None.References
1. Kaptoge S, Di Angelantonio E, Lowe G, Pepys MB, Thompson SG, Collins R, Danesh J. C-reactive protein concentration and risk of coronary heart disease, stroke, and mortality: an individual participant meta-analysis. Lancet. 2010;375:132–140.
2. Ridker P, Rifai N, Koenig W, Blumenthal RS. C-reactive protein and cardiovascular risk in the Framingham Study. Arch Intern Med. 2006;166:1327–1328; author reply 1328
3. Ridker PM, Buring JE, Cook NR, Rifai N. C-reactive protein, the metabolic syndrome, and risk of incident cardiovascular events: an 8-year follow-up of 14 719 initially healthy American women.Circulation. 2003;107:391–397. 4. Pearson TA, Mensah GA, Hong Y, Smith SC Jr. CDC/AHA workshop on
markers of inflammation and cardiovascular disease: application to clinical and public health practice: overview.Circulation. 2004;110:e543–e544. 5. Buckley DI, Fu R, Freeman M, Rogers K, Helfand M. C-reactive protein as a
risk factor for coronary heart disease: a systematic review and meta-analyses for the U.S. Preventive Services Task Force. Ann Intern Med. 2009;151:483–495.
6. Fransson EI, Batty GD, Tabak AG, Brunner EJ, Kumari M, Shipley MJ, Singh-Manoux A, Kivimaki M. Association between change in body composition and change in inflammatory markers: an 11-year follow-up in the Whitehall II Study. J Clin Endocrinol Metab. 2010;95:5370–5374.
7. Nguyen XM, Lane J, Smith BR, Nguyen NT. Changes in inflammatory biomarkers across weight classes in a representative US population: a link between obesity and inflammation. J Gastrointest Surg. 2009;13:1205– 1212.
8. Barzilay JI, Forsberg C, Heckbert SR, Cushman M, Newman AB. The association of markers of inflammation with weight change in older adults: the Cardiovascular Health Study.Int J Obes. 2006;30:1362–1367.
9. Toprak D, Toprak A, Chen W, Xu JH, Srinivasan S, Berenson GS. Adiposity in childhood is related to C-reactive protein and adiponectin in young adulthood: from the Bogalusa Heart Study.Obesity (Silver Spring). 2011;19: 185–190.
10. Ye X, Yu Z, Li H, Franco OH, Liu Y, Lin X. Distributions of C-reactive protein and its association with metabolic syndrome in middle-aged and older Chinese people.J Am Coll Cardiol. 2007;49:1798–1805.
11. Mohamed-Ali V, Pinkney JH, Coppack SW. Adipose tissue as an endocrine and paracrine organ.Int J Obes Relat Metab Disord. 1998;22:1145–1158. 12. Schaffler A, Muller-Ladner U, Scholmerich J, Buchler C. Role of adipose tissue
as an inflammatory organ in human diseases.Endocr Rev. 2006;27:449–467. 13. Berg AH, Scherer PE. Adipose tissue, inflammation, and cardiovascular
disease.Circ Res. 2005;96:939–949.
14. Park HS, Park JY, Yu R. Relationship of obesity and visceral adiposity with serum concentrations of CRP, TNF-alpha and IL-6.Diabetes Res Clin Pract. 2005;69:29–35.
15. Rexrode KM, Pradhan A, Manson JE, Buring JE, Ridker PM. Relationship of total and abdominal adiposity with CRP and IL-6 in women. Ann Epidemiol. 2003;13:674–682.
16. Fogarty AW, Glancy C, Jones S, Lewis SA, McKeever TM, Britton JR. A prospective study of weight change and systemic inflammation over 9 y.Am J Clin Nutr. 2008;87:30–35.
17. Gentile M, Panico S, Rubba F, Mattiello A, Chiodini P, Jossa F, Marotta G, Pauciullo P, Rubba P. Obesity, overweight, and weight gain over adult life are main determinants of elevated hs-CRP in a cohort of Mediterranean women. Eur J Clin Nutr. 2010;64:873–878.
18. Stefanska A, Sypniewska G, Blaszkiewicz B, Ponikowska I, Szternel L, Chojnowski J. Long-term weight gain and metabolic syndrome, adiponectin and C-reactive protein in women aged 50-60 years. Adv Med Sci. 2010;55:186–190.
19. Selvin E, Paynter NP, Erlinger TP. The effect of weight loss on C-reactive protein: a systematic review.Arch Intern Med. 2007;167:31–39.
20. Belza A, Toubro S, Stender S, Astrup A. Effect of diet-induced energy deficit and body fat reduction on high-sensitive CRP and other inflammatory markers in obese subjects.Int J Obes. 2009;33:456–464.
21. Yatsuya H, Jeffery RW, Langer SL, Mitchell N, Flood AP, Welsh EM, Jaeb MA, Laqua PS, Crowell M, Levy RL. Changes in C-reactive protein during weight loss and the association with changes in anthropometric variables in men and women: LIFE Study.Int J Obes. 2011;35:684–691.
22. Dowd JB, Zajacova A. Long-term obesity and cardiovascular, inflammatory, and metabolic risk in U.S. adults.Am J Prev Med. 2014;46:578–584.
23. Li C, Goran MI, Kaur H, Nollen N, Ahluwalia JS. Developmental trajectories of overweight during childhood: role of early life factors.Obesity (Silver Spring). 2007;15:760–771.
N
AL
RESE
24. Attard SM, Herring AH, Howard AG, Gordon-Larsen P. Longitudinal trajectories of BMI and cardiovascular disease risk: the National Longitudinal Study of Adolescent Health.Obesity (Silver Spring). 2013;21:2180–2188.
25. Huang RC, de Klerk NH, Smith A, Kendall GE, Landau LI, Mori TA, Newnham JP, Stanley FJ, Oddy WH, Hands B, Beilin LJ. Lifecourse childhood adiposity trajectories associated with adolescent insulin resistance. Diabetes Care. 2011;34:1019–1025.
26. Gordon-Larsen P, Koehler E, Howard AG, Paynter L, Thompson AL, Adair LS, Mayer-Davis EJ, Zhang B, Popkin BM, Herring AH. Eighteen year weight trajectories and metabolic markers of diabetes in modernising China. Diabetologia. 2014;57:1820–1829.
27. Popkin BM, Du S, Zhai F, Zhang B. Cohort Profile: the China Health and Nutrition Survey—monitoring and understanding socio-economic and health change in China, 1989–2011.Int J Epidemiol. 2010;39:1435–1440. 28. Croudace TJ, Jarvelin MR, Wadsworth ME, Jones PB. Developmental typology of
trajectories to nighttime bladder control: epidemiologic application of longitudinal latent class analysis.Am J Epidemiol. 2003;157:834–842. 29. Andruff H, Carrari N, Thompson A, Gaudreau P, Louvet B. Latent class growth
modelling: a tutorial.Tutor Quant Methods Psychol. 2009;5:11–24. 30. Nagin DS. Analyzing developmental trajectories: a semiparametric,
group-based approach.Psychol Methods. 1999;4:139.
31. Nagin DS.Group-Based Modeling of Development. Cambridge, MA: Harvard University Press; 2005.
32. Wang H, Du S, Zhai F, Popkin BM. Trends in the distribution of body mass index among Chinese adults, aged 20-45 years (1989–2000).Int J Obes. 2007;31:272–278.
33. Paynter L, Koehler E, Howard AG, Herring AH, Gordon-Larsen P. Characterizing long-term patterns of weight change in China using latent class trajectory modeling.PLoS One. 2015;10:e0116190.
34. Jones BL, Nagin DS, Roeder K. A SAS procedure based on mixture models for estimating developmental trajectories.Sociol Methods Res. 2001;29:374. 35. Jones BL, Nagin DS. Advances in group-based trajectory modeling and an SAS
procedure for estimating them.Sociol Methods Res. 2007;35:542–571. 36. Paeratakul S, Popkin BM, Keyou G, Adair LS, Stevens J. Changes in diet and
physical activity affect the body mass index of Chinese adults.Int J Obes. 1998;22:424–431.
37. Jones-Smith JC, Popkin BM. Understanding community context and adult health changes in China: development of an urbanicity scale.Soc Sci Med. 2010;71:1436–1446.
38. Gordon-Larsen P, Adair LS, Meigs JB, Mayer-Davis E, Herring A, Yan S, Zhang B, Du S, Popkin BM. Discordant risk: overweight and cardiometabolic risk in Chinese adults.Obesity. 2013;21:E166–E174.
39. Yan S, Li J, Li S, Zhang B, Du S, Gordon-Larsen P, Adair L, Popkin B. The expanding burden of cardiometabolic risk in China: the China Health and Nutrition Survey.Obes Rev. 2012;13:810–821.
40. McDade TW, Lindau ST, Wroblewski K. Predictors of C-reactive protein in the national social life, health, and aging project.J Gerontol B Psychol Sci Soc Sci. 2011;66:129–136.
41. Tzoulaki I, Jarvelin MR, Hartikainen AL, Leinonen M, Pouta A, Paldanius M, Ruokonen A, Canoy D, Sovio U, Saikku P. Size at birth, weight gain over the life course, and low-grade inflammation in young adulthood: Northern Finland 1966 Birth Cohort Study.Eur Heart J. 2008;29:1049.
42. Sampey BP, Vanhoose AM, Winfield HM, Freemerman AJ, Muehlbauer MJ, Fueger PT, Newgard CB, Makowski L. Cafeteria diet is a robust model of human metabolic syndrome with liver and adipose inflammation: comparison to high-fat diet.Obesity (Silver Spring). 2011;19:1109–1117.
43. Yang Z, Miyahara H, Takeo J, Katayama M. Diet high in fat and sucrose induces rapid onset of obesity-related metabolic syndrome partly through rapid
response of genes involved in lipogenesis, insulin signalling and inflammation in mice.Diabetol Metab Syndr. 2012;4:32.
44. Albrecht SS, Gordon-Larsen P, Stern D, Popkin BM. Is waist circumference per body mass index rising differentially across the United States, England, China and Mexico?Eur J Clin Nutr. 2015;69:1306–1312.
45. Stern D, Smith LP, Zhang B, Gordon-Larsen P, Popkin BM. Changes in waist circumference relative to body mass index in Chinese adults, 1993–2009.Int J Obes. 2014;38:1503–1510.
46. Khan RJ, Gebreab SY, Riestra P, Xu R, Davis SK. Parent-offspring association of metabolic syndrome in the Framingham Heart Study.Diabetol Metab Syndr. 2014;6:140.
47. Ferrucci L, Corsi A, Lauretani F, Bandinelli S, Bartali B, Taub DD, Guralnik JM, Longo DL. The origins of age-related proinflammatory state. Blood. 2005;105:2294–2299.
48. Thompson AL, Adair L, Gordon-Larsen P, Zhang B, Popkin B. Environmental, dietary, and behavioral factors distinguish Chinese adults with high waist-to-height ratio with and without inflammation.J Nutr. 2015;145:1335–1344. 49. Lloyd-Jones DM, Liu K, Colangelo LA, Yan LL, Klein L, Loria CM, Lewis CE,
Savage P. Consistently stable or decreased body mass index in young adulthood and longitudinal changes in metabolic syndrome components: the Coronary Artery Risk Development in Young Adults Study. Circulation. 2007;115:1004–1011.
50. Berrahmoune H, Herbeth B, Samara A, Marteau JB, Siest G, Visvikis-Siest S. Five-year alterations in BMI are associated with clustering of changes in cardiovascular risk factors in a gender-dependent way: the Stanislas study.Int J Obes. 2008;32:1279–1288.
51. Thorand B, Baumert J, Doring A, Herder C, Kolb H, Rathmann W, Giani G, Koenig W; KORA Group. Sex differences in the relation of body composition to markers of inflammation.Atherosclerosis. 2006;184:216–224.
52. Valentine RJ, Vieira VJ, Woods JA, Evans EM. Stronger relationship between central adiposity and C-reactive protein in older women than men.Menopause. 2009;16:84–89.
53. Khera A, Vega GL, Das SR, Ayers C, McGuire DK, Grundy SM, de Lemos JA. Sex differences in the relationship between C-reactive protein and body fat.J Clin Endocrinol Metab. 2009;94:3251–3258.
54. Abdullah SM, Khera A, Leonard D, Das SR, Canham RM, Kamath SA, Vega GL, Grundy SM, McGuire DK, de Lemos JA. Sex differences in the association between leptin and CRP: results from the Dallas Heart Study.Atherosclerosis. 2007;195:404–410.
55. Hoekstra T, Barbosa-Leiker C, Koppes LLJ, Twisk JWR. Developmental trajectories of body mass throughout the life course: an application of latent class growth (mixture) modelling.Longit Life Course Stud. 2011;2:319–330. 56. Slining M, Herring A, Popkin B, Mayer-Davis EJ, Adair L. Infant BMI trajectories
are associated with young adult body composition.J Dev Orig Health Dis. 2012;4:56–68.
57. Mustillo S, Worthman C, Erkanli A, Keeler G, Angold A, Costello EJ. Obesity and psychiatric disorder: developmental trajectories.Pediatrics. 2003;111:851– 859.
58. Ostbye T, Malhotra R, Landerman LR. Body mass trajectories through adulthood: results from the National Longitudinal Survey of Youth 1979 Cohort (1981–2006).Int J Epidemiol. 2011;40:240–250.
59. Holz T, Thorand B, Doring A, Schneider A, Meisinger C, Koenig W. Markers of inflammation and weight change in middle-aged adults: results from the prospective MONICA/KORA S3/F3 study. Obesity (Silver Spring). 2010;18:2347–2353.
60. Engstrom G, Hedblad B, Stavenow L, Lind P, Janzon L, Lindgarde F. Inflammation-sensitive plasma proteins are associated with future weight gain.Diabetes. 2003;52:2097–2101.
N
AL
RESE
Included
Excluded
(subjects with at least
one adult measurement
less than 66 in 2009
with no trajectory, or
pregnant, CRP missing,
or CRP>10)
p-value
N=5536
N=2613
2009 Age
48.8 ( 40.6 – 56.6 )
38.9 ( 26.4 – 51.5 )
<0.0001
Baseline Weight
56.3 ( 50.9 – 63.4 )
59.0 ( 52.0 – 66.3 )
<0.0001
Ave Adult Ht
160.9 ( 155.8 – 167.0 )
162.8 ( 157.0 – 169.5 )
<0.0001
Total HH Income
32264 ( 17820 – 55067 )
32543 ( 19374 – 53277 )
0.4418
2009 Urbanization
Index
61.0 ( 50.6 – 83.0 )
75.5 ( 54.1 – 89.1 )
<0.0001
Ever Smoke
0.0014
0
68.0% (3762)
42.8% (1119)
1
32.0% (1770)
16.4% (429)
Baseline Wave
N
1991
1993
1997
2000
2004
2006
F18-30
936 39.3% (368) 8.0% (75) 20.5% (192)
14.3% (134)
10.4% (97) 7.5% (70)
F30-40
1069 51.9% (555) 4.5% (48) 16.8% (180)
10.5% (112)
9.8% (105) 6.5% (69)
F40-66
895 40.1% (359) 2.7% (24) 19.1% (171)
13.6% (122) 16.2% (145) 8.3% (74)
M18-30
928 41.1% (381) 9.9% (92) 21.0% (195)
11.0% (102)
9.2% (85)
7.9% (73)
M30-40
857 52.2% (447) 5.3% (45) 17.6% (151)
10.6% (91)
9.8% (84)
4.6% (39)
● ●
●
●
Men
≥
18 and <30 years of mean baseline weight
● ●
●
●
CRP
8.8% 59.4% 27.3% 4.5% 8.8% 59.4% 27.3%
1
2
3
4
0
0.2
0.4
0.6
0.8
1
● ● ●
●
●
Men
≥
30 and <40 years of mean baseline weight
● ● ●
●
●
CRP
5.5% 42.6% 36.0% 14.1% 1.8% 5.5% 42.6%
1
2
3
4
5
0
0.2
0.4
0.6
0.8
1
● ● ● ●
●
Men
≥
40 and <66 years of mean baseline weight
● ● ● ●
●
CRP
1
2
3
4
5
0
0.2
0.4
0.6
0.8
1
Years from Start
Predicted change in w
eight (kg)
2
6
10
14
18
−
10
−
5
0
5
10
15
20
25
Years from Start
Predicted change in w
eight (kg)
2
6
10
14
18
−
10
−
5
0
5
10
15
20
25
Years from Start
Predicted change in w
eight (kg)
2
6
10
14
18
−
10
−
5
0
5
10
15
20
25
(a)
(c)
(e)
(b)
(d)
●
● ● ●
●
●
Women
≥
18 and <30 years of mean baseline weight
●
● ● ●
●
●
CRP
9.3% 34.4% 36.8% 12.9% 4.6% 1.9% 9.3%
1
2
3
4
5
6
0
0.2
0.4
0.6
0.8
1
●
●
●
●
●
●
Women
≥
30 and <40 years of mean baseline weight
●
●
●
●
●
●
CRP
2.2% 14.3% 48.6% 29.1% 2.1% 3.6% 2.2%
1
2
3
4
5
6
0
0.2
0.4
0.6
0.8
1
●
●
●
●
Women
≥
40 and <66 years of mean baseline weight
●
●
●
●
CRP
1
2
3
4
0
0.2
0.4
0.6
0.8
1
Years from Start
Predicted change in w
eight (kg)
2
6
10
14
18
−
10
−
5
0
5
10
15
20
25
Years from Start
Predicted change in w
eight (kg)
2
6
10
14
18
−
10
−
5
0
5
10
15
20
25
Years from Start
Predicted change in w
eight (kg)
2
6
10
14
18
−
10
−
5
0
5
10
15
20
25
(a)
(c)
(e)
(b)
(d)
Rank 6 Rank 5 Rank 4 Rank 3 Rank 2 Rank 1
High
Low
Rank 6 Rank 5 Rank 4 Rank 3 Rank 2 Rank 1
High
Low
Rank 4 Rank 3 Rank 2 Rank 1
High
Low
≥
18
to <30
≥
30
to <40
≥
40
to <66
Women
Men
ESM Figure 1. Relative rank of weight trajectories for elevated CRP
risk across sex and age strata, results from a simulation study.
Results from a simulation based on random sampling from normal distributions for each trajectory class in each age−sex strata, centered at the trajectory−specific estimates of risk of elevated CRP and their respective variances.
Ranks of the trajectory groups were recorded with rank 1 given