i
Martin L. Buchkovich
A dissertation submitted to the faculty at the University of North Carolina at Chapel Hill in partial fulfillment of the requirements for the degree of Doctor of Philosophy in the Curriculum in
Bioinformatics and Computational Biology.
Chapel Hill 2015
Approved by:
Praveen Sethupathy
Yun Li
Gregory E. Crawford
Terrence S. Furey
ii ©2015
iii
Martin L. Buchkovich: Identifying genetic mechanisms of cardiometabolic traits and diseases using quantitative sequence data
(Under the direction of Karen L. Mohlke and Terrence S. Furey)
Cardiometabolic diseases are a worldwide health concern. Genetics studies have
identified hundreds of genetic loci associated with these diseases and other cardiometabolic risk
factors, but gaps remain in the understanding of the biological mechanisms responsible for
these associations. Sequence data from quantitative experiments, such as DNase-seq and
ChIP-seq, that identify genomic regions regulating gene transcription are helping to fill these
gaps. Allelic imbalance at heterozygous sites, or enrichment of one allele, in this data can
indicate allelic differences in transcriptional regulation, but reference mapping biases present in
sequence alignments prevent accurate allelic imbalance detection.
We describe a pipeline, AA-ALIGNER, that removes mapping biases at heterozygous
sites and increases allelic imbalance detection accuracy in samples with any amount of
genotype data available. When complete genotype information is not available, AA-ALIGNER
more accurately detects allelic imbalance at imputed heterozygous sites than heterozygous
sites predicted using the sequence data. At predicted heterozygous sites, imbalance detection
is more accurate at common variants than other variants. Additionally, imbalance detection with
AA-ALIGNER is robust to a variety of experimental and analytical parameters.
Using AA-ALIGNER, we detected evidence of allelic imbalance at 22,414 heterozygous
sites in data from samples with relevance to cardiometabolic disease and risk factors. We have
iv
and evidence that imbalance in data for this protein is associated with imbalance in data for
other proteins. Additionally, a subset of sites of allelic imbalance are located at expression
quantitative trait loci and/or genome-wide association loci for cardiometabolic traits and
diseases. These sites are strong candidates to be studied experimentally and we report
experimental evidence of allelic differences in protein binding, enhancer activity and/or the
regulation of specific genes for a handful of these sites.
Using allelic imbalance detection, we have detected differences in protein binding across
the genome providing valuable insight into mechanisms of transcriptional regulation. Focusing
on cardiometabolic diseases and risk factors, this work demonstrates the utility of allelic
imbalance detection in studying genetic effects on the regulation of gene transcription at
vi
ACKNOWLEDGEMENTS
This work is the direct result of a journey that started well before I enrolled in graduate
school and subsequently became a Ph.D. candidate. Successful completion of this journey
would not be possible without the aid, advice, encouragement and support of many individuals
along the way. I value the friendship of all that I have encountered on this journey and take a
moment here to acknowledge those who have hand a direct hand in the completion of this work.
While a paragraph is inadequate to fully acknowledge their contributions to this work, I
would first like to thank and acknowledge my mentors Karen Mohlke and Terry Furey. They
provided a positive environment that allowed me to engage in exciting research and fostered my
growth as an individual and scientist. I would especially like to thank Karen for providing me with
an abundance of opportunities to deepen my understanding of human genetics and complex
phenotypes through interactions with collaborators and participation in their research. I am
grateful to Terry for broadening my understanding of genomics and computational biology, by
continually encouraging me to delve deep into biological questions being asked and find the
most appropriate solution for answering these questions.
I would also like to acknowledge the contributions of my other committee members,
Praveen Sethupathy, Yun Li, and Greg Crawford and thank them for their support and
encouragement. Whether it was by advice given from miles away, during unannounced visits to
their offices, or through participation in their courses, their advice, ideas, and knowledge were
critical to this work.
As a member of two labs, I have been privileged to interact with many individuals, who
are too many to name. I am especially thankful to members of the Mohlke and Furey labs, both
vii
on my work and share ideas. I would also like to acknowledge the many collaborators I have
worked with who have expanded my horizons and pushed me to be a better researcher, as well
as all others I have interacted with during my time as a graduate student. I will always be
grateful for the footprints that my scientific mentors and colleagues have made in my life and will
values the friendship we have made.
This work would not have been possible without the support and encouragement of
many individuals outside of science. I am especially grateful for members of my family. I would
specifically like to acknowledge my aunt and uncle, Karen Buchkovich-Sass and Phil Sass, who
have been very supportive of my scientific pursuits and facilitated my first extended exposure to
molecular biology experiments, and Nicholas Buchkovich, the first member of my immediate
family to receive a Ph.D. I thank my wife’s parents, Paul and Sally Baird, and would like to
publically acknowledge them for the many hours of service given and miles driven to support my
family as I have pursued my degree. Likewise, words cannot express enough my thanks to my
parents Terry and Joan Buchkovich, for their continuous support and encouragement. They
have given sacrificed much to foster my scientific career and I am sure that they would have
sacrificed more had there been fewer miles between us.
Finally and most importantly, I acknowledge my wife, Jennie Buchkovich, for her love,
encouragement and support. Between working the night shift and giving up her weekends to
support our family to acting as a single mother when deadlines neared, her sacrifices have been
great. Without them, this work would not have been possible. I cannot thank her enough and will
always be grateful to have her at my side. I am also grateful for my sons Kelten and Caleb, for
viii
TABLE OF CONTENTS
LIST OF TABLES ...xii
LIST OF FIGURES ... xiii
LIST OF ABBREVIATIONS ... xiv
CHAPTER 1: INTRODUCTION ... 1
1.1 Introduction ... 1
1.2 Genetic variation contributes to cardiometabolic traits and diseases ... 1
1.3 Genetic variants at GWAS loci likely influence gene transcription regulation... 2
1.4 Next-generation sequencing data is a powerful tool in genetic studies ... 4
1.5 Sequence mapping biases influence regulatory element identification ... 6
1.6 Several methods have been reported to remove reference mapping biases ... 7
1.6.1 Biased mismatch threshold ... 8
1.6.2 Variant masking ... 9
1.6.3 Dual reference genomes ... 9
1.6.4 Modified dual reference genome ...10
1.6.5 Allele-aware reference creation ...11
1.6.6 Allele-aware aligner ...11
1.7 Overview of this work ...12
CHAPTER 2: REMOVING REFERENCE MAPPING BIASES USING LIMITED OR NO GENOTYPE DATA IDENTIFIES ALLELIC DIFFERENCES IN PROTEIN BINDING AT DISEASE-ASSOCIATED LOCI ...14
2.1 Background...14
2.2 Results ...16
2.2.1 Overview of AA-ALIGNER ...16
ix
2.2.3 AA-ALIGNER identifies sites of allelic imbalance using partial genotypes or
common variant information ...20
2.2.4 Second alignment provides only modest improvement in sensitivity and precision for incomplete genotypes ...22
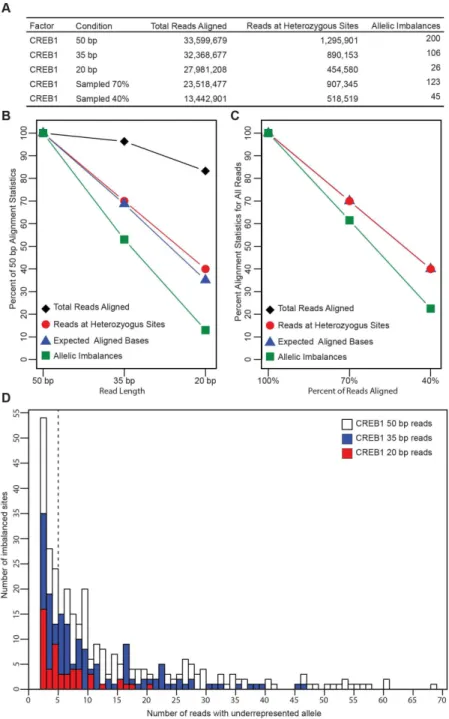
2.2.5 Shorter read length and lower sequencing depth reduce the number of imbalance predictions but not precision or sensitivity ...23
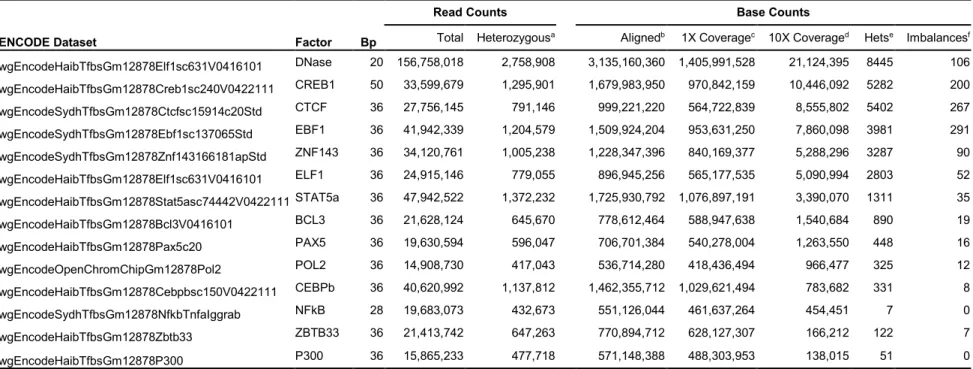
2.2.6 Number of imbalances identified varies across factors and assays ...24
2.2.7 Allowing additional alignment mismatches increases sensitivity but decreases precision ...26
2.2.8 Requiring a minimum number of reads containing each allele increases precision at predicted heterozygous sites ...27
2.2.9 Requiring higher imputation quality does not significantly improve imbalance identification ...27
2.2.10 Allelic differences in CREB1 binding experimentally supported at inflammatory bowel disease-associated loci and other predicted sites ...28
2.3 Discussion ...31
2.4 Conclusions ...35
2.5 Methods ...36
2.5.1 Genotype Data ...36
2.5.2 Custom reference creation ...37
2.5.3 Quantitative sequence data processing ...37
2.5.4 Identifying allelic imbalance ...38
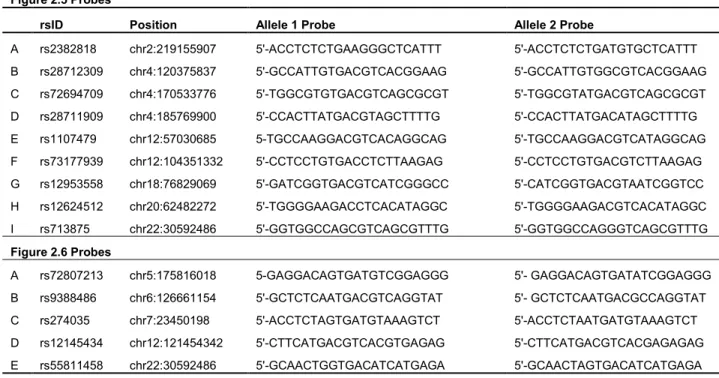
2.5.5 Electrophoretic mobility shift assays ...39
CHAPTER 3: ALLELIC IMBALANCE DETECTION IN QUANTITATIVE SEQUENCE DATA PREDICTS GENETIC EFFECTS ON PROTEIN BINDING AT LOCI ASSOCIATED WITH CARDIOMETABOLIC TRAITS AND DISEASES ...54
3.1 Background...54
3.2 Results ...56
3.2.1 Allelic imbalance detection in quantitative sequence data from cardiometabolic-relevant tissues ...56
x
3.2.3 Percent of genome with 8X coverage is highly correlated with the number
of imbalances detected ...57
3.2.4 Changing the allele present in the reference does not change the alignment ...58
3.2.5 The major allele is commonly enriched at sites of allelic imbalance ...59
3.2.6 Allelic imbalance sites are in the same region as predicted binding motifs for imbalanced proteins ...59
3.2.7 Presence of allelic imbalance in one protein of established protein-protein pairs is associated with presences of imbalance in the second protein ...60
3.2.8 Allelic imbalance in DNase-seq data coincides with allelic imbalance in ChIP-seq data at a subset of allelic imbalance sites ...61
3.2.9 Allelic imbalances at published eQTL loci ...62
3.2.10 Allelic imbalances at cardiometabolic phenotype-associated loci ...63
3.2.11 Experimental conformation of allelic differences in protein binding and enhancer activity at imbalanced sites ...63
3.3 Discussion ...64
3.4 Conclusion ...67
3.5 Methods ...68
3.5.1 Genotype imputation ...68
3.5.2 Sequence mapping and imbalance detection in quantitative sequence data ...68
3.5.3 Identifying motif occurrences ...69
3.5.4 Cell Culture ...69
3.5.5 Generation of luciferase reporter constructs, transient DNA transfection and luciferase reporter assays ...69
CHAPTER 4: CONCLUSIONS ...83
4.1 Introduction ...83
4.2 Overview of findings ...83
4.3 Immediate impact on genetic studies of cardiometabolic phenotypes ...84
4.4 Long-term impact on researching genetic effects on cardiometabolic phenotypes ...85
xi
4.6 Advantages of allelic imbalance detection ...86
4.7 Limitations of allelic imbalance detection ...88
4.8 Allelic imbalance and population studies of quantitative sequence data ...89
APPENDIX 1: Allelic imbalance sites referenced in text ...91
APPENDIX 2: Allelic imbalance at eQTL loci (P<1.0x10⁻⁵) ... 108
APPENDIX 3: Allelic imbalance at cardiometabolic trait and disease GWAS loci ... 113
APPENDIX 4: Cardiometabolic diseases and traits from GWAS catalog ... 122
xii
Table 2.1. Allele-aware alignments with complete genotypes (GSNAP) vs no genotype
information (BWA) ...40
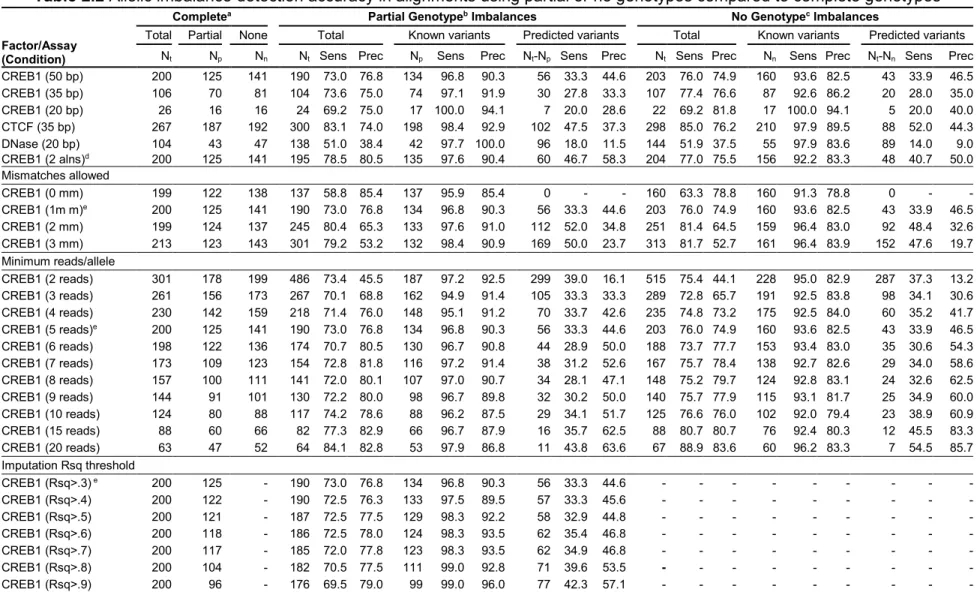
Table 2.2 Allelic imbalance detection accuracy in alignments using partial or no genotypes compared to complete genotypes ...41
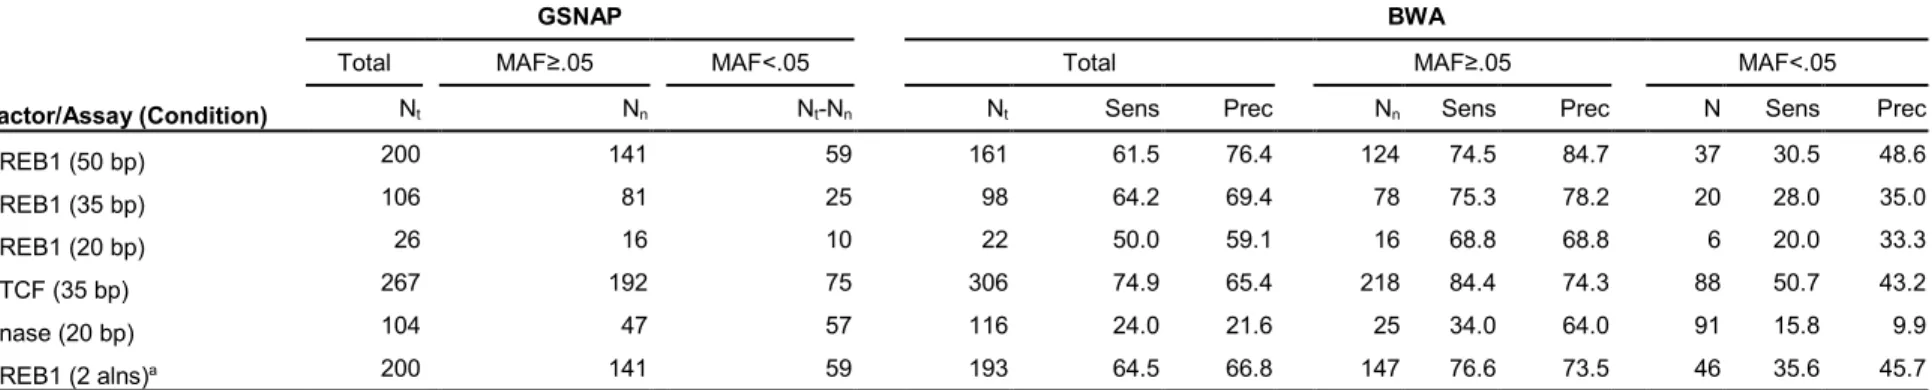
Table 2.3 Precision of imbalance detection in non-allele-aware alignments ...42
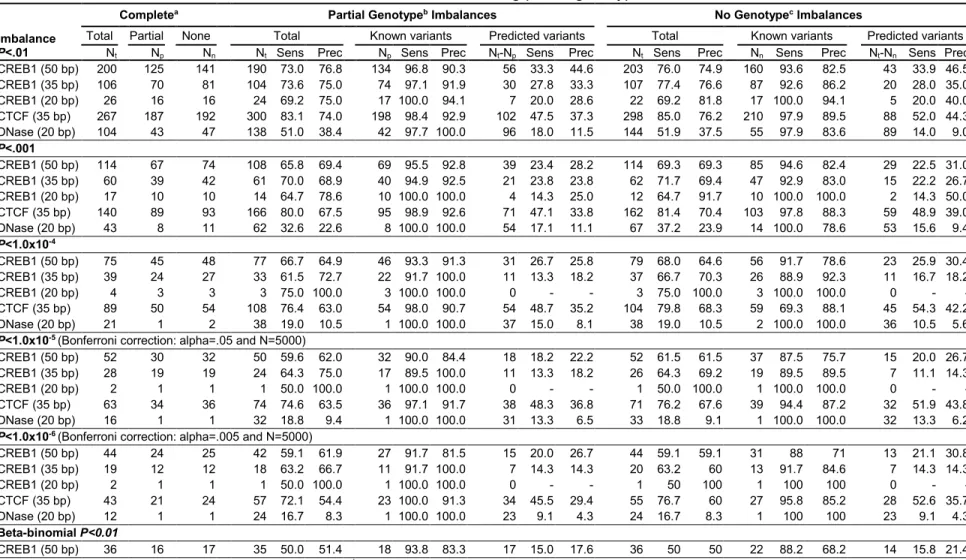
Table 2.4 P-value threshold influences allelic imbalance detection using partial genotypes and common variants ...43
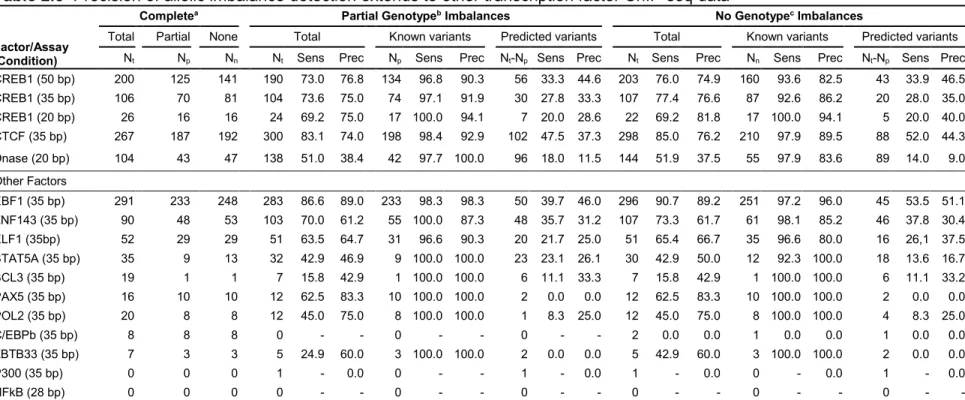
Table 2.5 Precision of allelic imbalance detection extends to other transcription factor ChIP-seq data ...44
Table 2.6 Alignment and base coverage statistics for ChIP-seq transcription factor and Dnase-seq data ...45
Table 2.7 EMSA probes for experimental validation ...46
Table 3.1 Summary of Detected Allelic Imbalances ...71
Table 3.2 Allele-aware alignments with complete genotypes (GSNAP) vs no genotype information (BWA) ...72
Table 3.3 Site of allelic imbalance with published evidence of eQTL (P<1.0x10⁻¹⁰ ) ...73
Table 3.4 Sites of allelic imbalance located at cardiometabolic disease-associated loci ...74
Table 3.5 Sites of allelic imbalance located at lipid trait-associated loci ...75
xiii
LIST OF FIGURES
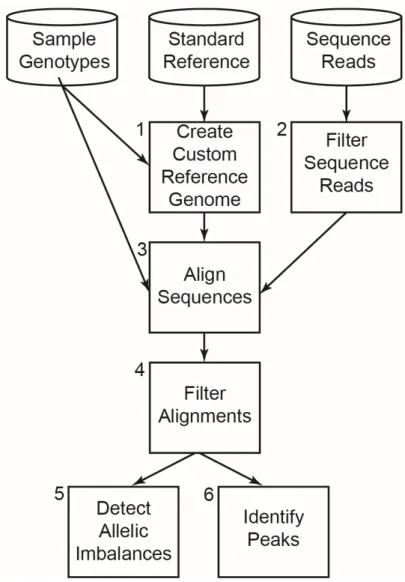
Figure 2.1. Overview of AA-ALIGNER ...47
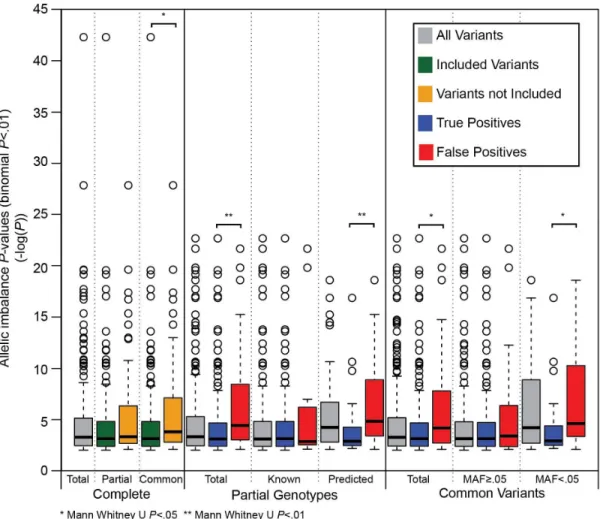
Figure 2.2 False positive imbalance sites have more significant p-values ...48
Figure 2.3 Read length influences sequence alignment and allelic imbalance detection at heterozygous sites ...49
Figure 2.4 Correlation of alignment statistics and number of imbalances detected ...50
Figure 2.5 Validation of allelic imbalance detected at GWAS loci and other predicted sites ...51
Figure 2.6 Allelic differences in binding at sites without predicted allelic imbalance ...53
Figure 3.1 Concordance between replicate datasets ...77
Figure 3.2 Percent of genome with 8X coverage is correlated with imbalance detection ...78
Figure 3.3 Co-occupancy of binding motifs and reads from DNAse-seq and ChIP-seq experiments at allelic imbalance sites ...80
xiv
LIST OF ABBREVIATIONS
AA-ALIGNER Allele-Aware Aligner for Investigating GeNetic Effects on Regulation
bp base pairs
ChIP Chromatin Immunoprecipitation
EMSA Electrophoretic mobility shift assay
ENA European Nucleotide Archive
ENCODE ENCyclopedia of DNA Elements
eQTL expression quantitative trait loci
FAIRE Formaldehdye Assisted Isolation of Regulatory Elements
GIANT Genetic Investigation of ANthropometric Traits
GLGC Global Lipid Genetics Consortium
GWAS genome-wide association study
HDL-C High-density lipoprotein cholesterol
LD Linkage Disequilibrium
LDL-C Low-density lipoprotein cholesterol
SRA Sequence Nucleotide Archive
T2D Type 2 diabetes
TBP TATA binding protein
TC Total cholesterol
1
1.1 Introduction
Complex, cardiometabolic diseases (i.e. type 2 diabetes and coronary artery disease),
and related traits (i.e. lipid levels) present a major public health concern worldwide1. These
cardiometabolic phenotypes are influenced by both genetic and environmental factors.
Understanding how genetic factors influence biological mechanisms contributing to phenotypes,
such as gene transcription, is the first step in identifying novel, personalized treatment. While
hundreds of genomic locations, or loci, have been associated with cardiometabolic phenotypes,
the biological mechanisms responsible for these associations are understood for only a small
proportion of loci. Analyzing short sequence reads from next generation sequencing
technologies is a powerful method of studying the influence of genetic factors on biological
mechanisms. These analyses can identify genetic variants influencing gene transcription and
provide an important first step in bridging the gap between genetic variation and cardiometabolic
phenotypes.
1.2 Genetic variation contributes to cardiometabolic traits and diseases
Genome-wide association studies (GWAS) are an active area of research and effective
tool for studying genetic factors influencing cardiometabolic traits and diseases. These studies
find statistical associations between genetics variants and the presence of disease or
differences in trait measurements2. To date, GWAS have identified over 75 genetic loci
significantly associated with type 2 diabetes3, 46 loci associated with coronary artery disease4,
and over three hundred more loci associated with other cardiometabolic traits, such as lipid
2
(body mass index, waist-to-hip ratio, and body fat percentage)14–16. Large consortia, such as the
Genetic Investigation of Anthropometric Traits (GIANT) consortium and the Global Lipids
Genetics Consortium (GLGC) are actively identifying additional variants associated with
metabolic traits. In addition, the Metabolic Syndrome in Men (METSIM) study is identifying
variants associated with detailed phenotypic traits, including ~200 traits related to diabetes
status, including measures of lipids, lipoprotein particles, glucose, insulin, proinsulin, free fatty
acids, body composition, cytokines, hormones, and metabolites, most collected for 10,000
subjects17.
1.3 Genetic variants at GWAS loci likely influence gene transcription regulation
While the variants identified by these studies can influence phenotypes by altering
protein structure3 or influencing post transcriptional gene regulation18, a majority of variants
(90%) are located in non-coding regions at GWAS loci and likely influence gene transcription
regulation19. Identifying genes differentially regulated by these variants is critical for
understanding the biological pathways influenced by these variants, and their role in disease
susceptibility.
Variants at GWAS loci have also been associated with the expression of nearby genes.
Expression quantitative trait loci (eQTLs) are genetic variants that are associated with gene
transcript levels20. Similar to GWAS, eQTL analyses utilize genotype data from individuals in a
population, but test for associations between these genotypes and gene transcript levels rather
than diseases and traits. As many as 12% of variants reported in the NHGRI GWAS catalog21
are either the variant reported at an eQTL locus, or in linkage disequilibrium (LD) with the
reported variant22. This co-occurrence of GWAS and eQTL associations provides additional
evidence that at these loci, and possibly others, differential regulation of gene transcript levels
may be an intermediary between genetic variants and observed differences in phenotype.
3
binding affinity of proteins important to transcription. DNA-binding proteins often bind
preferentially to a specific DNA sequence, or binding motif. Sequence changes caused by
genetic variation may result in changes in protein-DNA binding affinity and consequently alter
the amount of DNA-bound protein. Altered binding of transcription factors can directly change
the amount of gene transcription23. In other cases, differential binding of proteins, such as
proteins from FOXA family, can indirectly alter gene transcription by influencing chromatin
accessibility24, defined as accessibility of DNA for binding by transcriptional machinery, including
transcription factors25. Likewise, other proteins, such as CTCF, are important in chromatin
looping which controls gene transcription by bringing regulatory regions in close proximity to
each other to promote gene transcription, or by marking the boundaries between active and
inactive regulatory regions26. Understanding the influence of genetic variants on transcription
binding, chromatin accessibility and chromatin looping is important for understanding their
overall influence on gene transcription.
While genome-wide association and eQTL studies identify genetic regions associated
with phenotypes and gene expression, it is difficult, using only these studies, to identify the
precise variants responsible for the associations. Groups of genetic variants that are inherited
together, or haplotypes, are considered to be in linkage disequilibrium (LD). Generally the
variant with the highest significance is reported as the eQTL or GWAS marker variant, but any
number of the variants in LD with this marker variant may be responsible for or contribute to the
association signal. Further study of GWAS and eQTL loci is required to identify the precise
variant(s) responsible for the association signals and elucidate their influence on gene
transcription.
Experimental studies are able to identify genetic variants influencing the regulation of
gene transcription. These studies have experimentally identified the variants contributing to
differential gene transcription at GWAS loci18,22. For example, at the low-density lipoprotein
4
rs12740374 creates a C/EBPa binding site in a regulatory region. In mice, increased C/EBPa
binding in this region, increases expression of the Sort1 protein, ultimately reducing LDL-C
levels23. Like SORT1,variants altering protein binding, chromatin accessibility, and gene
transcription continue to be reported for other loci associated with cardiometabolic phenotypes
27–33. Experimental evidence identifying the variants regulating gene transcription at known loci
is being discovered at a much slower rate than novel GWAS loci. Improved analytical and
experimental techniques are necessary to identify regulatory variants at these established and
novel loci.
1.4 Next-generation sequencing data is a powerful tool in genetic studies
Next-generation sequencing data from functional genomics experiments is a powerful
tool in identifying variants regulating gene transcription and contributing to complex phenotypes.
The advent of these technologies, capable of generating nucleotide sequence data for millions
of DNA or RNA fragments34, has led to scientific advancements in genetic studies.
Whole-genome and whole-exome studies of large populations of individuals35 continue to increase
understanding of genetic variation and the effects of this variation on gene expression and
complex phenotypes. Additionally, RNA-seq, in which RNA is isolated and sequenced, can be
used for genome-wide measurement of transcription levels, and other quantitative sequence
data, such as ChIP-seq36, FAIRE-seq37, DNase-seq38 and ATAC-seq39, can be used for
genome-wide identification of gene transcription regulatory regions.
In each of these quantitative sequence data experiments, DNA is isolated from targeted
genome-wide regions and sequenced. Sequence reads are mapped to a reference genome,
and the regions of signal enrichment are identified based on the number of mapped sequence
reads. ChIP-seq can be used to identify the location of transcription factor binding or histone
modifications across the genome. DNase-seq, ATAC-seq and FAIRE-seq use different assays
5
DNA is digested with the DNaseI enzyme to identify DNase hypersensitive regions, while in
FAIRE-seq DNA fragments are isolated from regions nucleosomes-depleted regions. In
ATAC-seq, the most recent open chromatin assay developed, transposase activity is used to identify
regions of open chromatin.
To facilitate genome-wide identification of these regulatory regions, massive amounts of
these quantitative sequence read data have been generated. For example, the ENCyclopedia of
DNA Elements (ENCODE) consortium has generated more than 1,640 quantitative sequence
datasets in more than 147 different cells lines and tissues40. These data, including transcription
factor and histone modification ChIP-seq, RNA-seq, FAIRE-seq, and DNase-seq, can be found
in online repositories at the UCSC Genome Browser41 and the ENCODE Portal42. Likewise, the
Roadmap Epigenomics project has generated over 2,500 datasets from 111 different cell types
and tissues, including histone modification ChIP-seq, DNase-seq, and RNA-seq43. These data
are available at the Human Epigenome Atlas44. Additionally the sequence data generated by
these large consortia, as well as data generated by smaller collaborations or individual labs, are
also available online in less specialized repositories, such as the Sequence Read Archive
(SRA45) and the European Nucleotide Archive (ENA46).
The available quantitative sequence data is especially useful in identifying GWAS
variants located in genomic regions that regulate gene transcription. Several published studies
have used these data to predict regulatory regions genome-wide by integrating ChIP-seq data
that identify protein binding sites47,48 or histone modifications43,49, with FAIRE-seq50 or
DNase-seq19,51 that identify regions of chromatin accessibility. Additionally, multiple bioinformatics
tools, such as HaploReg52, RegulomeDB53 and Annovar54, have been created to annotate
variants using quantitative sequence data and in some cases to predict the likelihood of a
variant being in a regulatory region. Some methods also integrate RNA-seq data to identify
direct correlations between protein binding or chromatin accessibility with gene transcription
6
regions, some analyses directly consider the effects of genetic variation during regulatory
element identification.
Allelic imbalance in quantitative sequence data can identify differences in the functional
activity between two alleles at a variant. Allelic imbalance is indicated by a difference in the
number of sequence reads containing each allele, or enrichment of one allele, at heterozygous
sites in the quantitative sequence data. Allelic imbalance analyses can identify allelic
differences in transcription factor binding57,58, chromatin accessibility19,55,59, histone
modifications56 and gene transcription 60–64. While allelic imbalance identification does not
require knowledge of heterozygous sites in the sequenced sample, many studies are limited to
samples with full, or complete, genotype information available from whole-genome sequencing.
Allelic imbalance can also be detected in samples with limited genotype information by
estimating the presence of variants based on populations of individuals such as HapMap65 and
1000 Genomes35, and predicting heterozygous sites using the sequence data19,57,62,64.
Regardless of genotype availability, sequence mapping biases introduced during sequence
alignment can complicate and decrease accuracy of regulatory element detection, especially
allelic imbalance identification.
1.5 Sequence mapping biases influence regulatory element identification
Read mapping biases occur at heterozygous sites when sequence reads containing one
allele are more likely to map to the site than the other allele. While reads originating from a
heterozygous site will contain one of the two alleles, reads are commonly mapped to a
reference genome containing only a single base, the reference allele, at each heterozygous site.
Mapping to a single allele commonly results in reference mapping biases because reads
containing the reference allele better match the reference sequence and have a higher mapping
quality than reads containing the non-reference allele, which are penalized for a mismatch at the
heterozygous site. As a result, reads with non-reference allele are less likely to map correctly,
7
imbalance detection. Many commonly used alignment software, such as BWA66, MAQ67,
Bowtie68, and STAR69, are only built to map to single-allele reference genomes while other
software, such as GSNAP70, allows sequence mapping to multiple-allele references. Regardless
of the software used, reference mapping biases will be introduced if reads are aligned to a
reference containing a single allele.
A second type of bias can influence both reference and non-reference alleles and occurs
when reads containing one allele map to multiple genomics locations and reads containing the
other allele map to a single location. Filtering reads based on the number of genomic locations,
a common practice, may preferentially remove reads containing the allele that maps to multiple
locations, resulting in mapping bias. This bias and reference mapping bias can be corrected
during post-alignment steps, but reference mapping biases are most commonly corrected during
sequence mapping. Current methods of correcting reference mapping biases are described
below.
1.6 Several methods have been reported to remove reference mapping biases
Methods for correcting reference mapping biases vary and are dependent on the
underlying data structure of the mapping software. Differences in each sequence mapping
software determine the method of reference bias correction associated with each. Many
commonly used alignment software, such as BWA, Bowtie, and STAR, utilize a suffix array
during sequence mapping. A suffix array contains a list of all possible suffixes of the reference
genome, and their corresponding positon in the genome. Traversing suffix arrays takes little
time, resulting in very fast sequence alignment. Using compressed suffix arrays such as the
Burrows-Wheeler transformation can also reduce the amount of computational resources
required, making suffix array-based software desirable when considering both computational
time and resources71. Other alignment software, such as GSNAP, and MAQ, utilize hash-tables
8
of length k. Using these k-mers, sequence reads can be matched to genomic locations,
although alignments using hash tables are generally slower than alignments using suffix arrays.
Most reference bias correction strategies can be implemented with software based on either
suffix arrays or hash tables, although many bias correction methods have preferred the speedier
suffix-array software.
Five strategies to correct mapping biases include using a biased mismatch threshold19,
variant masking72, dual reference genomes57,58,60–62,73, modified dual reference genomes57, or
creating an extended reference genome that includes sequence containing alternate alleles64.
Alternatively, a slight modification of software utilizing hash-tables can create allele-aware
aligners which also correct for reference mapping biases55,56,74. Advantages and disadvantages
of each reference mapping bias correction strategy are discussed in more detail below.
1.6.1 Biased mismatch threshold
The simplest proposed correction for the reference mapping bias is to use a biased
mismatch threshold. To overcome the reference bias, this approach uses a stricter mismatch
threshold for reads containing the reference allele when calculating allelic imbalance. Reads
containing the non-reference allele are allowed an additional mismatch compared to reads
containing the reference. For example, if reads containing the reference allele are allowed one
mismatch then reads containing the non-reference allele are allowed to have one or two
mismatches to account for the mismatching non-reference allele. The main advantage of this
approach is that sequence mapping can be performed with any mapping software using a single
reference sequence and without requiring any modifications to the reference. This approach
overcomes mapping biases at a majority of heterozygous sites, but is at a disadvantage when
removing bias in regions containing more heterozygous sites than the relaxed mismatch
threshold. In these cases, reads containing the reference allele may match perfectly and map
9
the extra mismatches in these reads containing the non-reference allele may cause the reads to
map equally as well to incorrect locations, which is especially problematic when only
considering reads mapping to a single location.
1.6.2 Variant masking
Masking known variant sites during sequence alignment is also a fairly simple strategy.
Any bases mapping to masked variants mismatch the genome, and the reads are equally likely
to be mapped correctly regardless of the allele present. The masked variants can be known
heterozygous sites in the sample, or simply sites from a database of known variants, making
this approach advantageous for removing bias in the absence of sample-specific genotype
information. Other advantages of this approach are that only a single alignment is required per
dataset and in many cases only a single reference genome is required to map sequences from
multiple samples. A disadvantage of this approach, particularly when mapping samples with low
sequencing depth, is its effect on the number of reads aligned. Masking variants introduces
mismatches into reads originating from the heterozygous site, and could cause reads containing
sequencing errors to fail to map to the masked genome because of these additional
mismatches. The reduced number of reads aligning to these sites decreases power to identify
allelic imbalance. When masking all known variants in the absence of genotype information this
approach also unnecessarily reduces the number of reads mapped to homozygous sites that
have no need for bias correction.
1.6.3 Dual reference genomes
The dual reference strategy to remove reference mapping biases utilizes complete
sample genotype information. Most often, sample genotypes are generated using
whole-genome DNA sequencing and subsequent variant calling35,75. In these cases, phased genotypes
10
of the maternal and paternal chromosomes. Sequence reads are aligned to each reference
separately and the alignments are merged to ensure that each sequence read is only
represented once. In the absence of phased genotypes, each reference can contain one of the
alleles at each known heterozygous sites identified by imputation, or simply at known variants
sites identified within a population of individuals. When using phased genotypes, the dual
reference strategy is particularly accurate at regions where a single read overlaps multiple
variant sites, because the phased genomes best account for variants in LD and most accurately
represent the sequence of the chromosome of origin. Additionally, once created, the reference
sequence can be used to align sequences of any length, and with any alignment software. A
disadvantage of this strategy is the added computation time of the second sequence alignment
and the complexity of merging the alignments to create a single consensus alignment.
Additionally, any changes in the genotype information require recreating the dual references.
Finally, for the most accurate bias correction, this strategy is limited to processing the small
number of samples that also have complete genotype information from whole-genome
sequencing.
1.6.4 Modified dual reference genome
A modified dual reference strategy extends the standard dual reference strategy to allow
for mapping bias correction in samples lacking complete genotype information. In this method,
an initial non-allele-aware alignment of the quantitative sequence data is used to identify
heterozygous sites in the sequenced sample57. As with the dual reference strategy, two
reference genomes are then created to represent each allele at these heterozygous sites and
sequences are aligned separately to each reference. While this modified method is
advantageous in correcting reference mapping biases at heterozygous sites without prior
genotype knowledge, it does so at the cost of an additional alignment, bringing the total number
11
strategy capture both alleles at heterozygous sites, they are less successful at capturing LD and
are not representative of the maternal and paternal chromosomes. Additionally, this method
relies on detecting variants in the sequence data, which can be difficult, especially at sites of
allelic imbalance76.
1.6.5 Allele-aware reference creation
Mapping bias can also be removed during a single alignment by creating an allele-aware
reference sequence. In this strategy, reference sequence containing the non-reference allele is
appended to the reference genome, allowing for reads to be compared to regions containing
each allele using a single extended reference genome. An advantage of his strategy is that
mapping biases can corrected using any sequence mapping software, a single reference
genome, and a single alignment. A disadvantage of this approach is that reference creation
depends directly on sequence length and the genotypes or variant information used. Any
changes in either of these parameters require recreation of the reference sequence.
Additionally, more computation is required to reconcile reads aligning to the normal and
extended regions of the reference sequence. Combined with the added time required to extend
the reference sequence, this strategy is particularly disadvantageous when mapping sequence
reads using different allele-aware sites (i.e. heterozygous sites from different individuals) or
sequence read lengths (i,e. sequences from different assays).
1.6.6 Allele-aware aligner
Similar to the biases mismatch, variant masking and extended reference strategies,
allele-aware aligners can remove mapping biases with a single alignment. Utilizing the hash
table structure during mapping, these aligners compare sequence reads to reference sequence
containing each of the two alleles at specified sites. These sites, can be known variants or
12
sequence read length may require the reference sequence to be reprocessed before alignment,
the actual reference sequence itself does not need to change. This is advantageous for
reference bias correction using the same reference sequence and different sets of allele-aware
sites, or sequence reads with varying lengths. Additionally, allele-aware aligners only require a
single alignment, without the need for additional computation to create a consensus alignment.
This strategy is currently limited to software utilizing hash-tables and read mapping can be
considerably slower than the suffix array-based alternatives. The reduction in speed becomes
disadvantageous if the computation time required for a single allele-aware alignment exceeds
the time required for the reference creation, sequence alignment, and consensus alignment
creation steps of other strategies.
1.7 Overview of this work
Quantitative sequence data from functional genomics experiments has been
instrumental in understanding the regulatory mechanisms influencing gene transcription and the
influences of genetic variation on these mechanisms and, ultimately, cardiometabolic traits and
diseases. Despite the massive effort to generate and interpret quantitative sequence data, large
gaps remain in the understanding of gene transcription regulation at the cardiometabolic
phenotype-associated loci, especially at the variant level. Limited understanding of the
contributions of genetic variants to transcriptional regulation is caused in part by reference
mapping biases, which are present in a majority of existing analyses. Removing these mapping
biases allows for more accurate regulatory element identification, and a clearer understanding
of how genetic variants influence gene transcription regulatory mechanisms.
In Chapter 2 of this work, I investigate the effects of these reference mapping biases and
describe a pipeline, Allele-Aware ALignments for the Investigation of GeNetic Effects on
Regulation (AA-ALIGNER), which can be used to remove mapping biases in any quantitative
13
bias in either the presence or absence of genotype data. In addition to sample genotype
availability, I present a thorough exploration of how experimental conditions and analytical
parameters influence the accuracy of allelic imbalance detection. Additionally, I describe sites of
allelic imbalance located at inflammatory bowel disease-associated variants, demonstrating the
utility of AA-ALIGNER in predicting allelic differences in protein binding at disease-associated
loci.
In Chapter 3, I expand allelic imbalance detection with AA-ALIGNER into quantitative
sequence data from cell lines and primary cells relevant to cardiometabolic traits and diseases. I
summarize imbalance detection in adipose and liver cell lines, and primary pancreatic islets.
Additionally, I discuss biological insights gained from imbalance detection in 70 experiments
from HepG2 cells. I also describe sites of allelic imbalance identified at loci associated with
gene transcription levels and/or cardiometabolic phenotypes.
Lastly, in Chapter 4 I summarize conclusions gained from this work and offer a glimpse
into the future of using quantitative sequence data, specifically allelic imbalance identification, to
understand the influence of genetic factors on cardiometabolic traits and diseases.
14
DISEASE-ASSOCIATED LOCI 2.1 Background1
Genetic studies of complex traits and diseases have been increasing their focus on the
contribution of gene transcriptional regulation. The majority of complex trait-associated variants
are in non-coding regions 22, suggesting many contribute by altering regulatory activity. Variants
can alter transcription factor binding affinity, subsequently affecting transcription levels of target
genes 22. For example, the T allele of rs12740374increases C/EBPa binding and transcription
of SORT1, a gene influencing LDL cholesterol level 23. Identifying precisely which genetic
variants are responsible for changing regulatory activity can be difficult.
Quantitative short-read sequence data generated from experiments such as ChIP-seq 77,
DNase-seq 38, FAIRE-seq 37, and ATAC-seq 39 broadly identify genomic regions that regulate
gene transcription. Sequence information from these experiments can be used to detect
allele-specific activity in samples where heterozygous variants are present in or near a regulatory
element. For example, an uneven distribution in the number of reads containing each allele at a
heterozygous site, referred to as allelic imbalance, provides evidence for differential regulatory
activity due to genetic variation. Previous studies have also used quantitative short-read data to
correlate genetic variation in regulatory regions with nearby gene expression 55,56 and to show
the heritability of allelic regulatory effects 56,59,78–80.
1This chapter has been accepted for publication in BMC Medical Genomics. Citation:
15
Quantitative sequence data have been generated in hundreds of cell types and tissues
by the ENCODE (Encyclopedia of DNA elements) Consortium 40 and Roadmap Epigenomics
Project 43, offering a valuable source of genetic regulatory information. Exploration of allelic
imbalance in this data is hindered by a lack of complete genotype information for individuals
from which these data are derived, and the well-established alignment bias that arises when
both alleles at a heterozygous site are not considered during alignment to a reference genome.
Sequence reads containing the allele not represented in the reference genome are penalized as
an additional mismatch compared to reads containing the reference allele 72, and are less likely
to map to the correct genomic location. This can result in false detection of allelic imbalance
favoring the reference allele, or failure to detect imbalance favoring the non-reference allele.
Several methods for removing this alignment bias have been proposed, including masking
known variants in the reference genome 72, aligning reads to two haplotype reference genomes
57,58,60–62,73, using known variants with allele-aware aligners 55,56,74 or creating an extended
reference genome that included alternate alleles 64. For these methods, full genotype
information leads to the best results, but this data is rarely available. The performance of these
methods using limited or no sample genotype data, compared to full genotype information has
not been thoroughly investigated.
To evaluate detection of altered regulatory activity due to genetic variation in quantitative
sequence data using full, limited or no genotype information, we created a computational
analysis pipeline, called AA-ALIGNER (Allele-Aware ALignments for the Investigation of
GeNetic Effects on Regulation). AA-ALIGNER strategically incorporates existing, publicly
available tools to accurately annotate regions containing heterozygous variants given varying
levels of genotype information, including no genotypes. To remove alignment biases at
heterozygous variants, AA-ALIGNER uses the allele-aware aligner GSNAP 70 which has been
previously shown to remove mapping biases using complete genotype information 74.
16
incorrect heterozygous site annotations in reference genome sequences and incorrectly
detected imbalances due to differences in mappability between reads containing each of the
alleles or due to PCR duplications introduced during sequencing 81.
We demonstrate that GSNAP also removes mapping biases using partial genotype data
or common variants allowing for accurate identification of allelic imbalances. Using
AA-ALIGNER, we determined the effect of experimental and analytical variables such as sequence
read length, sequencing depth, number of mismatches allowed during alignment, and
imputation quality thresholds on accurate allelic imbalance detection. Our analyses used data
from one DNase-seq and thirteen ChIP-seq experiments generated in the GM12878
lymphoblastoid cell line, for which both complete, sequencing-based genotype and partial,
array-based genotype information is available. We experimentally detected differential protein
binding at six of nine tested imbalance predictions from AA-ALIGNER for CREB1 (Cyclic-AMP
Responsive Element Binding protein 1) binding in GM12878 ChIP-seq data, including
imbalances at two disease-associated loci. Overall, our results provide important empirical data
that can be used to guide the design of and interpretation of similar studies using AA-ALIGNER
to accurately annotate heterozygous sites and detect genetically-driven changes in regulatory
element activity.
2.2 Results
2.2.1 Overview of AA-ALIGNER
The AA-ALIGNER pipeline is designed to maximize short-read sequence alignment
accuracy at sites of DNA variation regardless of genotype availability. These alignments can be
used to identify potential sites of regulatory activity, indicated by an enrichment of aligned reads
and referred to as peaks, and of allelic imbalance at these sites (Figure 2.1). We first construct a sample-specific custom reference genome in a two-step process. To increase the likelihood
17
common variants in the standard reference are modified as needed to the most common allele
from a particular population, such as the 1000 Genomes European samples [26]. In a second
step, all available genotype information from the sequenced sample is used to further customize
this reference sequence such that: (i) at homozygous variants, the sample allele is present; and
(ii) at heterozygous sites, one of the two sample alleles is present. Alternate alleles at
heterozygous sites are recorded in a separate file during this process. When no genotype
information is available, this alternate allele file contains all common minor alleles (MAF > 0.05)
for the selected population.
Next, we filter sequence reads to remove low quality sequences and align them to the
custom reference genome using GSNAP 70, an allele-aware aligner. GSNAP takes as input the
file containing reference and non-reference alternate alleles to equally consider alignments to
both alleles. After alignment, we filter (i) sequences aligned to more than one genomic location;
(ii) sequences aligned to regions underrepresented in the reference sequence (ENCODE
blacklisted regions); and (iii) duplicate reads to correct for PCR artifacts. These final alignments
are used to identify peaks and sites of allelic imbalance.
When testing for imbalances, AA-ALIGNER includes predicted heterozygous sites not
included in the initial custom reference during sequence alignment. New heterozygous sites are
predicted based on having a minimum number of reads containing each of two alleles. In
addition, a minimum read threshold per allele can be applied to all heterozygous sites during
imbalance detection to guard against incorrectly annotated heterozygous sites. While predicted
heterozygous sites are not included in the initial reference genome customization (Figure 2.1, Box 1) or sequence alignment steps (Figure 2.1, Box 3), they can be added in a second round of reference customization and alignment if desired.
AA-ALIGNER is designed to correct for multiple sources of bias in the data whenever
possible. Increasing the minimum read threshold required to test for an imbalance can guard
18
one allele map uniquely while reads containing the other allele map to multiple locations and are
filtered, may result in an artificial imbalance. AA-ALIGNER only considers reads that map
uniquely to the same position in the genome regardless of the allele present. Post alignment
filtering of duplicate reads corrects for biases that can arise from PCR duplication during library
preparation.
AA-ALIGNER allows key parameters to be specified that influence sequence alignment
and post-alignment steps, such as imbalance detection. The minimum read threshold for each
allele is one of these parameters. In addition, allowed mismatches can be restricted to predicted
heterozygous sites to increase confidence in evidence for multiple alleles. By default,
significance of allelic imbalances is determined using a standard binomial test, but the
AA-ALIGNER pipeline can be easily modified to incorporate alternative statistical methods of
detecting imbalance. Peaks are determined here using SPP [27]. Additional details for individual
steps can be found in the Methods. Unless otherwise indicated, the following results are based
on alignments allowing for one mismatch, with a minimum of five reads required for each allele,
and a nominal binomial p-value threshold of 0.01 for allelic imbalance detection. Each of these
parameters is evaluated in detail in the following sections.
2.2.2 Using GSNAP removes alignment biases at heterozygous sites
We first evaluated the ability of GSNAP to overcome the reference alignment bias. We
used 50 base pair (bp) CREB1 ChIP-seq reads generated in the GM12878 lymphoblastoid cell
line by the HudsonAlpha Institute of Biotechnology as part of the ENCODE project. We created
a custom GM12878 reference sequence based on a complete set of genotypes generated by
the Broad Institute 83, and we created a GSNAP input file with non-reference alleles for each
heterozygous site. To examine whether both alleles at heterozygous sites were equally
considered during alignments, we also created a “complement” reference sequence by
19
allele from the input file. We compared sequence alignments to these two reference sequences
using three metrics: reads mapped to heterozygous sites; sequence enrichment peaks called at
heterozygous sites; and sites of allelic imbalance (Table 2.1). Only 120 of the 33.6 million (0.0003%) reads were aligned differently between the two alignments. Manual inspection
indicated that these discrepancies were due to GSNAP failing to remove alignment bias when
aligning sequences to regions containing more than 5 and as many as 16 heterozygous sites.
These 120 differences did not affect the number of peaks or the predicted sites of allelic
imbalances identified (Table 2.1). These data demonstrate that using GSNAP, AA-ALIGNER overcomes the alignment bias.
To quantify the importance of removing the alignment bias, we used the same metrics to
compare allele-aware and non-allele-aware alignments using the same reference sequences.
We used BWA for non-allele-aware alignments with the same alignment parameters as GSNAP.
By considering alternate alleles, GSNAP (1.3M reads) aligned 8% more reads to heterozygous
sites than BWA (1.2M reads; Table 2.1). As expected, GSNAP aligned a larger percentage of reads containing the non-reference allele compared to BWA (48% to 43%), more closely
reflecting the expectation that each allele should be present in equal numbers of reads.
Additionally, we aligned sequence reads to the complement reference using BWA. In contrast to
GSNAP, we found that BWA aligned 344K (1.0%) reads differently to the complement and
reference genomes. Greater than 54% of reads mapped to the reference allele at heterozygous
sites in both BWA alignments (Table 2.1), demonstrating the effect of alignment bias on non-allele-aware alignments.
We examined, separately, the effect of biased alignments at heterozygous sites on peak
and allelic imbalance detection. Among the top 10,000 peaks with the greatest signal
enrichment for each alignment method, using GSNAP identified 1.6% more peaks overlapping a
heterozygous site than BWA and predicted 32% more allelic imbalances. Further, 54% of
BWA-20
identified imbalance sites (Table 2.1). Additionally, the reference allele was enriched in 82% (23/28) of imbalances only detected when using BWA, compared to 49% (39/79) of imbalances
unique to GSNAP alignments. The majority of BWA imbalances favored the reference allele in
both the standard reference and the complement reference, demonstrating the presence of
significant alignment bias. Together, these results demonstrate that alignment biases negatively
impact accurate sequence alignment, peak calling and allelic imbalance identification.
2.2.3 AA-ALIGNER identifies sites of allelic imbalance using partial genotypes or common variant information
Complete genotypes are not available for most samples. Therefore, we evaluated how
well AA-ALIGNER reproduced allelic imbalance annotations using incomplete genotype
information. We separately aligned the same 50 bp CREB1 ChIP-seq reads to custom
GM12878 reference genomes derived using (i) partial genotypes determined using the
Human1M-Duo BeadChip array and imputed using MachAdmix 84; and (ii) 1000 Genomes
common variants (EUR, MAF>.05) to model the case of no available genotype information.
Using allelic imbalances identified with complete genotype information to define true positive
(TP), false positive (FP), and false negative (FN) sites, we calculated sensitivity (TP/TP+FN)
and precision (TP/FP+TP), or positive predictive value.
Similar numbers of imbalances were identified using all three levels of genotype
information (Table 2.2). Interestingly, we found that when simply including common variant alleles (no available genotypes), we detected imbalances with similar sensitivity (>73%) and
precision (>75%) as with partial genotype information (Table 2.2). Including alleles of common variants with GSNAP significantly improved alignment performance compared to BWA with no
variant information (Table 2.3), even though neither alignment includes any information about the sample’s genotype. This improvement results from sites where including both alleles during
21
using complete genotypes, 125 were present in the partial genotypes and 141 were common
variants. Considering only these 125 and 141 sites, we find that sensitivity is 97% and 94% with
90% and 82.5% precision, respectively. In stark contrast, sensitivity of detection is 33% (partial)
and 34% (common) with 45% and 47% precision at other predicted heterozygous sites, defined
as sites with 5 or more reads containing each allele.
We considered whether poor performance at predicted heterozygous sites was due to
either (i) incorrect identification of homozygous sites as heterozygous using sequencing data 76;
or (ii) incorrect classification of balanced heterozygous sites as imbalanced due to alignment
biases. By comparing the complete genotypes from genomic sequencing to imbalances at sites
predicted to be heterozygous in the sequence data, we found that of the sites incorrectly
predicted to be imbalanced, 58% (18 of 31) using partial genotypes and 83% (19 of 23) using
common variants were not heterozygous. When using complete genotype information,
AA-ALIGNER does not report imbalances at predicted heterozygous sites. Of the imbalanced sites,
61% (11/18) using partial genotypes and 42% (8/19) using common variants were also
imbalanced when using complete genotypes, underscoring the difficulty in using short reads to
detect imbalances at predicted heterozygous sites. We incorrectly detected imbalance at 13
sites using partial genotypes and 4 sites using common variants because an increase or
decrease in aligned reads containing one allele now caused the site to pass the significance
threshold for imbalance.
We tested whether a more stringent binomial p-value threshold than 0.01 would improve
performance, by reducing errors resulting from condition (ii). As expected, a stricter threshold
reduced the number of imbalances detected, but it also decreased sensitivity and precision
(Table 2.4), especially at predicted heterozygous sites. Additionally, we found at predicted heterozygous sites the p-values of false positive imbalance sites were more significant than the
p-values of true positives sites when using partial genotypes (Mann-Whitney U P=.003) and
22
imbalance detection result more commonly from incorrect prediction of heterozygous sites than
falsely calling imbalances at true heterozygous sites.
In addition to a binomial test, other statistical methods of detecting allelic imbalance
have been used to measure the significance of allelic imbalance 62,74,81. For example, a
beta-binomial test is commonly used to correct for inaccurate imbalance detection caused by over
dispersion of the data. Using a beta-binomial test (P<.01) for the 50bp pair CREB1 ChIP-seq
data reduced the number of sites of allelic imbalance identified by 82-83% using complete,
partial or no genotype information (Table 2.4). Overall sensitivity and precision of imbalance detection using partial or no genotypes declined to ~50%. Sensitivity and precision remained
higher at imputed heterozygous sites (partial genotype alignment) and common variants (no
genotype alignment) than predicted and uncommon variants as before. This reduction in the
sensitivity and precision of imbalance detection is similar to the reduction seen when using a
stricter binomial p-value threshold and is likely related to the increased p-values of false positive
sites reported above.
We also considered whether common variants could be annotated more accurately than
rare variants due simply to how sequences were aligned to these sites. Using BWA alignments
that did not include any variant information, we predicted heterozygous sites and allelic
imbalances as above. If we separate these predictions into those sites that are and are not
common variants, we find that the sensitivity and precision are significantly higher for common
variants (Table 2.3), although still lower than when both alleles were included in the alignment.
2.2.4 Second alignment provides only modest improvement in sensitivity and precision for incomplete genotypes
Previously, Ni et al. 57 described a strategy for detecting allelic imbalance that first
23
performs a second, allele-aware alignment including the predicted variants. We tested whether
a similar second alignment would boost the sensitivity and precision of allelic imbalance
identification at predicted heterozygous sites. Before the second alignment, the customized
reference was updated to ensure that one allele was present at each heterozygous site
predicted in the initial alignment, and non-reference alleles were added to the separate variant
file. Reads were then re-aligned using this updated variant file and reference, and filtered as
before.
Considering the CREB1 data with partial genotype information, this second alignment
identified 11 additional correct sites of allelic imbalance while eliminating 6 incorrect sites,
increasing the sensitivity to 47% and precision to 58% at predicted heterozygous sites (Table 2.2). When using common alleles, two additional correct imbalances were found and one incorrect site eliminated, with little change in sensitivity and precision. While a second,
allele-aware alignment increases accuracy at predicted heterozygous sites, these modest gains, still
accompanied by a high rate of false discovery, require an additional alignment. For all other
analyses, we report imbalances detected after a single alignment.
2.2.5 Shorter read length and lower sequencing depth reduce the number of imbalance predictions but not precision or sensitivity
Most existing ChIP-seq datasets, such as from ENCODE, contain sequence reads
shorter than 50 bp. We investigated how read length affects the ability of AA-ALIGNER to
identify sites of allelic imbalance by trimming the 3’ end of each 50 bp CREB1 ChIP-seq
sequence to create 35 bp and 20 bp reads and then aligned these as before. Trimming reduced
the overall number of sequenced bases considered by 30% and 60%, respectively. The total
number of aligned reads decreased by 3.7% in the 35 bp alignment and 16.7% in the 20 bp
alignment, further reducing total base coverage. The number of reads overlapping heterozygous
24
reduction in number of identified allelic imbalances for 35 bp (106 imbalances; 47.0% reduction)
and 20 bp (26 imbalances; 86.6% reduction) reads (Table 2.2, Figure 2.3B).
To determine whether reduced allelic imbalance detection was simply due to lower
overall base coverage, we randomly sampled 70% and 40% of the 50 bp reads to match total
base coverage levels for the above experiments using 35 bp and 20 bp reads. We found that
the number of reads aligned to heterozygous sites decreased, as did imbalances identified, at
the same rate as with the shorter reads (Figure 2.3C). Thus, reducing base coverage had a proportionate effect on allelic imbalance identification compared to reduction in mapping to
heterozygous sites. In our original analysis using all 50 bp reads, we noted 22.5% of sites
passed the threshold for the minimum number of reads required for each allele to be tested for
imbalance by three reads or less (Figure 2.3D). As base coverage is reduced, a disproportionate number of these sites then fall below that threshold (N=5).
As expected, the overall number of predicted imbalance sites also decreased with base
coverage when using complete genotypes. Compared to the imbalances detected with complete
genotypes for each read length, the sensitivity of imbalance calls using partial genotypes or
common variants remained greater than 69% and the precision greater than 75%. These data
demonstrate that AA-ALIGNER maintains high detection accuracy using partial genotypes or
common variants compared to complete genotypes with reduced base coverage.
2.2.6 Number of imbalances identified varies across factors and assays
To ensure that the results from the CREB1 dataset were representative of results from
other experiments, we used AA-ALIGNER to predict allelic imbalance in twelve additional
transcription factor ChIP-seq datasets and one DNase-seq dataset generated in the same
GM12878 cell line. ChIP-seq datasets contained between 14 and 48 million aligned reads, and
most reads were 36 bp in length. Overall, we found that for all alignments, imbalance
25
were used in the alignment. Imbalances at new heterozygous sites were again very poorly
predicted (Table 2.5).
Although the precision of imbalance detection using partial genotypes and common
variants was high across datasets, the number of imbalances detected varied greatly
(minimum=0, maximum=291, median 19). Read length and sequencing depth influence the
ability of AA-ALIGNER to identify sites of imbalance (Figure 2.3). We found, though, that measurements related to these characteristics (Figure 2.4A-C) were not highly correlated with the number of imbalances detected in these ChIP-seq datasets (0.43 ≥ Pearson R2 ≥ 0.51).
These low correlations suggest that other factors, such as the number of transcription factor
binding sites (TFBS) across the genome and their overall genomic coverage also influenced
imbalance detection. Alone, TFBS genomic coverage (Figure 2.4D) showed low correlation with the number of imbalances detected (Pearson R2=.35), but measurements that considered
sequencing depth, read length and genomic coverage together (Figure 2.4E-G) were highly
correlated with the number of imbalances detected (0.78 ≥ Pearson R2 ≥ 0.91). These
correlations suggest that the dispersion of sequence signal across the genome needs to be
considered in addition to read length and sequencing depth when evaluating the potential of
AA-ALIGNER to identify allelic imbalances. While there was a positive correlation between
sequencing depth and signal dispersion in ChIP-seq data, the DNase-seq data, had greater
sequencing depth (aligned reads) and signal dispersion (genomic coverage), but fewer sites of
allelic imbalance identified than some of the ChIP-seq data. These results suggest that
sequencing depth and signal dispersion influence imbalance in DNase-seq data differently and
26
2.2.7 Allowing additional alignment mismatches increases sensitivity but decreases precision
Parameters for the different steps of allelic imbalance identification vary across reported
methods and can significantly affect results. Increasing allowed alignment mismatches helps
overcome missing genotypes, inaccuracies in the reference genome, and errors in the
sequence reads, but also results in increased erroneous sequence alignment, particularly when
aligning shorter reads. We examined how this parameter affected the performance of
AA-ALIGNER with limited genotype information. The 50 bp CREB1 data was processed with
complete genotypes, partial genotypes, and common variant information allowing 0, 1, 2 or 3
alignment mismatches. With complete genotype information, the number of imbalances
increased only slightly with greater mismatches (<4%; Table 2.2).
When using partial genotypes or common variants, aligning with zero mismatches
reduced the number of incorrectly aligned reads compared with our default of one mismatch, but
at the cost of eliminating reads containing the non-reference allele at heterozygous sites not
included during alignment. This led to increased overall precision of imbalance identification, but
with significant loss of sensitivity as novel variants could not be predicted (Table 2). Of note, the precision of imbalance detection at known variants using zero mismatches was lower than when
allowing one mismatch. Allowing two or three mismatches increased the number of imbalance
sites identified using incomplete genotypes by more than 29% (Table 2.2). The precision at variants included in the alignment did not change, but was greatly reduced at predicted variants,
indicating less stringent mismatch thresholds increase the number of misaligned reads resulting
in spurious predictions of heterozygous sites and allelic imbalance at these sites. We also
tested whether requiring one of the mismatches to be located at the predicted heterozygous site
increased sensitivity and precision compared to allowing mismatches at any site and found that