O R I G I N A L A R T I C L E
Process assessment in dynamic testing using electronic
tangibles
Jochanan Veerbeek
1|
Bart Vogelaar
1|
Janneke Verhaegh
2|
Wilma C.M. Resing
11
Faculty of Social Sciences, Department of Developmental and Educational Psychology, Leiden University, Leiden, The Netherlands
2
Zwijsen BV, Tilburg, The Netherlands
Correspondence
Wilma C. M. Resing, Faculty of Social Sciences, Department of Psychology, Section Developmental and Educational Psychology, Leiden University, P.O. Box 9555, 2300 RB Leiden, The Netherlands.
Email: [email protected]
Abstract
Task solving processes and changes in these processes have long been expected to
provide valuable information about children's performance in school. This article used
electronic tangibles (concrete materials that can be physically manipulated) and a
dynamic testing format (pretest, training, and posttest) to investigate children's task
solving processes and changes in these processes as a result of training. We also
evaluated the value of process information for the prediction of school results.
Partic-ipants were
N
= 253 children with a mean age of 7.8 years. Half of them received a
graduated prompts training; the other half received repeated practice only. Three
pro-cess measures were used: grouping behaviour, verbalized strategies, and completion
time. Different measures showed different effects of training, with verbalized
strate-gies showing the largest difference on the posttest between trained and untrained
children. Although process measures were related to performance on our dynamic
task and to math and reading performance in school, the amount of help provided
during training provided the most predictive value to school results. We concluded
that children's task solving processes provide valuable information, but the
interpreta-tion requires more research.
K E Y W O R D S
dynamic testing, inductive reasoning, log file analysis, process assessment, series completion,
tangible user interface
1
|I N T R O D U C T I O N
In both clinical and educational settings, cognitive ability tests are
often used when questions regarding the overall cognitive or learning
abilities of pupils have to be answered (Fiorello et al., 2007). Although
these instruments are said to offer the best available prediction of
school achievements and, to a lesser extent, job performance
(Richard-son & Norgate, 2015), intelligence test scores are only modestly
related to school achievement and, therefore, a great deal of variance
in school performance remains unexplained (Fiorello et al., 2007;
Neisser et al., 1996; Richardson & Norgate, 2015; Sternberg, 1997).
Intelligence tests have been subject to criticism, because
these instruments usually have a static test format, with only one
mea-surement moment, without providing feedback, and are therefore said
to measure what a child already knows. In addition, scores on these
tests provide only limited information on how children solve the test
problems (Campione, 1989; Elliott, Grigorenko, & Resing, 2010).
Moreover, to evaluate children's ability to learn, not only already
-This is an open access article under the terms of the Creative Commons Attribution License, which permits use, distribution and reproduction in any medium, provided the original work is properly cited.
© 2018 The Authors.Journal of Computer Assisted LearningPublished by John Wiley & Sons, Ltd.
DOI: 10.1111/jcal.12318
acquired knowledge and skills have to be assessed, but also their
potential to learn when the opportunity is presented (Grigorenko &
Sternberg, 1998; Sternberg & Grigorenko, 2002). These criticisms led
to the development of dynamic testing, which involves testing
proce-dures in which a training session is incorporated to assess the child's
response to a learning opportunity (e.g., Kozulin, 2011; Lidz, 2014;
Resing, 2013; Sternberg & Grigorenko, 2002; Stringer, 2018). To
improve the predictive validity of traditional tests, some researchers
argued that an additional analysis of the task solving process would
provide valuable information regarding cognitive potential (Resing &
Elliott, 2011; Resing, Xenidou‐Dervou, Steijn, & Elliott, 2012; Sternberg,
& Grigorenko, 2002). Both the assessment of the child's progression in
task solving, including the use of electronic tangibles, and the
evalua-tion of this task solving process were the foci of the process‐oriented
dynamic testing procedures used in the current study. In the current
paper, task solving processes were defined as the task‐oriented
behaviours children employed during inductive reasoning task solving.
1.1
|Dynamic testing and graduated prompts
procedure
Whereas static tests do not include training beyond repeated
instruction or, in most cases, do not contain explanations or feedback
regarding the correctness of answers, dynamic testing incorporates an
instruction moment in the form of feedback, training, or scaffolding.
Dynamic testing can be utilized not only to measure progression in task
solving, in terms of accuracy scores on the task considered, but also to
assess the processes involved in learning how to solve these problems
(Elliott, Resing, & Beckmann, 2018; Haywood & Lidz, 2007; Resing &
Elliott, 2011; Sternberg & Grigorenko, 2002). Over the years, several
different formats have been developed for dynamic testing (Haywood
& Lidz, 2007; Lidz, 2014; Sternberg & Grigorenko, 2002). Formats
range from relatively unstructured, with a great emphasis on the
exam-iners' possibility to provide unique individualized instruction at any
point the examiner deems necessary, to completely standardized (e.g.,
Campione, Brown, Ferrara, Jones, & Steinberg, 1985; Resing, 1998).
Dynamic tests have been implemented in a variety of domains including
academic subjects and language development (Elliott et al., 2018), with
a range of available testing instruments to target the domain of
interest (Haywood & Lidz, 2007; Sternberg & Grigorenko, 2002).
In some of the more structured formats, for example, apretest,
training, and posttest design, children are provided with graduated
prompts as part of the instruction moment (Campione et al., 1985;
Fabio, 2005; Ferrara, Brown, & Campione, 1986; Sternberg &
Grigorenko, 2002). This procedure provides standardized help, in the
form of hints and prompts, which are presented to children if they
can-not solve a problem independently. The graduated prompts approach
was originally designed to assess individual differences in the amount
and type of instruction needed to elicit the solving of tasks and was
fur-ther refined to find the degree of help a child needed to complete a task
successfully (Campione et al., 1985; Resing, 1993, 2000). Hints are
hierarchically ordered, from general, metacognitive prompts to
concrete, cognitive scaffolds. The method of training was found to lead
to greater improvement in task success than regular feedback,
especially for the children who had low initial scores (Stevenson,
Hickendorff, Resing, Heiser, & de Boeck, 2013). More importantly, both
the number of prompts and posttest scores were found to be good
predictors of future school success as well as an indicator of learning
potential (e.g., Caffrey, Fuchs, & Fuchs, 2008).
1.2
|Inductive reasoning and series completion
In many static and dynamic testing procedures, inductive reasoning
tasks are extensively used. The process of inductive reasoning requires
one to detect and formulate a general rule within a specific set of
elements (Klauer & Phye, 2008). Inductive reasoning ability is
consid-ered a core component of children's cognitive and scholastic
develop-ment (Molnár, Greiff, & Csapó, 2013; Perret, 2015; Resing & Elliott,
2011), and can be measured with a variety of tasks, such as analogies,
categorization, and series completion (Perret, 2015; Sternberg, 1985).
In the current study, schematic picture series completion tasks were
used, in which pictorial series had to be completed by inducing and
implementing solving rules. Simon and Kotovsky (1963) identified three
central components of the inductive reasoning task solving process: (a)
the detection of relations/transformations in the material, (b) the
identification of periodicity, and (c) the completion of the pattern.
Series completion tasks can be constructed with a range of
con-tents such as letters, numbers, and pictures. Letters and numbers have
a fixed, often familiar relationship to each other. Pictures and colours,
on the other hand, do not and, therefore, require more analysis of the
sequence to determine the relationship(s) and, in doing so, solve the
tasks (Resing & Elliott, 2011). Schematic pictures, as used in the
current study, can consist of several combined sets of transformations,
which are not necessarily related (e.g., Sternberg & Gardner, 1983),
and have a constructed response format. As opposed to multiple‐
choice items, constructed response items were found to be more
difficult to solve and to elicit more advanced and overt task problem
solving processes on a dynamic test of analogical reasoning in 5‐and
6‐year‐old children (Stevenson, Heiser, & Resing, 2016).
1.3
|Process
‐
oriented testing
When children or adults are first presented with a problem to solve,
they, in principle, attempt to understand it by creating an initial
problem representation. According to Robertson (2001), the efficiency
and accuracy of the task solving process are determined by the quality
of this representation. As argued by many researchers, this initial
representation is a crucial aspect of performance (Hunt, 1980; Pretz,
Naples, & Sternberg, 2003). As problem representation is said to
determine the strategies that are chosen to try and solve a problem,
an incorrect representation may result in the use of inaccurate
strategies (Alibali, Phillips, & Fischer, 2009; Pretz et al., 2003). The
prob-lem representation of a solver can potentially be improved as the result
of learning to use new solving strategies. Often, the extent to which
improvement is successful is believed to be dependent on the
availabil-ity and organization of the requested knowledge (Pretz et al., 2003).
Moreover, the notion of “problem space” was introduced by
Newell and Simon (1972), as a conceptualization of the problem
defi-nition and representation that contain all possible routes to a solution.
restructuring the problem into a set of smaller problems, which is also
called“means‐ends analysis.”This approach is thought to be
particu-larly helpful if no clear solving strategy is available (Robertson, 2001;
Weisberg, 2015). The ways in which a solver structures a problem,
for example, by analysing the sequence of solving steps or grouping
these answering steps in meaningful units, are thought to provide
valuable information about individual differences in problem solving.
However, most standard cognitive tests have not been constructed
to reveal this process information (Richard & Zamani, 2003).
Process‐oriented dynamic testing originated from an intention to
detect (individual) changes in strategy use as a result of training
(Resing & Elliott, 2011) and from the idea that examining strategy
use would enable an examiner to assess how a person's solving of a
task progresses. Examination of an individual's use of strategies,
offering information on which specific strategies might be used more
effectively, may provide valuable insight into what a person needs to
improve specific task performance (Greiff, Wüstenberg, & Avvisati,
2015). The pivotal role of strategy use in task performance has also
been highlighted by Siegler (2004, 2007). He found not only that
instability in strategy use over a short period of time is associated with
improvement in task performance (Siegler, 2004, 2007) but also that
this improvement seems connected to a person's ability to adapt
strat-egy use to the requirements of the situation (Hunt, 1980; Siegler,
1996). He concluded, however, that an individual's global strategy
pat-tern that was displayed throughout learning situations could be
char-acterized by a shift from less to more advanced strategy use (Siegler,
1996; Siegler & Svetina, 2006). Nevertheless, although more expert
reasoners appear to use more advanced strategies more frequently,
both simple and advanced strategies can produce accurate task
out-comes (Klauer & Phye, 2008). Recent studies have stressed that the
relationship between performance and strategy use could be mediated
by task difficulty (Goldhammer et al., 2014; Tenison, Fincham, &
Anderson, 2014).
In practice, however, process‐oriented testing has shown to be
challenging, because the sequential solving steps involved can quickly
become too much to analyse or are often difficult to interpret
(Zoanetti & Griffin, 2017). With the emergence of computers in the
educational and cognitive testing domains, it has become easier to
collect data regarding children's process of task solving. Computers
allow for monitoring an individual's progress, while providing
individ-ual learning experiences (Price, Jewitt, & Crescenzi, 2015; Verhaegh,
Fontijn, & Hoonhout, 2007). Although the opportunity to analyse
problem solving behaviour from digital log files has been praised since
the early days of computer‐based assessment, interpreting these files
in a meaningful way has proven to be difficult (Greiff et al., 2015;
Zoanetti & Griffin, 2017). As a result, the advantages offered by
com-puterized assessment appear to have hardly been exploited optimally.
1.4
|Aims and research questions
The current study sought to investigate the possibilities for process‐
oriented dynamic testing, using various ways of process measurement.
By combining these outcomes, we aimed to study the predictive
valid-ity of dynamic testing with regard to academic performance. We used
a dynamic testing format in which half the participating children were
subjected to training between pretest and posttest, to investigate
children's potential for learning in both the outcome and the process
of solving inductive reasoning tasks. In addition, we tested a rule‐
based automated scoring method developed to measure changes in
problem representation in children's inductive problem solving.
We first expected (Hypothesis 1) children's problem solving
processes and outcomes in series completion to progress to a
more sophisticated level. We expected (Hypothesis 1a) children to
show more accuracy in their series completion solving skills as a
result of a graduated prompts training, than as a result of repeated
practice (Resing & Elliott, 2011; Resing et al., 2012). Further, we
anticipated that (Hypothesis 1b) training would lead children to show
more grouping activities (separating groups of task elements) to make
completion of the series easier and that (Hypothesis 1c) training would
lead to more sophisticated verbalized strategy use (Resing et al.,
2012). We also expected (Hypothesis 1d) a decrease in the time spent
on the task as a result of more familiarity with the type and structure
of the tasks as a result of training (Tenison et al., 2014).
Second, we investigated children's shifts in the process of solving
the series completion tasks as a result of repeated practice and
train-ing, by distinguishing subgroups of children based on their initial task
solving processes. It was expected that the distribution of children
over the subgroups would change from pretest to posttest and that
trained children would move towards more sophisticated categories
of grouping behaviour than nontrained children (Hypothesis 2a). We
also expected trained children moving towards more advanced
verbal-ized strategy categories than nontrained children (Hypothesis 2b).
Third, we expected (Hypothesis 3a) process measures to be
related to accuracy on the series completion task and to children's
academic performance on mathematics and reading comprehension.
The process measures were expected to provide explanatory value
for academic performance on mathematics (Hypothesis 3b) and on
reading comprehension (Hypothesis 3c). In line with previous research
(Elliott, 2000; Greiff et al., 2013; Zoanetti & Griffin, 2017), we also
expected (Hypothesis 3d) dynamic test measures (scores) to provide
superior prediction over static measures regarding school performance
(Caffrey et al., 2008; Resing, 1993).
2
|M E T H O D
2.1
|Participants
The study employed 253 children, 134 boys and 119 girls
(M= 7.8 years;SD = 0.61 years). The children were recruited from
12 second grade classes in nine primary schools, all located in
mid-dle‐class socio‐economic status regions in the Netherlands. Informed
consent was obtained from both the teachers and the parents before
testing started. The research was approved by the ethics board of
the university. Fifteen children were not able to attend all sessions,
and therefore, their data were not included in the data for analysis.
2.2
|Design
A pretest–posttest control group design was used (see Table 1 for an
children to either the training (N= 126) or the control (N= 127)
con-dition. Blocking in pairs was, per school, based on children's scores on
the Raven's Standard Progressive Matrices (Raven, Raven, & Court,
1998), collected prior to the pretest session. Per pair, children were
randomly assigned to a condition and, then, were individually tested
during four sessions. Children who were assigned to the training
con-dition received a pretest, two training sessions, and a posttest. Control
group children received the same pretest and posttest but spent an
equal amount of time on visual–spatial dot‐completion tasks, instead
of receiving training sessions. Each session lasted approximately
30 min. Sessions took place weekly.
2.3
|Materials
2.3.1
|Raven's Standard Progressive Matrices
To assess the children's level of inductive reasoning ability before
test-ing, Raven's Standard Progressive Matrices was used (Raven et al.,
1998). The test consists of 60 items, progressing in difficulty. It
requires the children to detect which piece is missing and choose
the correct answer out of six to eight options based on the
character-istics and relationships in the item. The Raven test has an internal
con-sistency coefficient ofɑ= 0.83 and a split‐half coefficient ofr= 0.91.
2.3.2
|Scholastic achievement
The scores of the Dutch standardized, norm‐referenced tests of
scholastic achievement (Cito Math, Janssen, Hop, & Wouda, 2015,
and Cito Reading Comprehension, Jolink, Tomesen, Hilte, Weekers,
& Engelen, 2015) were provided by the participating schools. These
tests have been developed with the purpose of monitoring children's
progress on the school subjects. Children's achievement on the test
is scored on a scale that ranges from “A” to “E,” with “A” scores
representing the highest (25%) performance and “D”(15%) and“E”
representing the lowest (10%), compared with the average
perfor-mance of Dutch children of the same age (Janssen et al., 2015; Jolink
et al., 2015; Keuning et al., 2015). For two children, a Cito Math score
was not available; for 63 children, a Cito Reading Comprehension
score was not provided because their schools did not administer this
test. The reliability for mathematics (M4 [Grade 2]), defined in terms
of measurement accuracy, is MAcc = 0.93 (Janssen et al., 2015). For
reading comprehension (M4 [Grade 2]), the reliability in terms of
mea-surement accuracy is MAcc = 0.86 (Jolink et al., 2015).
2.3.3
|TagTiles console
A tangible user interface (TUI), TagTiles (Serious Toys, 2011), was
utilized for administering the dynamic test. The console consisted of
an electronic grid with 12 × 12 fields, which included sensors to detect
activity on its surface. The console was equipped with multicolour
LEDs, providing visual feedback, and audio playback, used for
instruc-tions and prompts during the pretest and posttest and the training.
To use the functionality of computer systems in monitoring
behav-iour and providing automated responses, but not be restricted to the
regular computer interface such as a mouse and keyboard, TUIs were
developed (Verhaegh, Resing, Jacobs, & Fontijn, 2009). These physical
objects allow for natural manipulation and have electronic sensors built
in to use some of the functionality of computers (Ullmer & Ishii, 2000).
These TUIs allow for monitoring the task solving process through the
physical manipulations of the solver (Verhaegh, Fontijn, et al., 2007).
They are easier to use by children, because the physical tangibles do
not require any interpretation or representation like PC interfaces do
(Verhaegh et al., 2009), thereby allowing for more accurate
measure-ment for assessmeasure-ment purposes (Verhaegh, Fontijn, Aarts, & Resing,
2013; Verhaegh, Fontijn, & Resing, 2013). The console enabled children
to work independently (Verhaegh, Hoonhout, & Fontijn, 2007), because
it was programmed not only to provide standardized instruction and
assistance as a response to the child's actions (Verhaegh, Fontijn, Aarts,
Boer, & van de Wouw, 2011), but also to record children's task solving
processes step‐by‐step (Henning, Verhaegh, & Resing, 2010).
2.3.4
|Dynamic test of schematic picture series
completion
To assess children's task solving process, a dynamic test version of a
pictorial (puppets) series completion task was used (Resing & Elliott,
2011; Resing, Touw, Veerbeek, & Elliott, 2017; Resing, Tunteler, &
Elliott, 2015; Resing et al., 2012). The puppet task has been designed
as a schematic picture series completion task with a constructed
response answering format. Each series consists of six puppet figures,
and the child has to provide the seventh (Figure 1). To solve the task,
the child has to detect the changes in the series, by looking for
mations in the task characteristics and the periodicity of the
transfor-mations. From this, the rule(s) underlying these changes has (have)
to be induced before the task can be solved (Resing & Elliott, 2011).
The child has to solve each series on the console, using coloured
blocks with RFID tags. Each puppet consists of seven body pieces, TABLE 1 Overview of procedures for training and control groups
Raven's Standard
Progressive Matrices Pretest Training 1 Training 2 Posttest
Training X X X X X
Control X X dots dots X
differing in colour (yellow, blue, green, and pink), pattern (plain, stripes,
and dots), and head (male and female). The task has varying levels of
difficulty, with gradually more changes in the periodicity and number
of transformations. The items were presented in a booklet, which
displayed one item per page.
2.3.5
|Pretest and posttest
The pretest and posttest both consist of 12 items and are equivalently
constructed. Each item on the pretest has a parallel item on the
post-test with the same transformations and periodicity (but,e.g., different
colours, patterns, or heads). Both the pretest and the posttest sessions
started with an example item presented and instructed by the console.
The two training sessions consisted of six items each. Scoring
was based on the accuracy of solving the items on the test. The
score consisted of the amount of correctly solved items on the
test, which could range between 0 and 12. The overall Pearson
corre-lation between pretest and posttest was (r= 0.54,p< 0.001), which,
as expected, was slightly higher for the control condition (r= 0.59,
p< 0.001) than for the training condition (r= 0.51,p< 0.001).
2.3.6
|Training
The graduated prompts training procedure that was utilized in the
dynamic test includes series that are equivalent to those used on the
pretest and posttest. During the two training sessions, the children
were given structured and standardized prompts, if they were not able
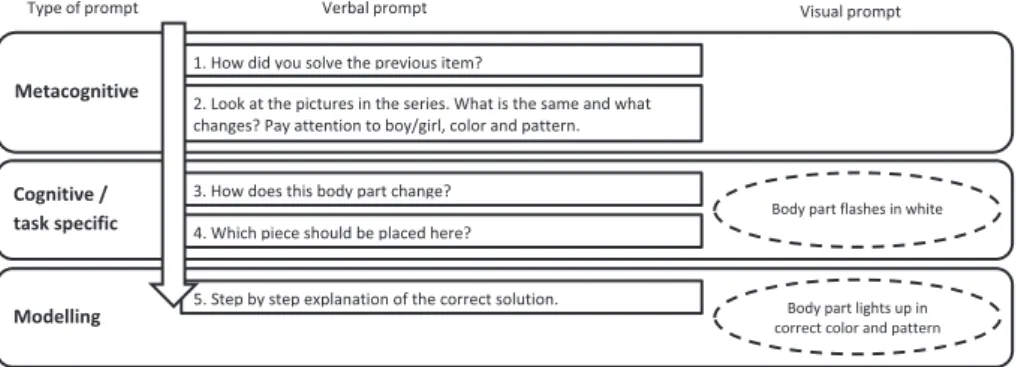
to solve an item independently. These prompts (see Figure 2) were
provided by the console, according to a structured, hierarchical
proce-dure that started with general, metacognitive prompts (Resing &
Elliott, 2011; Resing et al., 2017, 2012). The first two prompts were
aimed at activating prior knowledge and focusing attention to the task
characteristics. If these would not enable the child to solve the series,
more specific, cognitive prompts were given, after which, if necessary,
a scaffolding procedure was provided, followed by modelling of the
solving process. After solving a series, children were asked to tell
how they solved the task. The training procedure started with the
most difficult items, followed by less difficult items, to enable children
to apply their newly learned strategies at the end of the training
session (Resing & Elliott, 2011; Resing et al., 2012). To accompany
the verbal prompts provided by the console, visual clues were given.
The relevant puppet piece would light up to show children where their
attention had to be focused, and during the last stage, the verbal
modelling was accompanied by coloured lights and preprogrammed
answering patterns. A human test leader was present to escort the
children from and to the classroom. During testing, the test leader
recorded the placement of pieces and verbalizations given by the child,
providing a backup in case the electronic console would malfunction.
2.4
|Scoring
The variables recorded in the log files included the time of placement
for each piece and the identity and placement location of each piece
placed on the console surface. In addition, for each item, the log files
contained the number of correctly placed pieces, completion time,
and whether or not the answer that was provided was accurate. The
log files were cleared of irrelevant data, such as accidental movement
of pieces, or motoric difficulty in the correct placement of the pieces.
The relevant data were then imported into SPSS for further analysis. In
case of a computer malfunction, data were retrieved from the
manu-ally scored hardcopies. Additionmanu-ally, the manumanu-ally scored hardcopies
included a written record of children's explanations of their solutions.
These explanations were also recorded on audio, for which explicit
consent was given by the children's parents.
2.4.1
|Grouping of answer pieces
The process of solving series problems was operationalized as the way
in which the pieces composing the answer were grouped together.
Patterns in grouping of answer pieces (GAP) were assumed to measure
whether children were able to divide the problem they had to complete
into smaller pieces. In addition, it was analysed whether these “groupings”were related to the elements and transformations in the series. Which sequences of answer pieces were considered to be
ade-quate for accurately solving the series differed per item depended on
the elements and transformations that were involved in the series. In
our study, answer pieces were considered grouped if they were
succes-sively placed in an expected sequence. For each item, multiple groups
of pieces were discerned that were considered helpful when grouped
together. Detailed information on the expected groups can be found
in Appendix A. The scoring of the GAP was automated in Microsoft
Excel, using formulae to identify the sequences of answer pieces per
item. For each item, the number of placed groups was divided by the
maximum number of groups possible for solving that specific item,
which ranged between 2 and 5, depending on the transformations in
the item. The final GAP score was composed of the average proportion
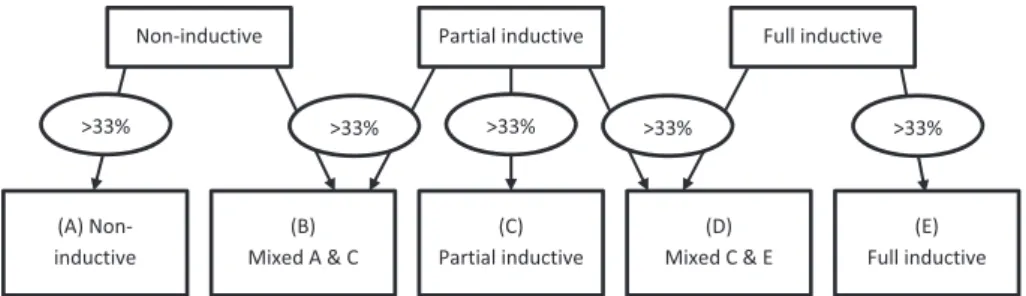
of groups placed for that testing session. Additionally, GAP categories
were discerned, to make visible shifts in the use of GAP. For each item,
the GAP was defined as full analytical, if all of the expected groups
in that item were placed; partial analytical, if between 50% and 99%
of the expected groups for the item were placed; and nonanalytical,
if 50% or less of the expected groups for the item were placed.
Children were allocated to a strategy class based on the frequency
of GAP scores over all test items. If a single strategy category was
used on more than 33% of the items, the child was allocated to the
corresponding strategy class. Mixed strategy classes were used if
children used two types of GAP in more than 33% of the cases. More
information on the categories and classes and which criteria applied
for them can be found in Appendix B.
2.4.2
|Verbalized strategies
The children's verbalizations after they solved series items were
recorded. These verbalizations were scored according to the three
levels used in previous research (Resing et al., 2017). The primary
scoring criterion was the extent to which the verbalization included
inductive reasoning. If the explanations included none of the
trans-formations necessary to solve the items and no other explanation
that implicitly (e.g., pointing) or explicitly portrayed an understanding
of the rules used in the series, the verbalization was appointed to
the first group (noninductive). If transformations or rules were
verbalized inductively but incompletely, the verbalization would be
categorized in the second group (partial inductive). If a child was
able to inductively verbalize all transformations or rules in the task,
either implicitly or explicitly, that verbalization would be scored in
the third group (full inductive).
Each item's verbalization was scored on its level of inductiveness,
and based on these total scores per category, the children were
appointed to a strategy class, based on the type of verbalization the
children used most or mixed throughout the task. If there was a single
type of verbalization used in more than 33% of the items, the child
was appointed to the corresponding strategy class. However, if two
types of verbalizations were used in more than 33% of the items,
the child would be assigned to one of the mixed strategy classes (see
Figure 3 for a visual representation; more detailed information can be
found in Appendix B).
2.4.3
|Average completion time
To further investigate children's process of solving the series, the item
completion times were calculated in milliseconds, based on the time
spent between the start of the item, where the console indicated to
turn the page of the booklet to the next item, and the end of the item,
when children were required to click on the bottom right corner of the
console. Out of the completion times, the average completion times
were calculated over the full test. For some children (N = 18), for
which the completion times for one or two items were missing,
average time scores were calculated with the remaining items. If the
completion times of more than two items were missing, the children
(one at pretest, three at posttest) were excluded from the time
analy-ses (N= 4).
3
|R E S U L T S
Before the hypotheses were tested, preliminary analyses were
ducted to check for a priori differences between children in the
con-trol and training conditions on Raven scores and age. Univariate
analyses of variance (ANOVAs), with Raven's Standard Progressive
Matrices scores and age as the dependent variable and condition
(control/training) as the fixed factor, revealed no significant
differ-ences in Raven scores (p= 0.87) or age (p= 0.89) between children
in both groups. The hypotheses and their corresponding result were
provided in Table 2 for a short overview of our findings.
3.1
|The effect of training
We expected that children in the dynamic testing group after training
would solve the series completion items more accurately than children
in the control condition and would show more advanced patterns in
both behavioural and verbal process measures. Means and standard
deviations of the dependent variables for the two conditions have
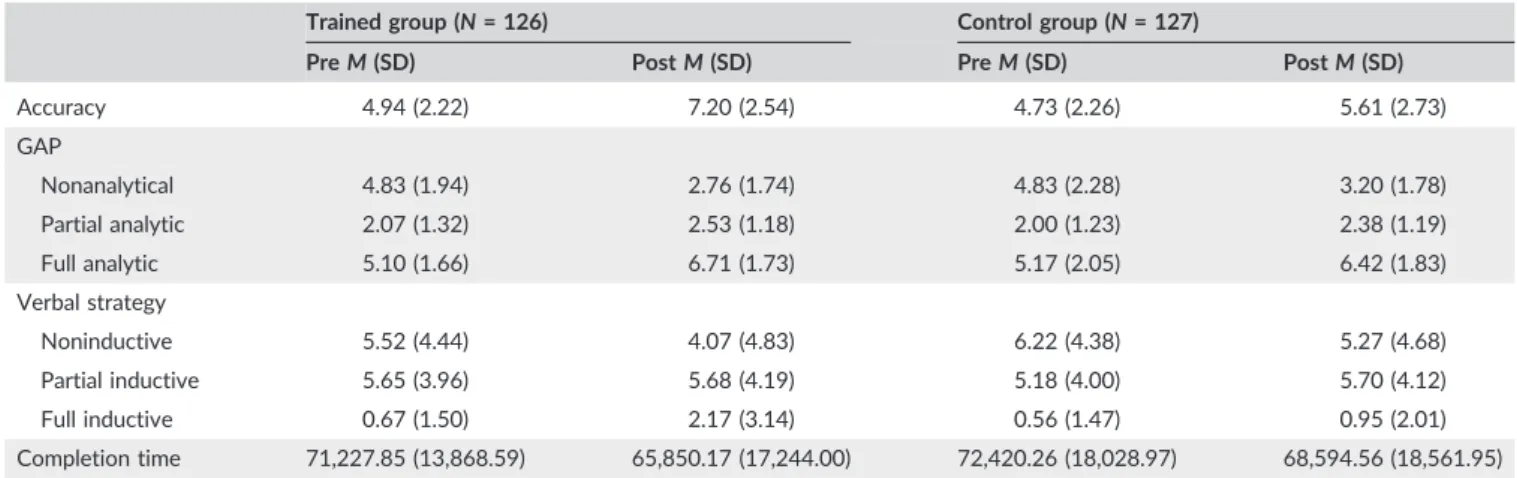
been depicted in Table 3 for the pretest and the posttest.
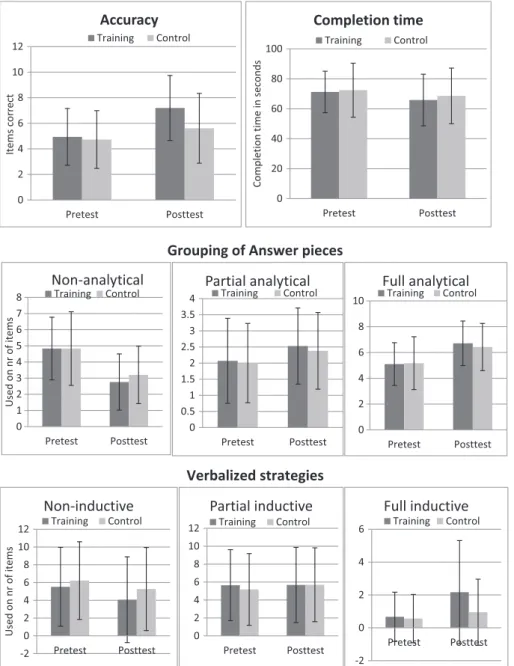
First, a repeated measures ANOVA, with series completion
accuracy as the dependent variable and condition (training/control)
as the between‐subjects factor and session (pretest/posttest) as the
within‐subjects factor, revealed significant main effects for session
and condition and a significant interaction effect for Session ×
Condi-tion (see Table 4 and Figure 4). In line with the expectaCondi-tions, children's
series completion solving became more accurate from pretest to
posttest, and children who had received training made more progress
from pretest to posttest than children who had only been subject to
repeated practice.
Second, to evaluate the effects of training on children's GAP, a
multivariate repeated measures ANOVA was administered with GAP
category (nonanalytical, partial analytical, and full analytical) as
depen-dent variable, session (pretest/posttest) as within‐subjects factor, and
condition (training/control) as between‐subjects factor. Multivariate
effects were found for session, Wilk'sλ= 0.619, F(2, 250) = 76.87,
p < 0.001,η2 = 0.38, but not for condition, Wilk'sλ = 0.994, F(2,
250) = 0.791, p= 0.455,η2= 0.01, or Session × Condition, Wilk's
λ= 0.991,F(2, 250) = 1.155,p= 0.317,η2= 0.01. Univariate analyses (see Table 4 and Figure 4) per GAP category revealed a significant
main effect for session for nonanalytical, partial analytical, and full
analytical GAP. These results showed that the use of GAP changed
from pretest to posttest. Children used nonanalytical GAP less
frequently and partial and full analytical GAP more frequently.
How-ever, the graduated prompts training did not result in a faster
progres-sion towards more advanced GAP than repeated practice did.
Third, we expected that training would lead to more sophisticated
verbalized strategy use. A multivariate repeated measures ANOVA
was conducted with session (pretest/posttest) as within‐subjects
factor, condition (dynamic testing/control) as between‐subjects factor,
and the number of verbal explanations per strategy category
(nonin-ductive, partial in(nonin-ductive, and full inductive) as dependent variables. TABLE 2 Hypotheses and their related findings
Hypothesis Result
1a. Higher accuracy in series completion solving as a result of graduated prompts training
Significant effects found for session, condition, and Session × Condition. Children who received training made more progress from pretest to posttest
1b. More grouping activities in series completion solving as a result of graduated prompts training
Significant effect found for session, but not for condition and Session × Condition. All children progressed from pretest to posttest
1c. More sophisticated verbalized strategy use in series completion solving as a result of graduated prompts training
Significant effects found for session, condition, and Session × Condition. Sharper increase in the use of full inductive verbal strategy use for trained children
1d. Decreased time spent on task Significant effect found for session, but not for condition and Session × Condition. Completion times became shorter from pretest to posttest for all children.
2a. More sophisticated categories of grouping behaviour used as a result of training
Significant relationship found between the condition and the use of GAP on the posttest; trained children made more use of more advanced grouping behaviour on the posttest
2b. More advanced verbalized strategy categories used as a result of training
Significant relationship found between the condition and the use of verbalized strategy class on the posttest; trained children made more use of more advanced verbal strategies on the posttest
3a. Process measures related to accuracy on the series completion task and academic performance
On the pretest, all process measures were related to accuracy on the series completion task. On the posttest, there were different patterns of correlations between conditions.
3b. Process measures provide explanatory value for academic performance on mathematics
On the pretest, GAP and accuracy were significant predictors for math performance. On the posttest, process measures did not add to the prediction.
3c. Process measures provide explanatory value for academic performance on reading comprehension
On the pretest, process measures did not add to the prediction of reading comprehension, although accuracy was a significant predictor. On the posttest, accuracy, number of prompts, and completion time were all predictors to reading comprehension scores
3d. Dynamic test measures provide superior prediction over static measures regarding school performance
For math, posttest scores provided more explained variance than pretest scores. For reading comprehension, number of prompts provided more explained variance than pretest accuracy, but posttest accuracy did not
TABLE 3 Means and standard deviations for accuracy, GAP categories, verbal strategy categories, and completion time
Trained group (N= 126) Control group (N= 127)
PreM(SD) PostM(SD) PreM(SD) PostM(SD)
Accuracy 4.94 (2.22) 7.20 (2.54) 4.73 (2.26) 5.61 (2.73)
GAP
Nonanalytical 4.83 (1.94) 2.76 (1.74) 4.83 (2.28) 3.20 (1.78)
Partial analytic 2.07 (1.32) 2.53 (1.18) 2.00 (1.23) 2.38 (1.19)
Full analytic 5.10 (1.66) 6.71 (1.73) 5.17 (2.05) 6.42 (1.83)
Verbal strategy
Noninductive 5.52 (4.44) 4.07 (4.83) 6.22 (4.38) 5.27 (4.68)
Partial inductive 5.65 (3.96) 5.68 (4.19) 5.18 (4.00) 5.70 (4.12)
Full inductive 0.67 (1.50) 2.17 (3.14) 0.56 (1.47) 0.95 (2.01)
Completion time 71,227.85 (13,868.59) 65,850.17 (17,244.00) 72,420.26 (18,028.97) 68,594.56 (18,561.95)
TABLE 4 Results of the repeated measures ANOVAs for Accuracy (N= 253), GAP categories (N= 253), Verbal strategy categories (N= 253), and Completion Time (N= 249)
Session Condition Session × Condition
F(1, 251) p η2 F(1, 251) p η2 F(1, 251) p η2
Accuracy 113.10 <0.001 0.31 11.08 0.001 0.04 22.15 <0.001 0.08
GAP
Nonanalytical 153.36 <0.001 0.38
Partial analytic 15.30 <0.001 0.06
Full analytic 95.91 <0.001 0.28
Verbal strategy
Noninductive 24.60 <0.001 0.09 3.30 0.071 0.01 1.04 0.310 0.00
Partial inductive 1.35 0.247 0.01 0.248 0.619 0.00 1.06 0.210 0.00
Full inductive 51.90 <0.001 0.17 8.01 0.005 0.03 17.61 <0.001 0.07
Completion time 27.26 <0.001 0.10 0.998 0.319 0.00 0.775 0.379 0.00
Note. GAP: grouping of answer pieces.
Multivariate effects were found for session, Wilk's λ= 0.799, F(3,
249) = 20.89,p< 0.001,η2= 0.20; condition, Wilk's
λ= 0.965, F(3, 249) = 2.99,p = 0.031,η2= 0.04; and Session × Condition, Wilk's λ= 0.934, F(3, 249) = 5.83,p= 0.001,η2= 0.07. Univariate analyses
(see Table 4 and Figure 4) revealed significant main effects for session
for the noninductive and the full inductive strategy category, but not
for the partial inductive strategy category. A significant effect for
con-dition was found for the full inductive strategy category, but not for
the noninductive and partial inductive strategy category. Similarly, a
significant interaction effect was found for Session × Condition for
the full inductive strategy category, but not for the noninductive or
the partial inductive strategy category. From pretest to posttest, there
was a reduction in the use of noninductive verbal strategies and an
increase in the use of full inductive verbal strategies. More
impor-tantly, the trained children showed a sharper increase in the use of full
inductive verbal strategies from pretest to posttest than did children in
the control condition.
Finally, a repeated measures ANOVA with session (pretest/
posttest) as within‐subjects factor, condition (training/control) as
between‐subjects factor, and completion time as dependent variable
revealed a significant main effect for session, but not for condition,
or Session × Condition. Children's completion times became shorter
from pretest to posttest, but the training did not lead to a significant
difference compared with repeated practice.
3.2
|Changes in task solving process over time
To further examine the effects of the graduated prompts training
pro-cedure on the processes involved in solving series completion, the
children were assigned to classes based on their grouping behaviour
and verbalized strategies used during pretest and posttest. Crosstabs
analyses (chi‐square tests) were employed to evaluate how children's
behaviour and verbal solving processes changed over time (Table 5).
We analysed the predicted shifts in GAP by analysing the relationship
between condition (training/control) and GAP class—(1) nonanalytical;
(2) mixed 1 and 3; (3) partial analytical; (4) mixed 3 and 5; and (5) full
analytical. These classes have been described in Appendix B. On the
pretest, no significant relationship was found between condition and
the use of GAP,χ2pretest(n= 253) = 6.39,p= 0.172 (40% of the cells
have expected count less than 5). On the posttest, a significant
relationship was found between condition and the use of GAP, χ2posttest
(n= 253) = 8.28,p= 0.041 (25% of the cells have expected
count less than 5). As we expected, trained children made more use
of more advanced grouping behaviour on the posttest than children
who had not received training.
Using comparable analyses, we examined the shifts in children's
verbal strategy classes—(1) noninductive; (2) mixed 1 and 3; (3) partial
inductive; (4) mixed 3 and 5; and (5) full inductive—in relation to the
condition (training/control). The pretest data showed, as expected,
no significant effect for condition on the verbalized strategy class, χ2pretest(n= 252) = 4.49,p= 0.344 (40% of the cells have expected
count less than 5). However, on the posttest, a significant effect for
condition was revealed,χ2posttest(n= 253) = 14.58,p= 0.006 (0% of
the cells have expected count less than 5). In line with our hypothesis,
trained children made more use of more advanced verbal strategies
than those who did not receive training.
3.3
|Prediction of school achievement test results
by static and dynamic test scores
This study also examined the predictive value of process and
product measures on the series completion task with regard to school
TABLE 5 Results for the crosstabs analyses for grouping of pieces and verbalized strategies
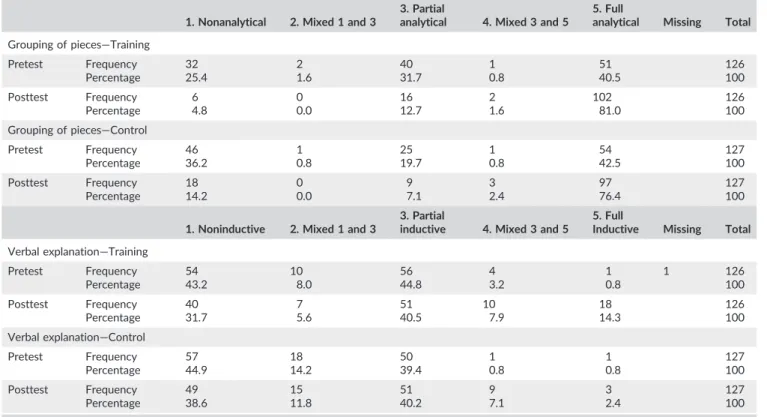
1. Nonanalytical 2. Mixed 1 and 3
3. Partial
analytical 4. Mixed 3 and 5
5. Full
analytical Missing Total Grouping of pieces—Training
Pretest Frequency 32 2 40 1 51 126
Percentage 25.4 1.6 31.7 0.8 40.5 100
Posttest Frequency 6 0 16 2 102 126
Percentage 4.8 0.0 12.7 1.6 81.0 100
Grouping of pieces—Control
Pretest Frequency 46 1 25 1 54 127
Percentage 36.2 0.8 19.7 0.8 42.5 100
Posttest Frequency 18 0 9 3 97 127
Percentage 14.2 0.0 7.1 2.4 76.4 100
1. Noninductive 2. Mixed 1 and 3
3. Partial
inductive 4. Mixed 3 and 5
5. Full
Inductive Missing Total Verbal explanation—Training
Pretest Frequency 54 10 56 4 1 1 126
Percentage 43.2 8.0 44.8 3.2 0.8 100
Posttest Frequency 40 7 51 10 18 126
Percentage 31.7 5.6 40.5 7.9 14.3 100
Verbal explanation—Control
Pretest Frequency 57 18 50 1 1 127
Percentage 44.9 14.2 39.4 0.8 0.8 100
Posttest Frequency 49 15 51 9 3 127
scores on mathematics and reading comprehension. To answer the
question whether dynamic measures would provide more predictive
value than static (pretest) measures, multiple linear regression analyses
were carried out. Math and reading comprehension achievement
scores were included as the respective dependent variables and
accuracy scores, GAP scores, verbalization class, completion times,
and number of prompts as predictor variables, for pretest and posttest,
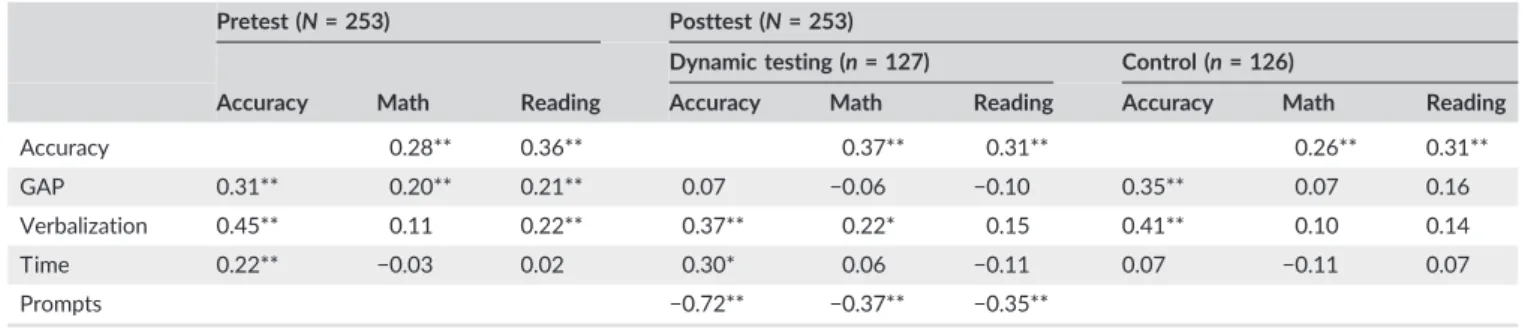
respectively. Table 6 shows the correlation structure of all variables
involved in the various regression analyses.
Hierarchical regression analyses were run on the data of children
in the training condition. The results were displayed in Table 7. A first
hierarchical regression analysis was conducted with math achievement
score as the dependent variable and the GAP pretest score as the
independent variable. This analysis led to a significant model, which
explained 4.4% of variance in math. In a second model, the pretest
GAP, verbalization, and completion time were entered as predictors.
This model was significant but did not provide a significant
improve-ment upon the first model. Pretest GAP was the only significant
predictor in this model. A third model in which the pretest accuracy
score was added as predictor led to a significantly better explanation
of the variance in math achievement, with an explained variance in
math of 9.6%. Accuracy on the pretest of the series completion test
and pretest GAP were the only significant predictors in this third
model.
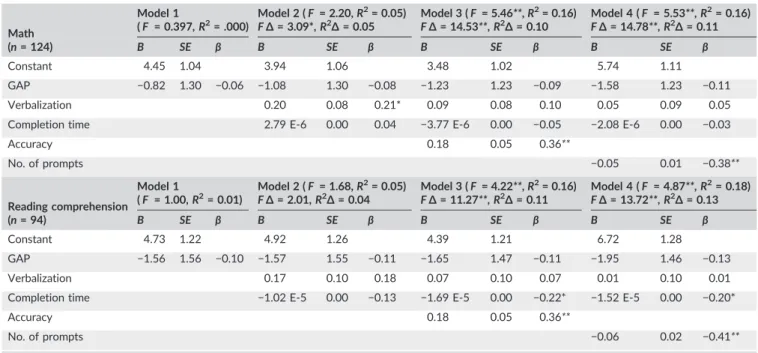
A second hierarchical regression was run to analyse the predictive
value of the posttest scores regarding the math achievement scores.
The results were shown in Table 8. Model 1, with the posttest GAP
as predictor, did not show significance. Adding the posttest
verbaliza-tion and compleverbaliza-tion time scores as predictors did not lead to a
signif-icant model. In a third model, posttest accuracy was added as a
predictor, which led to a significant model that explained 12.7% of
variance in math scores. In this model, posttest accuracy was the only
significant predictor. An additional model was used, in which the
num-ber of prompts provided during training was included as a predictor
instead of posttest accuracy. This model significantly explained
12.8% of the variance in math scores. The number of prompts
pro-vided during the training condition was the only significant predictor
in this model. In line with our expectations, dynamic (posttest)
mea-sures provided more explained variance in math scores (12.7% and
12.8%, respectively) than static (pretest) measures (9.6%).
TABLE 6 Correlations for process and outcome measures on the puppet task and mathematics and reading comprehension
Pretest (N= 253) Posttest (N= 253)
Accuracy Math Reading
Dynamic testing (n= 127) Control (n= 126)
Accuracy Math Reading Accuracy Math Reading
Accuracy 0.28** 0.36** 0.37** 0.31** 0.26** 0.31**
GAP 0.31** 0.20** 0.21** 0.07 −0.06 −0.10 0.35** 0.07 0.16
Verbalization 0.45** 0.11 0.22** 0.37** 0.22* 0.15 0.41** 0.10 0.14
Time 0.22** −0.03 0.02 0.30* 0.06 −0.11 0.07 −0.11 0.07
Prompts −0.72** −0.37** −0.35**
Note. GAP: grouping of answer pieces.
*p< 0.05. **p< 0.01.
TABLE 7 Regression analyses for the prediction of school results for the dynamic testing group on the pretest
Math
Model 1
(F = 6.71*,R2= 0.05)
Model 2 (F = 2.71*,R2= 0.06) FΔ= 0.731, R2Δ= 0.01
Model 3 (F = 4.31**,R2= 0.13) FΔ= 8.58**, R2Δ= 0.06
(n= 125) B SE β B SE β B SE β
Constant 1.67 0.83 1.15 0.98 1.44 0.97
GAP 3.10 1.20 0.23* 3.10 1.20 0.23* 2.40 1.19 0.18*
Verbalization 0.11 0.11 0.09 −0.03 0.12 −0.03
Completion time 3.93 E‐6 0.00 0.04 −4.52 E‐7 0.00 −0.01
Accuracy 0.16 0.06 0.29**
Reading comprehension
Model 1
(F = 2.53,R2= 0.03)
Model 2 (F = 2.21,R2= 0.07) FΔ= 2.02, R2Δ= 0.04
Model 3 (F = 4.30**,R2= 0.16) FΔ= 9.93**, R2Δ= 0.09
(n= 93) B SE β B SE β B SE β
Constant 1.92 1.02 0.90 1.29 1.23 1.23
GAP 2.36 1.49 0.16 2.33 1.47 0.16 1.44 1.43 0.10
Verbalization 0.24 0.13 0.19 0.06 0.14 0.05
Completion time 7.52 E‐6 0.00 0.07 2.47 E‐6 0.00 0.02
Accuracy 0.21 0.07 0.35**
Note. GAP: grouping of answer pieces.
Similarly, hierarchical regression analyses were conducted
regarding the prediction of reading comprehension scores. First,
models were tested for the prediction of reading comprehension
by the pretest measures (Table 7). A first model included only pretest
GAP score as a predictor, which did not reach significance. In a
second model, pretest verbalization and completion time scores were
added as predictors, which again did not reveal significance. In a
third model, the pretest accuracy score was added and this model
was significant, explaining 12.6% of the variance in reading
compre-hension scores. Accuracy was the only significant predictor in this
model.
In the hierarchical regression analysis with posttest measures as
predictors for reading comprehension (Table 8), a first model with
the posttest GAP score as the only predictor was not significant. A
second model included the posttest verbalization and completion time
scores but again appeared not to be significant. A third model was
again tested, with the addition of posttest accuracy as a predictor. This
model was significant and explained 12.2% of variance in reading
comprehension. In this model, posttest accuracy and completion time
were significant predictors. A final model, including number of
prompts provided during training as a predictor instead of accuracy,
was significant and explained 14.3% of the variance in reading
prehension. In this model, again, both number of prompts and
com-pletion time were significant predictors to reading comprehension
scores. Faster performance on the posttest and fewer prompts
pro-vided during the training sessions appeared to be related to better
reading comprehension outcomes. It can be concluded that the
dynamic testing (posttest) model with number of prompts during
training provided marginally more explained variance (14.3%) than
did static (pretest) measures (12.6%) to the prediction of reading
comprehension. The dynamic model that included accuracy did not
provide more explained variance (12.2%).
4
|D I S C U S S I O N
The first aim of the current study was to examine if, and how, dynamic
testing, based on graduated prompt techniques and with the use of a
TUI, could provide insight into children's potential for learning and
their task solving processes. Second, our study particularly aimed to
investigate the predictive and explanatory value of the process and
product measures in a dynamic testing format through rule‐based
log file analysis. A new measure for the restructuring of children's
problem representations was used, GAP, along with more often used
process measures, being verbalized strategy use (Ericsson & Simon,
1980; Kirk & Ashcraft, 2001; Tenison et al., 2014) and completion
time (Dodonova & Dodonov, 2013; Goldhammer et al., 2014; Tenison
et al., 2014).
The graduated prompts training, as in previous research with the
same dynamic test (e.g. Resing & Elliott, 2011; Resing et al., 2012,
2017) led to more progression in series completion solving
perfor-mance than repeated practice. The effects of training on the processes
children used to solve the tasks revealed a more complex picture.
Children's verbalized strategy use became more advanced as a result
of training, as evidenced by the increased use of the most advanced, full
inductive reasoning strategy category for the trained children.
Improve-ments were visible in all process measures when children were tested
twice, as a result of repeated practice or training or both. However,
chil-dren's completion times did not differentially progress under influence
of the graduated prompts training. Grouping behaviour showed a more
complicated picture. The average use of grouping behaviour did not
appear to progress differently as a result of the graduated prompts
training, but the distribution of grouping did show a differential effect
after training. It would appear that the graduated prompts training did
not affect the level to which the children used grouping behaviour, but
rather the variability in the use of grouping behaviour within the test. TABLE 8 Regression analyses for the prediction of school results for the dynamic testing group on the posttest
Math
Model 1
(F = 0.397,R2= .000)
Model 2 (F= 2.20,R2= 0.05) FΔ= 3.09*,R2Δ= 0.05
Model 3 (F= 5.46**,R2= 0.16) FΔ= 14.53**,R2Δ= 0.10
Model 4 (F = 5.53**,R2= 0.16) FΔ= 14.78**,R2Δ= 0.11
(n= 124) B SE β B SE β B SE β B SE β
Constant 4.45 1.04 3.94 1.06 3.48 1.02 5.74 1.11
GAP −0.82 1.30 −0.06 −1.08 1.30 −0.08 −1.23 1.23 −0.09 −1.58 1.23 −0.11
Verbalization 0.20 0.08 0.21* 0.09 0.08 0.10 0.05 0.09 0.05
Completion time 2.79 E‐6 0.00 0.04 −3.77 E‐6 0.00 −0.05 −2.08 E‐6 0.00 −0.03
Accuracy 0.18 0.05 0.36**
No. of prompts −0.05 0.01 −0.38**
Reading comprehension
Model 1
(F = 1.00,R2= 0.01)
Model 2 (F= 1.68,R2= 0.05) FΔ= 2.01,R2Δ= 0.04
Model 3 (F= 4.22**,R2= 0.16) FΔ= 11.27**,R2Δ= 0.11
Model 4 (F = 4.87**,R2= 0.18) FΔ= 13.72**,R2Δ= 0.13
(n= 94) B SE β B SE β B SE β B SE β
Constant 4.73 1.22 4.92 1.26 4.39 1.21 6.72 1.28
GAP −1.56 1.56 −0.10 −1.57 1.55 −0.11 −1.65 1.47 −0.11 −1.95 1.46 −0.13
Verbalization 0.17 0.10 0.18 0.07 0.10 0.07 0.01 0.10 0.01
Completion time −1.02 E‐5 0.00 −0.13 −1.69 E‐5 0.00 −0.22* −1.52 E‐5 0.00 −0.20*
Accuracy 0.18 0.05 0.36**
No. of prompts −0.06 0.02 −0.41**
Note. The FΔandR2Δof Model 4 are based on the change from Model 2.
These differential effects for the process measures can be
under-stood in the light of core differences in children's solving processes on
the series completion task. On the one hand, verbalizations can be
seen as rather task‐specific processing, as they are descriptions of
the rules underlying the series completion items, representing specific
strategies to series completion problem solving. The graduated
prompts method most likely provided the children, if necessary, with
detailed task knowledge, which would mean that the more general
problem solving structures that are used to solve unfamiliar problems
would become less relevant. This notion was supported by the
pat-terns of relations between task success and process measures for
the trained children, versus those who had received repeated practice
only and children's untrained performance on the pretest. This would
be in line with the model proposed by Weisberg (2015), which states
that, when solving a problem, the first stage is to search for any
available knowledge that could be used for solving the problem. The
graduated prompts method procedure provided specific knowledge
and methods for solving the series completion task. This knowledge
was likely not previously available to the children on the pretest, nor
did they acquire it through repeated practice. As a result, untrained
performance was dependent on the second and third stages of the
model, being domain‐general methods and the restructuring of
the problem, respectively (Weisberg, 2015). Grouping behaviour, on
the other hand, was thought to be a general measure of how children
are able to restructure the problem representation, by dividing the
task into smaller subproblems, a form of means‐ends analysis (Newell
& Simon, 1972; Pretz et al., 2003; Robertson, 2001; Weisberg, 2015).
Our data show that most children already used an elementary form of
grouping behaviour at the pretest and progressed in doing so when
tested twice. This would also explain why GAP, as a measure for
restructuring of the problem representation, was no longer related to
performance after training. Robertson (2001) distinguished between
strong and weak methods of problem solving. Strong methods were
described as learned scripts that provide a reasonable certainty of
solving the problem correctly. In contrast, weak methods would be
methods for the solver to use when no clear method of solving is
avail-able. These do not guarantee a correct solution (Newell & Simon, 1972;
Robertson, 2001). The graduated prompts training will likely have
provided children with strong methods, rendering the use of these
weak methods less important to attain a correct solution to the task.
The process measures were weakly to moderately related to
accu-racy in solving the series completion task. In line with previous
expec-tations voiced in literature (e.g., Elliott, 2000; Greiff et al., 2013;
Zoanetti & Griffin, 2017), the process measures used in this study
would provide explanatory information on task performance. The
rule‐based log file analysis was instrumental in uncovering process
information, particularly in relation to the restructuring of the problem
representation, by the analysis of the GAP. The predictive value of
GAP extended beyond the series completion task performance, to
school performance on mathematics and reading comprehension. This
supports the notion that process measures, such as GAP, could
pro-vide us with more understanding of reasons for not correctly solving
the tasks and subsequently might provide information for intervention
(Elliott, 2000; Greiff et al., 2013; Yang, Buckendahl, Juszkiewicz, &
Bhola, 2002; Zoanetti & Griffin, 2017). The meaning of the process
information, however, seems to differ for each type of process
mea-sure. For the grouping behaviour, it was found that after training and
repeated practice with the task, the majority of children progressed
towards the most advanced grouping category. This might indicate
that low grouping scores could be interpreted as a warning signal.
For the verbalizations, on the other hand, even after training, a
sub-stantial number of children still provided verbalizations that were
classified in the lowest category, because a large group of children
were not able to explain how the series should be solved. Only very
few children were able to consistently provide complete explanations
and could be identified as the top performers. With regard to
comple-tion time, more time spent on the task was associated with better
performance. Fast performance would be an indicator that children
do not take enough time to acquire information and control and
monitor their actions (Scherer, Greiff, & Hautamäki, 2015).
Previous research has shown superior predictive qualities of
dynamic testing for school performance compared with static testing
(Caffrey et al., 2008; Elliott et al., 2018), and our findings seem mostly
in line with this trend. The dynamic (trained posttest) performance
showed a higher predictive relationship for mathematics than did
the static (pretest) task performance, as it did in previous research
(e.g., Stevenson, Bergwerff, Heiser, & Resing, 2014). For the prediction
of reading comprehension, the amount of help provided during
train-ing provided more prediction than static test measures, but trained
(posttest) performance did not. Furthermore, on the dynamic test,
completion time was the only process measure that was related to
reading comprehension. Surprisingly, here, faster performance was
predictive of better reading comprehension scores. The potential
rela-tion between complerela-tion time and reading comprehension has,
how-ever, been analysed in a linear way. In future, a curvilinear analysis
method, as has been reported in other domains (e.g., Greiff, Niepel,
Scherer, & Martin, 2016), might further confirm or disconfirm this
per-ceived change. The other process measures no longer contributed to
the prediction of school performance beyond the prediction offered
by accuracy. For both math and reading comprehension, the number
of prompts children needed during training provided more predictive
value than outcome scores.
Of course, this study had some limitations. The use of a
con-structed response answering format enabled measuring of process
indicators, as well as analysis of children's actions through rule‐based
log file analysis in a manner that would not have been possible in a
mul-tiple‐choice answering format. This poses a limitation to the
applicabil-ity of the GAP measure and may prove to be an issue when applying
this measure to a more diverse set of tests. We nevertheless would like
to encourage future test makers to make use of constructed response
answering formats, as it seems to provide useful information, that
cannot be obtained from traditional multiple‐choice tests (Kuo, Chen,
Yang, & Mok, 2016; Stevenson et al., 2016; Yang et al., 2002).
It should be taken into account that the current findings were
obtained using a series completion task and therefore cannot readily
be generalized to any other domains. Similarly, this research was
con-ducted with a single, specific age group, for which inductive reasoning
ability is still in full development. Using other age groups in future
research could provide us with information on which processes
![FIGURE 1 Example item of the puppet series completion task [Colour figure can be viewed at wileyonlinelibrary.com]](https://thumb-us.123doks.com/thumbv2/123dok_us/8290777.2195494/4.892.73.850.91.170/figure-example-puppet-series-completion-colour-figure-wileyonlinelibrary.webp)