Variations in Performance Measurements of Multi-Core Processors:
A Study of n-Tier Applications
Junhee Park1, Qingyang Wang1, Deepal Jayasinghe1, Jack Li1, Yasuhiko Kanemasa2, Masazumi Matsubara2, Daisaku Yokoyama3, Masaru Kitsuregawa3, Calton Pu1
1College of Computing, Georgia Institute of Technology 2Cloud Computing Research Center, FUJITSU LABORATORIES LTD.
3Institute of Industrial Science, University of Tokyo
1{jhpark, qywang, deepal, jack.li, calton}@cc.gatech.edu, 2{kanemasa, matz}@jp.fujitsu.com, 3{yokoyama, kitsure}@tkl.iis.u-tokyo.ac.jp
Abstract—The prevalence of multi-core processors has raised
the question of whether applications can use the increasing number of cores efficiently in order to provide predictable quality of service (QoS). In this paper, we study the horizontal scalability of n-tier application performance within a multi-core processor (MCP). Through extensive measurements of the RUBBoS benchmark, we found one major source of performance variations within MCP: the mapping of cores to virtual CPUs can significantly lower on-chip cache hit ratio, causing performance drops of up to 22% without obvious changes in resource utilization. After we eliminated these variations by fixing the MCP core mapping, we measured the impact of three mainstream hypervisors (the dominant Com-mercial Hypervisor, Xen, and KVM) on intra-MCP horizontal scalability. On a quad-core dual-processor (total 8 cores), we found some interesting similarities and dissimilarities among the hypervisors. An example of similarities is a non-monotonic scalability trend (throughput increasing up to 4 cores and then decreasing for more than 4 cores) when running a browse-only CPU-intensive workload. This problem can be traced to the management of last level cache of CPU packages. An ex-ample of dissimilarities among hypervisors is their handling of write operations in mixed read/write, I/O-intensive workloads. Specifically, the Commercial Hypervisor is able to provide more than twice the throughput compared to KVM. Our measurements show that both MCP cache architecture and the choice of hypervisors indeed have an impact on the efficiency and horizontal scalability achievable by applications. However, despite their differences, all three mainstream hypervisors have difficulties with the intra-MCP horizontal scalability beyond 4 cores for n-tier applications.
Keywords-virtualization; QoS; multi-core; scalability; cloud;
hypervisor; performance comparison; RUBBoS; n-tier;
I. INTRODUCTION
Providing predictable quality of service (QoS) is an im-portant goal for web-facing applications in cloud environ-ments. The prevalence of multi-core processors (MCPs) in computing clouds and data centers today has raised the ques-tion of whether applicaques-tions can use the increasing number of cores efficiently in order to provide predictable QoS. On a physical chip, an MCP often has a hierarchical organization with multiple CPUs each having multiple cores. A dual-CPU quad-core processor would have 2 dual-CPUs, each with
four cores. One of the most important challenges in clouds and data centers is the intra-MCP horizontal scalability of system software. This is often attempted through virtual-ization, where a hypervisor maps virtual CPUs (vCPU) of a virtual machine (VM) into physical cores. The intra-MCP horizontal scalability is a particular problem for n-tier applications and systems due to the several layers and various system component choices. In this paper, we run extensive experiments to measure and compare the intra-MCP horizontal scalability of n-tier server components.
The first contribution of the paper is the identification of an important source of measurement variance: mapping of vCPUs to physical cores. For a dual-CPU MCP, mapping 4 vCPUs to a single CPU (with 4 cores on the same memory bank and cache) produced significant performance gains compared to mapping 4 vCPUs to two CPUs that do not share cache. The performance gains of up to 22% are achieved without any obvious sign of resource under-utilization, since cores remain ”busy” when cache misses and they have to await the memory access. By pinning vCPUs to appropriate physical cores we were able to elim-inate this source of variance and accurately compare the performance differences due to 3 mainstream hypervisors (Section III).
The second and main contribution of the paper is an experimental comparative study of 3 major hypervisors with regard to their support of n-tier applications running on MCP. Concretely, we ran an n-tier application benchmark (RUBBoS [1]) on 3 major hypervisors (i.e., the dominant Commercial Hypervisor, XEN, and KVM) to compare their support of intra-MCP horizontal performance scalability. Our data shows that the hypervisors showed both similarities and dissimilarities.
For similarities, we observed a non-monotonic scalability trend to multi-cores across all three hypervisors when run-ning a browse-only CPU-intensive workload. For instance, we found that the system was only able to scale linearly up to four cores and five cores onward the throughput starts to deteriorate while all cores were still fully utilized. This
problem can be traced to the CPU overhead induced by inefficient management of the last level cache (LLC) in CPU packages (Section IV). For dissimilarities, we found that each hypervisor has its own strategy of handling write operations (i.e., I/O). Due to this difference, we observed significant performance differences among hypervisors when running a mixed read/write I/O-intensive workload. Specifi-cally, XEN outperforms the Commercial Hypervisor by 22% and the Commercial Hypervisor is able to provide more than twice the throughput compared to KVM (Section V).
Our empirical analysis suggests that in order for enterprise n-tier applications to better scale in multi-core virtualization environments, both MCP cache architecture and the choice of hypervisors should be considered integral components. However despite their differences, performance scalability of n-tier applications beyond four cores remains a challenge for all three mainstream virtualization technologies.
The remainder of this paper is organized as follows. The next section presents the description of our experimental setup including the profiling environments, tools and bench-mark. Subsequently, Section III introduces the performance variation induced by core mapping. Section IV describes a non-monotonic scalability trend to multi-core processors. Section V illustrates performance difference among hyper-visors. Finally, we present the related work in Section VI and conclude our work in Section V.
II. EXPERIMENTALSETUP
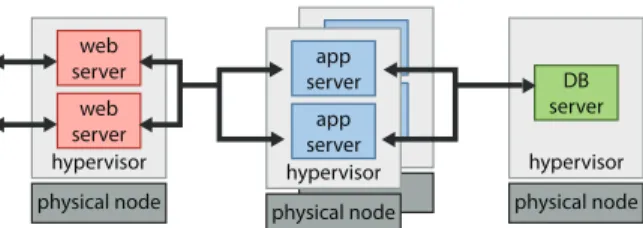
While the intra-MCP horizontal scalability may be eval-uated using any type of application, the focus of this paper is n-tier applications with LAMP (Linux, Apache, MySQL, and PHP) implementations. Typically, n-tier applications are organized as a pipeline of servers1, starting from web servers (e.g., Apache), through application servers (e.g., Tomcat), and ending in database servers (e.g., MySQL). This organization, commonly referred to as n-tier architecture (e.g., 3-tier in Figure 1(a)), serves many important web-facing applications such as e-commerce, customer relation-ship management, and logistics.
In our experiments, we adopt the RUBBoS n-tier bench-mark, based on bulletin board applications such as Slash-dot [1]. RUBBoS has been widely used in numerous research efforts due to its real production system significance. The workload includes 24 different interactions such as register user or view story. The benchmark includes two kinds of workload modes: browse-only and read/write interaction mixes. Our default experiment trial consists of a three-minute ramp-up, a three-three-minute runtime, and a 30-second ramp-down. We run the RUBBoS benchmark in a 3-tier system (Figure 1(a)) with workload raging from 1000 up to 35000 users while scaling the system from one up to
1In this paper, server is used in the sense of computer programs serving
client requests. Hardware is referred to as a physical computing node or node for short.
physical node hypervisor DB server physical node hypervisor web server web server app server app server physical node hypervisor app server app server
(a) 3-tier application system with seven servers (i.e., web,
application, and database) and four physical hardware nodes in total. Two dedicated web/app server VMs are co-located on a single physical hardware node.
physical node hypervisor
web/app server web/app server
vcpu vcpu cpu cpu cpu cpu mem mem 0 vcpu vcpu cpu cpu cpu cpu mem mem 1
(b)Details of resource mapping between web/app server VMs
and a shared physical hardware node. The VMs’ virtual CPUs and memory are explicitly mapped to separate physical CPU packages and memory banks to mitigate interference.
Figure 1: Example of a 3-tier application system deploy-ment, presented as mappings of virtual machines to physical hardware nodes.
eight cores under four different environments. We exploit hardware-assisted VM (HVM) and performance measure-ments (e.g., CPU utilization) are taken during the runtime period using Sysstat and Collectl at one and 0.1 second granularity respectively. We utilize OProfile and Xenoprof to monitor last level cache misses from host.
CPU Quad Xeon 2.27GHz * 2 CPU (8M L3 Cache) Memory 16GB (8GB per Memory Bank)
HDD SATA, 7200RPM, 500GB
Network I/F 1Gbps Web Server HTTPD-2.2.22 App Server Apache Tomcat-5.5.17 Connector Tomcat Connectors-1.2.32-src DB Server Mysql-5.5.28-linux2.6-x86 64
Java JDK-1.6 23
Monitoring Tools Sysstat, OProfile(Xenoprof), Collectl Hypervisor Commercial Hypervisor (CH), KVM, XEN Virtualization Type Full virtualization (HVM)
Guest OS RHEL Server 6.3 64-bit Guest OS Kernel 2.6.32-279.19.1.el6.x86 64
Table I: Summary of experimental setup (i.e., hardware, op-erating system, software, and virtualization environments).
At an abstract level, the deployment of n-tier applications in a cloud computing infrastructure can be modeled as a mapping between component servers and physical
0 500 1000 1500 2000 2500 3000 5 10 15 20 25 30 35 Throughput [req/s]
Workload [Thousands of Users] Conf1(0,1,2,3Map) Conf2(0,1,4,5Map)
(a)Throughput comparison between the two
4-core mappings (4 cores in 1 CPU package vs 2 cores in 2 CPU packages); VMs mapped with cores in same CPU package provides 22% more performance than VMs with cores mapped to different CPU packages.
0 20 40 60 80 100 5 10 15 20 25 30 35 CPU Utilization [%]
Workload [Thousands of Users] Conf1(0,1,2,3Map) Conf2(0,1,4,5Map)
(b)CPU utilization comparison between the
two 4-core mappings (4 cores in 1 CPU package vs 2 cores in 2 CPU packages); While both mappings report 100% CPU utilization, cores mapped to different CPU packages saturate earlier.
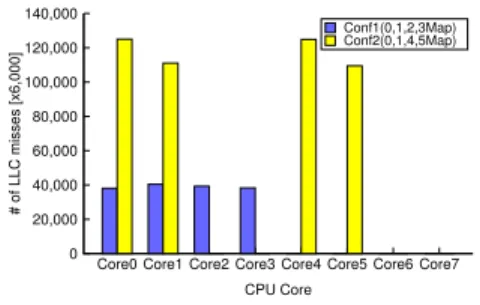
0 20,000 40,000 60,000 80,000 100,000 120,000 140,000
Core0 Core1 Core2 Core3 Core4 Core5 Core6 Core7
# of LLC misses [x6,000]
CPU Core
Conf1(0,1,2,3Map) Conf2(0,1,4,5Map)
(c) Comparison of LLC misses per core
be-tween the two 4-core mappings; Cores in two different CPU packages showed overall 128% more LLC misses and the cores used in both mappings get less efficient due to significant increase in LLC misses.
Figure 2: Analysis of performance variation induced by core mapping.
ing nodes. Figure 1(a) exemplifies our n-tier application deployment with two web server virtual machines (VM), four application server virtual machines, and one dedicated database server virtual machine. Other than the database server VM, each server VM has two virtual cores (virtual CPUs), 2GB of memory, and 20GB HDD and we co-located two server VMs on a single physical node using the dominant Commercial Hypervisor2(CH) as illustrated in the Figure 1. In order to mitigate interference between the two co-located VMs, each VM’s virtual resources are explicitly mapped (i.e., pin) to separate physical CPU packages and memory banks as shown in Figure 1(b). Through extensive experiments we confirmed that this topology does not intro-duce any artificial bottlenecks inintro-duced by VM co-location in web-tier and application-tier; however these empirical results are omitted here due to space constraints. Other important characteristics of our experimental testbed are summarized in Table I.
III. PERFORMANCEVARIATIONS INDUCED BYCOREMAPPING
When we started running the experiments outlined in Sections II and IV, we encountered significant variance in the measurement results as we repeated exactly the same experiments (hardware and software). This variance (up to more than 20%) has been reported anecdotally in various cloud environments for a variety of benchmarks, but to the best of our knowledge its sources have yet to be unambiguously identified. This variance is a significant problem in the analysis of our experimental results, since it is about the same order of magnitude as the measured differences among the hypervisors.
2Due to licensing and copy rights issues which prevent publications of
performance or comparison data, we mask our choice of commercial virtu-alization technology. We use commercial hypervisor or CH interchangeably throughout the paper.
Through the data collection from a large number of experiments and careful analysis, we found that the cache hit ratio that influences overall application performance (described in Section IV) also seem to be connected to the variances in the repeated measurements. Since the repeated experiments run on exactly the same hardware and software configurations, we concluded that the ”hidden variable” must reside at a level below the typical hardware configuration settings. A careful study of the CPU cache architecture (outlined schematically in Figures 1(b) and 3) showed that the mapping of virtual CPUs (vCPU) in VMs to physical cores is not necessarily static for every hypervisor, unless they are explicitly ”pinned”. By comparing the measured performance of experiments with different mappings of vCPUs to physical cores, we were able to find the main source of the variances observed: the cache hit ratio.
L3
L2L1 4 L2L1 5 L2L1 6 L2L1 7L3
L2L1 0 L2L1 1 L2L1 2 L2L1 3MEM 0
MEM 1
Figure 3: Schematic illustration of CPU and memory archi-tecture in our experimental testbed.
The mapping/pinning of vCPUs to physical cores has significant influence on cache hit ratio because the 2 physical CPUs have separate memory banks and caches. Therefore, only if all vCPUs (up to 4) are mapped to the 4 cores of a single CPU will they share the same L3 cache (Figure 3). Using a concrete scenario to illustrate the problem, let us consider two different mapping strategies for 4 cores
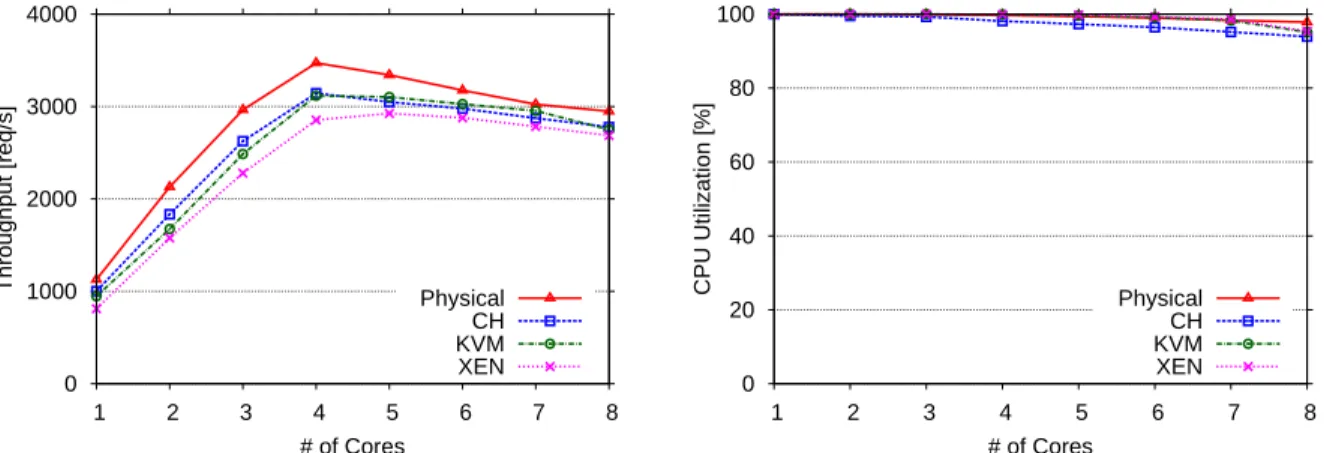
0 1000 2000 3000 4000 1 2 3 4 5 6 7 8 Throughput [req/s] # of Cores Physical CH KVM XEN
(a) Max throughput of the system under 4 different
envi-ronments when scaling from 1 core to 8 cores; For all environments, the system shows a non-monotonic scalability trend. 0 20 40 60 80 100 1 2 3 4 5 6 7 8 CPU Utilization [%] # of Cores Physical CH KVM XEN
(b) Average CPU utilization when scaling from 1 core to 8
cores; While performance decays from 5 cores onward, all cores are fully utilized.
Figure 4: Observation of the non-monotonic scalability trend of the system.
under the XEN environment. The first configuration maps all 4 vCPUs into a single CPU package, which are cores numbered0,1,2,3for Xen. The second configuration maps 2 vCPUs into each one of the 2 CPU packages, e.g., cores
0,1 in one CPU and cores4,5 in the other CPU.
Figure 2(a) illustrates throughput comparison between the two mapping cases when scaling from 1000 to 35000 users. We found that the single-CPU mapping outperforms the two-CPU mapping by 22%. Interestingly, the performance gap between the two configurations happened without any obvious under-utilization of system resources that may have contributed to this performance penalty. Figure 2(b) shows the CPU utilization comparison between the two mapping strategies. Both mappings show all cores being fully utilized, but cores in the two-CPU mapping saturate much earlier than those from the single-CPU mapping. Further analysis of measurement data revealed that the two-CPU mapping cores have 128% higher LLC misses than the single-CPU mapping. By identifying the LLC misses of individual cores, we also observed that cores that were used in both cases such as Core0 and Core1 show significant increase in LLC misses (i.e., 228%, 175% respectively) in the two-CPU mapping (Figure 2(c)). These results suggest strongly that the mapping of vCPUs to physical cores can have significant impact on the n-tier application performance due to cache management issues.
From an operational point of view, the mapping through pinning of vCPUs to physical cores is a non-trivial task. First, the physical pinning facility may not be available to a normal user of computing clouds. Often it requires administrator privileges. Second, different hypervisors have different core number assignment strategies. Concretely, CH and XEN assign core numbers 0,1,2,3 to CPU0 and core numbers4,5,6,7to CPU1. In contrast, KVM and the native
deployment of RHEL6 and Debian assign core numbers
0,2,4,6 to CPU0 and core numbers 1,3,5,7 to CPU1. This lack of standard mapping/naming convention required careful mapping specifications at the physical core level to achieve the best cache hit ratios. For example, pinning 4 vCPUs to cores0,1,2,3 is a single-CPU mapping for Xen, but a two-CPU mapping for KVM. Conversely, pinning 4 vCPUs to cores0,2,4,6is a single-CPU mapping for KVM, but a two-CPU mapping for Xen.
IV. NON-MONOTONIC SYSTEM SCALABILITY TO MULTI-CORE ENVIRONMENTS
In the previous section, we showed that the mapping of vCPUs to physical cores inside a single CPU package pro-duced significant performance gains due to an increase in on-chip cache hit ratio. In this section, we investigate intra-MCP horizontal scalability on four different environments using a browse-only CPU-intensive workload. Through extensive measurements, we found that the system only scales linearly up to four cores, and the performance starts to decrease from five cores onward. We observed this non-monotonic scalability trend appeared on all environments. Section IV-A describes the experimental observation on non-monotonic scalability trend of the system under three mainstream hypervisors (i.e., Commercial Hypervisor, KVM, XEN) as well as the native physical environment. Section IV-B illus-trates the impact of the CPU overhead caused by last level cache misses on n-tier application performance and system scalability to multi-core.
A. Non-monotonic trend in intra-MCP horizontal scalability One of the straightforward approaches of scaling an n-tier application in modern cloud platforms is to scale up (e.g., adding more CPUs or memory). While the growth of virtualization technologies and multi-core processors has
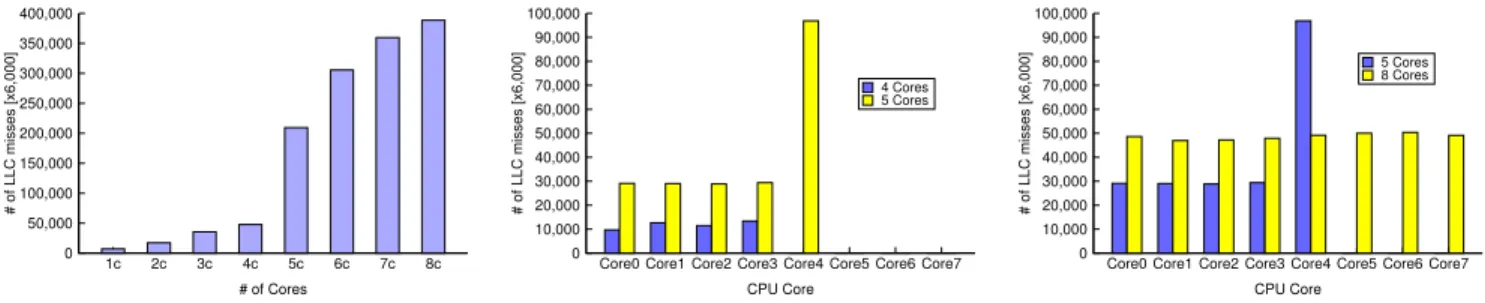
0 50,000 100,000 150,000 200,000 250,000 300,000 350,000 400,000 1c 2c 3c 4c 5c 6c 7c 8c # of LLC misses [x6,000] # of Cores
(a)Total number of LLC miss when scaling
from 1 core to 8 cores; Exponential increase (390%) is observable after 4 cores.
0 10,000 20,000 30,000 40,000 50,000 60,000 70,000 80,000 90,000 100,000
Core0 Core1 Core2 Core3 Core4 Core5 Core6 Core7
# of LLC misses [x6,000]
CPU Core
4 Cores 5 Cores
(b)Comparison of LLC misses per core
be-tween 4-core case and 5-core case; Cores used in both cases are less efficiently utilized.
0 10,000 20,000 30,000 40,000 50,000 60,000 70,000 80,000 90,000 100,000
Core0 Core1 Core2 Core3 Core4 Core5 Core6 Core7
# of LLC misses [x6,000]
CPU Core
5 Cores 8 Cores
(c) Comparison of LLC misses per core
be-tween 5-core case and 8-core case; Total number of LLC miss increases 86%.
Figure 5: Analysis of non-monotonic scalability trend of the system through LLC misses.
facilitated the scale up of existing systems, we found that this approach does not always guarantee system scalability. Figure 4(a) illustrates the performance trend of the system under CH, KVM, XEN, and physical environment. Each throughput value used in the figure represents the maximum throughput that a system can achieve under a given fixed allocation of cores when we scale from 1000 users up to 35000 users. This result shows that the system was able to scale linearly up to four cores producing approximately 50% more throughput as the number of affiliated cores increases; however, from five cores onwards, the system stops scaling further and the performance even starts to deteriorate. We found out that this non-monotonic performance scalability trend exists on all three virtual environments. We confirmed that this trend also exists on the physical environment running RHEL6 on bare metal hardware.
We diagnose the cause of the performance degradation by investigating the CPU utilization of the VM. Figure 4(b) depicts the average CPU utilization for each core assignment scenario. It shows that the CPU is fully saturated for all cases when we scale from one core to eight cores. Based on these results we found that the additional CPU power allocated to the VM is being fully utilized, but the perfor-mance actually deteriorates. For example, under the eight-core configuration, the average CPU utilization for all eight physical cores measured at the host level of XEN, KVM, CH, and physical environment shows 95%, 95%, 94%, and 98%, respectively but performance between the eight core scenario and four core scenario actually decreases by 6%, 12%, 12%, and 15%. Upon further investigation, we found that LLC misses introduce significant CPU overhead which hampers all of the extra CPU power gained by allocating additional cores to the VM which we discuss in the next section.
B. CPU overhead induced by last level cache misses For modern computer architectures, caching effectiveness is one of the key factors for system performance [6], [7], [13]. In order to monitor the last level cache, we used OProfile and Xenoprof which utilize CPU performance
counter3. Figure 5(a) shows the total number of LLC misses (i.e., L3 cache miss) under a given fixed allocation of cores. The number of LLC misses increases linearly from one core to four cores, but we observed a sudden dramatic increase after four cores. For instance, from four cores to five cores the total number of LLC misses increases 390%. Breaking down the total number of LLC misses into individual cores revealed that on-chip cache miss ratio increased significantly for the same cores that were used in the four core allocation scenario as shown in Figure 5(b). For example, Core0 which was used in both cases showed a 200% increase in LLC misses when we scaled from four to five cores. We also observed a notable number of LLC misses on Core4. This is due to Core4 being located in a different CPU package. As explained in Section III, since only Core4 uses separate L3 cache and memory bank, an increase in cache miss ratio is unavoidable. As more cores from the second CPU package gets allocated, we could observe a significant decrease in LLC misses on Core4 as shown in Figure 5(c).
An experienced reader may immediately question the wisdom of LLC misses when scaling from seven to eight cores, which appears to be an insignificant increase (i.e., 8%) compared to the four to five cores (i.e., 390%). The focus of this section is to show that LLC misses have significant impact on the performance of n-tier system and its scalability to multi-cores. There are many other factors limiting system scalability such as spin locks and implementation issues residing in the application [4].
Based on these results we realized that while additional CPU cores were allocated and fully utilized, the extra processing power was compensated due to the overhead introduced by LLC misses. Considering the actual number of LLC misses (i.e., LLC miss value times 6000), the high number of the LLC misses cause frequent CPU stalls which wastes its CPU cycles on waiting for the cache line thus canceling the extra CPU power and even degrading the performance.
3The CPU performance counter increases by 1 for every 6000 L3 cache
0 1000 2000 3000 4000 1 2 3 4 5 6 7 8 Throughput [req/s] # of Cores XEN CH KVM
(a) Max throughput comparison among 3
hypervisors when scaling from 1 core to 8 cores; CH achieves at most 123% better performance than KVM and XEN provides up to 32% more throughput than CH.
0 20 40 60 80 100 0 20 40 60 80 100 120 140 160 180 IO Utilization [%]
Elapsed Experiment Time [sec] KVM CH
(b) Timeline of disk I/O utilization under
CH and KVM configured with 4 cores; Both cases, the disk I/O was the bottleneck limit-ing system scalability to multi-cores.
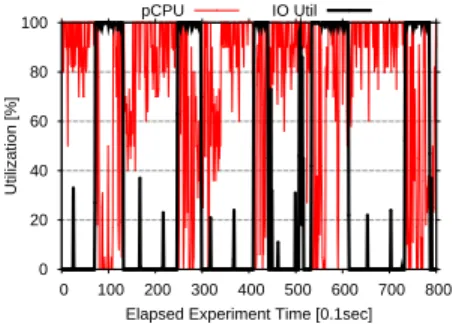
0 20 40 60 80 100 0 100 200 300 400 500 600 700 800 Utilization [%]
Elapsed Experiment Time [0.1sec] pCPU IO Util
(c)Timeline of CPU and disk I/O under XEN
environment; Rapidly oscillating bottleneck between CPU and disk I/O limits system scalability and the I/O utilization indicates that I/O jobs are batched.
0 10 20 30 40 50 60 70 10 20 30 40 50 60 70 80 90 100 Frequency CPU IOwait [%] Core0 Core1 Core2 Core3
(d)CPU IOwait Histogram under CH using
4 cores; I/O jobs are distributed to all cores.
0 20 40 60 80 100 120 140 160 180 10 20 30 40 50 60 70 80 90 100 Frequency CPU IOwait [%] Core0 Core1 Core2 Core3
(e)CPU IOwait Histogram under KVM
us-ing 4 cores; Only one core (i.e, Core1) handles most of the I/O jobs.
0 20 40 60 80 100 KVM CH XEN CPU Utilization [%]
(f)Average CPU utilization among 3
hyper-visors.
Figure 6: Analysis of performance difference among 3 hypervisors and limited scalability to multi-core
V. PERFORMANCE IMPACT OF UNDERLYING VIRTUALIZATION TECHNOLOGIES
So far we have discussed that core mapping can cause significant performance variations due to its influence on cache hit ratio and under browse-only CPU-intensive work-load, we observed a non-monotonic scalability trend on all three hypervisors induced by inefficient last level cache management. In this section, we focus on the empirical analysis of performance differences among three hypervisors when running a mixed read/write I/O-intensive workload. The results here are based on the same configuration as shown in Section IV except the workload characteristics.
When we scale from one core up to eight cores using I/O intensive workload, we observed two interesting phe-nomena - limited intra-MCP horizontal scalability and sig-nificant performance differences among three hypervisors. Figure 6(a) depicts the maximum achievable throughput of the system under three different hypervisors (i.e., XEN, CH, KVM) when scaling from one core up to eight cores. This figure clearly shows our two observations. Firstly, the system does not scale well to multiple cores. For instance, under XEN and CH, the system was only able to scale up to three cores and two cores respectively. Moreover, the KVM system showed no throughput gains regardless of how many cores were allocated to it. Secondly, there are significant
per-formance differences among three hypervisors. For example, XEN outperforms the Commercial Hypervisor by 22% and the CH is able to provide more than twice the throughput compared to KVM. Let’s look into each observation in detail.
The limited intra-MCP horizontal scalability problem can be trace to the different bottlenecks among hypervisors. Un-der KVM and CH environments, disk I/O was fully saturated and under XEN environment it was due to rapid oscillating bottleneck between CPU and disk I/O. Figure 6(b) depicts the timeline of disk I/O utilization under the 4-core case measured using iostat at one second granularity. This figure shows that under CH and KVM environments, the system I/O is fully saturated. Therefore adding more cores had no effect on system throughput. In the case of XEN, we zoom in to the highly aggregated average of the CPU and I/O utilization through fine-grained analysis. Figure 6(c) illustrates timeline of CPU and I/O utilization under the 4-core case. Both utilization data are measured using Collectl at 100ms granularity. In this figure we observed a negative correlation between CPU utilization and disk I/O utilization which suggests a rapidly oscillating bottleneck between the two resources limiting the system scalability to multi-core processors [2], [3].
performance differences among hypervisors. In order to understand what has caused such performance differences, we first focus on KVM and CH where both cases showed I/O saturation (see Figure 6(b)). Figure 6(d) and 6(e) illustrates the histogram of CPU IOwait under CH and KVM environ-ments respectively. These CPU IOwait data are collected by sar every 1 second during a 180 second run-time. Figure 6(e) shows that only one core (i.e., Core1) handles most of the I/O under the KVM environment while all other cores showed less than 5% CPU IOwait. This trend was also visible in CPU utilization. Only the core that has high IOwait shows near saturation while others show low utilization. This low utilization in the other cores that are not handling I/O is due to the characteristics of our storage engine (i.e., InnoDB). Since the InnoDB storage engine provides full transactional support, operations that induce I/O such as updates and inserts trigger various locking mechanisms (e.g., row-lock, table-lock, etc.) which prevent other threads to be processed thus resulting in the low-utilization on other cores. Under CH environment, on the other hand, we observed that I/O is distributed to all cores as depicted in Figure 6(d). This distribution of I/O enables CH to better utilize the underlying multi-core architecture and is the key factor that explains the higher throughput. By distributing I/O to different cores, it allows multiple data manipulation operations that are independent of each other to be executed simultaneously. Consequently this contributes to reducing locking time hence achieves higher utilization by processing more threads under the same amount of time. The average CPU utilization shown in Figure 6(f) indicates that CH achieves 1.9 times higher utilization than KVM resulting in higher throughput. Next let’s look into XEN case. From the Figure 6(a) which shows the maximum achievable throughput of the system, we observed that XEN achieves highest throughput among 3 hypervisors. The reason can be traced to its I/O utilization pattern from Figure 6(c). This figure shows that XEN batches I/O tasks inside the memory and writes to the disk intermittently. While XEN is batching I/O requests from the guest domain that is CPU intensive period, increasing the number of cores can relieve CPU bottleneck. As a result, XEN shows best intra-MCP horizontal scalability among 3 hypervisors and achieves 17% higher CPU utilization than CH (see Figure 6(f)) thereby providing better performance. These results suggests that each hypervisor’s strategy of handling write operations in a mixed read/write I/O-intensive workload can have significant impact on n-tier applications performance.
VI. RELATED WORK
Traditionally, performance analysis in IT systems builds models based on expert knowledge and uses a small set of experimental data to parameterize them [10], [11], [15]. The most popular representative of such models is queuing theory. Queuing networks have been widely applied in many
performance prediction methodologies [12], [14]. These approaches are often constrained by their rigid assumptions when handling n-tier systems due to the complex dependen-cies. As an illustration of significant characteristics that are hard to capture with traditional analysis, consider the sig-nificance of context switching towards system performance when a large number of threads is involved [9].
An increasing popularity of virtualization and cloud computing has spawned interesting research on private and public clouds. Barham et al. [16] benchmarked Xen against VMware Workstation and User-Mode Linux, and they showed that Xen outperforms VMware on a range of micro benchmarks and system-wide tests. Clark et al. [17] repeated this performance analysis of Xen in [16] and confirmed the results presented in [16]. They also compared Xen on x86 with IBM zServer and found that the former had a better performance than the latter.
Padala et al. [18] compared Xen and OpenVZ’s perfor-mance when used for consolidating multi-tiered applications. Their experimental results showed that Xen incurs higher overhead than OpenVZ and average response time can increase by over 400% in Xen and only 100% in OpenVZ as the number of application instances grows from one to four. This can be explained by looking at L2 cache misses; Xen has higher L2 cache misses than OpenVZ. Meanwhile, Adams et al. [19] compared software VMM (binary translation) with hardware-assisted VMM. They showed that software and hardware VMMs both perform well on compute-intensive workloads. However, if work-loads include progressively more privileged operations such as context switches, memory mapping, I/O, interrupts and system calls, both VMMs suffer overheads while software outperforms hardware.
Deshane et al. [20] focused on three aspects of bench-marking Xen and KVM: overall performance, performance isolation, and scalability. They illustrated that Xen has excellent scalability while KVM has substantial problems with guests crashing when a physical node hosts more than four virtual guests. KVM outperforms Xen in isolation. In overall performance tests, Xen has a better performance than KVM on a kernel compile test while KVM outperforms Xen on I/O-intensive tests. Camargos et al. [21] analyzed the performance and scalability of six virtualization technologies (KQEMU, KVM, Linux-VServer, OpenVZ, VirtualBox and Xen) for Linux.
There are multiple research studies on evaluating appli-cation performance on multi-core systems with and without virtualization. For example, Xiang et al. [8] analyzed the performance and scalability of para-virtualized VM and hardware-assisted VM on Xen hypervisor (Xen 4.0.0) on a 48-cores shared memory machine using a set of application benchmarks. Their results showed that the tested applications degrade in both performance and scalability on both para-virtualized VM and HVM compared to that on native Linux
and they also showed that the main reasons are the additional LLC misses and iTLB misses introduced by virtualization and the idle problem, which is caused by the incompatibility between the Linux idle mechanism (e.g., idle thread) and the Xen idle mechanism (e.g., idle-VM). Similar study by Bryan et al. [5] showed that, due to flow-level parallelism in web server workloads, the number of cache and TLB misses remained nearly constant per byte as the number of cores increased. Likewise, shared cache between cores on the same bus had little effect on performance when compared with unshared cache. Because of flow-level parallelism, there was little data shared between caches.
VII. CONCLUSION
In this paper, we studied the horizontal scalability of n-tier application performance within a multi-core processor (MCP) using the n-tier benchmark RUBBoS. We identi-fied mapping of vCPUs to physical cores is an important source of performance variation within the MCP due to its significant influence on cache hit ratio (see Section III). After we eliminated these variations by fixing the MCP core mapping, we investigated the impact of three mainstream hypervisors (the dominant Commercial Hypervisor, Xen, and KVM) on intra-MCP horizontal scalability and presented some interesting similarities and dissimilarities among the hypervisors. For similarities, we found a non-monotonic scalability trend (throughput increasing up to 4 cores and then decreasing for more than 4 cores) when running a browse-only CPU-intensive workload. This problem can be traced to the inefficient management of last level cache of CPU packages (see Section IV). For dissimilarities, we found that each hypervisor’s strategy of handling write op-erations can cause significant performance differences when running a mixed read/write, I/O-intensive workloads (see Section V). Our work suggests that both MCP cache archi-tecture and the choice of hypervisors should be considered as integral components due to its impact on the efficiency and horizontal scalability achievable by n-tier applications.
ACKNOWLEDGMENT
This research has been partially funded by National Science Foundation by IUCRC/FRP (1127904) , CISE/CNS (1138666), RAPID (1138666), CISE/CRI (0855180), NetSE (0905493) programs, and gifts, grants, or contracts from DARPA/I2O, Singapore Government, Fujitsu Labs, Wipro Applied Research, and Georgia Tech, Foundation through the John P. Imlay, Jr. Chair endowment. Any opinions, findings, and conclusions or recommendations expressed in this material are those of the author(s) and do not necessarily reflect the views of the National Science Foundation or other funding agencies and companies mentioned above.
REFERENCES
[1] Rice University Bulletin Board System. ”http://jmob.ow2.org/ rubbos.html”, 2004.
[2] S. Malkowski, M. Hedwig, and C. Pu. Experimental
evaluation of N-tier systems: Observation and analysis of multi-bottlenecks. In IISWC ’09
[3] Q. Wang, Y. Kanemasa, J. Li, D. Jayasinghe, T. Shimizu, M. Matsubara, M. Kawaba, and C. Pu. Detecting Transient Bottlenecks in n-Tier Applications through Fine-Grained Analysis. In ICDCS ’13
[4] S. Boyd-Wickizer, A. T. Clements, Y. Mao, A. Pesterev, M. F. Kaashoek, R. Morris, and N. Zeldovich. An Analysis of Linux Scalability to Many Cores. In OSDI ’10.
[5] B. Veal and A. Foong. Performance Scalability of a Multi-Core Web Server. In ANCS ’07.
[6] S. Cho, and L. Jin. Managing Distributed, Shared L2 Caches Through OS-Level Page Allocation. In MICRO ’06
[7] Q. Wang, Y. Kanemasa, M. Kawaba, and C. Pu. When
Average is Not Average: Large Response Time Fluctuations in n-Tier Systems. In ICAC ’12
[8] X. Song, H. Chen, and B. Zang. Characterizing the
Performance and Scalability of Many-core Applications
on Virtualized Platforms. In Parallel Processing Institute
Technical Report Number: FDUPPITR-2010-002.
[9] D. Jayasinghe, S. Malkowski, Q. Wang, J. Li, P. Xiong, and C. Pu. Variations in Performance and Scalability when Migrating n-Tier Applications to Different Clouds. In CLOUD
’11.
[10] R. Jain. The art of computer systems performance analysis: techniques for Experimental design, measurement, simulation, and modeling. John Wiley & Sons, Inc., New York, USA, 1991.
[11] D. J. Lilja. Measuring Computer Performance-A
Practitioner’s Guide. Cambridge University Press, New
York, USA, 2000.
[12] C. Stewart, and K. Shen. Performance modeling and system management for multi-component online services. In NSDI
’05.
[13] M. Lee, and K. Schwan. Region scheduling: Efficiently using the cache architectures via page-level affinity. In ASPLOS ’12 [14] B. Urgaonkar, G. Pacifici, P. Shenoy, M. Spreitzer, and
A. Tantawi. An analytical model for multi-tier internet
services and its applications. SIGMETRICS ’05.
[15] K. Xiong, and H. Perros. Service Performance and Analysis in Cloud Computing. In CLOUD ’10.
[16] P. Barham, B. Dragovic, K. Fraser, S. Hand, T. Harris, A. Ho , R. Neugebauer, I. Pratt, and A. Warfield. Xen and the Art of Virtualization. In SOSP ’03.
[17] B. Clark, T. Deshane, E. Dow, S. Evanchik, M. Finlayson,
J. Herne, and J. Matthews. Xen and the Art of Repeated
Research. In ATC ’04.
[18] K. Adams, and O. Agesen. A Comparison of Software and Hardware Techniques for x86 Virtualization. In ASPLOS ’06. [19] T. Deshane, Z. Shepherd, J. Matthews, M. Ben-Yehuda, A. Shah, and B. Rao. Quantitative Comparison of Xen and KVM. In Xen Summit ’08.
[20] F. Laudares Camargos, G. Girdard, and B. des Ligneris.
Virtualization of Linux Servers: A Comparative Study. In
Proceedings of 2008 the Linux Symposium, volume 1, pages 63-76.
[21] S. Kraft, G. Casale, D. Krishnamurthy, D. Greer, P. Kilpatrick. Performance Models of Storage Contention in Cloud Environ-ments. In SoSyM ’12.