Reverse Mortgages and the Liquidity of Housing Wealth
Christopher J. Mayer* and Katerina V. Simons*
Housing wealth constitutes most of the non-pension wealth of the elderly popu-lation. This study analyzes the potential of reverse mortgages to increase the income and liquid wealth of the elderly by identifying households with relatively high levels of housing equity. Because this article looks at the whole distribution of elderly households and considers debt as well as income, it finds a larger potential market for reverse mortgages than previous studies.
Calculations from the 1990 Sun'ey of Income and Program Participation and Census population estimates show that over six million homeowners in the United States could increase their effective monthly income by at least 20% by using a reverse mortgage. Of these, more than 1.3 million have no children. Further-more, a reverse mortgage would allow over J .4 million poor elderly persons to raise their incomes above the poverty line.
Housing wealth constitutes most of the non-pension wealth of the elderly population. The problem that many elderly homeowners face is how to tap this housing wealth for consumption without selling the house and moving. One possible solution to this problem lies in a relatively unusual financial instrument called the reverse mortgage, which allows the con-sumer to spend the equity while continuing to live in the home.
Although reverse mortgages have been in existence for more than a de-cade, their acceptance among consumers and financial institutions has been slow. Among the barriers to acceptance so far have been the lack of consumer familiarity with the product, the high cost of originating these loans, the lack of liquidity and diversification for lenders, unfa-vorable required accounting treatment, regulatory and legal uncertainties and concerns over consumer protection. Nevertheless, as solutions to these problems are gradually worked out, the reverse mortgage may prove to be a financial product of choice for many elderly homeowners, especially
in the future when the numbers of elderly increase relative to the popu-lation as a whole.
The number of consumers who are, in fact, possible candidates for re-verse mortgages is a matter of debate. Academic literature contains sev-eral studies of reverse mortgages that have calculated the potential de-mand for this product among the elderly population. Typically, these papers have found the potential pool of customers to be somewhat limited. This study will extend the previous work by focusing on the segment of the elderly population most likely to benefit. It will identify elderly house-holds with high levels of housing equity who could significantly increase their incomes and liquid wealth through reverse mortgages. In addition, it will consider elderly homeowners with high debt obligations who could use a reverse mortgage to ease their debt burden, as well as elderly home-owners who are childless and do not have a strong bequest motive, two segments of the population ignored in other studies.
The article is organized as follows: The first section briefly describes the features of various types of reverse mortgages offered in the private and public sectors. The second section surveys the relevant literature that has focused on the savings patterns of the elderly and their demand for reverse mortgage products. The third section describes the sample of the elderly drawn from the Survey of Income and Program Participation (SIPP). The fourth section analyzes the potential demand for reverse mortgages on the basis of age, fertility history, income, housing wealth, liquid wealth and debt. The fifth section discusses the reasons for the slow acceptance of reverse mortgages among consumers.
Defining a Reverse Mortgage
A reverse mortgage allows the elderly homeowner to borrow against the equity accumulated in the home without moving or being forced to sell the house. Unlike a conventional mortgage where the homeowner makes periodic payments to the lender, a reverse mortgage provides payments from the lender to the homeowner. The loan is repaid with interest when the borrower sells the house, moves permanently, or dies. Reverse mort-gages are usually available only to borrowers aged 62 or older.
The main advantage of a reverse mortgage over other means of tapping home equity lies in its repayment schedule. In contrast to conventional second mortgages or home-equity lines of credit, a reverse mortgage does not require the homeowner to make payments of interest and principal
during the term of the loan. Since the elderly homeowner may need to tap home equity precisely because his income is not sufficient to cover living expenses, it is likely that he will not have income to make pay-ments on a second mortgage or a home-equity line of credit.
While reverse mortgages differ in their terms and conditions, they come in two basic varieties—tenure and fixed term. A tenure reverse mortgage provides the homeowner with monthly payments for life, so long as the homeowner retains the house as the primary residence. After the borrower moves or dies, the house is sold and the loan is repaid. The amount the borrower receives in monthly installments during the life of the loan de-pends on several factors, including the amount of equity the borrower has in the house, the interest rate on the loan, the borrower's age and life expectancy and the projected rate of house price appreciation.
The term reverse mortgage, in contrast, is extended for a fixed number of years, usually no more than ten. At the end of the term, the loan comes due, and this usually requires the sale of the house. While the term mort-gage can provide higher monthly payments to most borrowers, it requires them to move and sell the house after a fixed period of time.
While both the tenure and the term mortgage provide monthly payments to the borrower, they can have other payment features, such as lump sum advances and lines of credit, or a combination of all three. Most reverse mortgages, both tenure and term, are conditional on continued occupancy of the house as the primary residence and must be repaid in cases of extended absence, such as a nursing-home stay.
Three types of reverse mortgages are currently available to consumers: the Federal Housing Administration (FHA)-insured reverse mortgage, the uninsured reverse mortgage and the lender-insured reverse mortgage.
FHA-Insured Reverse Mortgage
The FWA-insured reverse mortgage program, officially known as the Home Equity Conversion Mortgage Insurance Demonstration (HECM), was au-thorized by Congress in 1987 to encourage the growth of the reverse mortgage market. Under the program. FHA insurance protects lenders against the risk that the loan balance may eventually exceed the value of the house. It also guarantees continued loan payments in case of lender default. The program provides for a wide range of payment options. Con-sumers can receive payments monthly for a fixed term, or for as long as
they live in the home. A distinctive feature of the FHA fixed-term pay-ment option is that the loan need not be repaid at the end of the term. Instead, the payments simply stop, while the interest on the outstanding balance continues to accrue until the loan is repaid when the owner moves out, or dies, and the house is sold. The FHA program also allows elderly homeowners to access their housing equity through a line of credit or a combination of a line of credit with a tenure or term plan.' To make sure that borrowers understand the product and to guard against its misuse, the program requires potential borrowers to receive counseling from an FHA-approved independent counseling agency before taking out a reverse mortgage.
Initially limited to 50 lenders allowed to make 50 loans each, the program was expanded by Congress in 1989 and now authorizes all 10,000 FHA-approved mortgage lenders to make FHA-insured reverse mortgage loans. Congress authorized a total of 25,000 reverse mortgages to be made under the program, which is set to run until 1995. As of August 1992. a total of 2,155 loans have been closed by 52 lenders (HUD 1992).
Uninsured Reverse Mortgage
Uninsured loans are offered only for a fixed term and become due and payable on a specific date. Such loans are usually made in conjunction with independent counseling agencies that refer suitable customers to lenders. Such agencies help the borrowers with long-range planning and making arrangements for moving or for other sources of loan repayment. The agencies also help their clients find possible alternatives to reverse mortgages, such as government assistance programs for which they may be eligible. Because such counseling is an expensive and time-consuming process, and the agencies are nonprofit organizations supported by vol-untary and government contributions, the number of clients they can serve is necessarily limited. In addition, income tests usually restrict client el-igibility. Because the number and size of fixed-term reverse mortgages are small, they are viewed by lenders (mostly banks and thrifts) as a community-service type activity rather than as a current or even potential profit center.
Lender-Insured Reverse Mortgage
Currently, only three financial institutions offer lender-insured reverse mortgages." All are headquartered in California, but they offer their prod-ucts in a number of states. As in the FHA program, the lenders levy an insurance premium or risk-pooling charge in addition to interest, but un-like the FHA program, the lenders do not have a government guarantee. Some lenders also take a share of the future price appreciation of the house. The programs allow borrowers to reserve some portion of their equity (usually 25 or 30%) that would not be accessible to the lender for the purposes of the loan repayment. This reduces the monthly payments available to the borrower through a reverse mortgage, but assures that the estate or the heirs will participate in the future house price appreci-ation. Monthly payments are available for as long as the borrower lives in the house, or for life, depending on the program.
Reviev^' of Relevant Literature
There is some doubt in the economic literature about the willingness of many elderly households to utilize a reverse mortgage if it were available. Venti and Wise (1989, 1990) argue that if elderly households wanted to reduce their housing equity, then those households would move to smaller houses. They show that elderly homeowners who have moved recently are as likely to increase as to decrease their housing equity, rejecting the hypothesis that high transaction costs associated with selling a house and moving leave the elderly with "too much" housing equity. Alternatively, one might argue that the desire to maintain the same level of housing consumption, combined with the lack of an eftlcient rental market for single-family homes, leads the elderly to choose high levels of housing equity.
Others argue that the elderly might choose not to consume their housing equity because they intend to use this wealth as a bequest. Consistent with a strong bequest motive, several cross-section studies (Mirer (1979) and Menchick and Martin (1983) are examples) show that wealth accu-mulation increases after retirement. Kotlikoff and Summers (1981)
esti-^ As reported in "Summary of Reverse Mortgage Plans," American Association of Retired Persons, June 1993, these lenders are Providential Home Income, Freedom Home Equity Partners and Transamedca HomeFirst. Another lender, Capitol Holdings, has recently discontinued its reverse mortgage program.
mate that about 80% of household wealth is inherited, indicating that bequests are an important component in aggregate wealth accumulation. Evidence also exists that the bequest motive is not very important in ex-plaining individual savings behavior. The Kotlikoff and Summers esti-mates might not reflect the desired behavior of most elderly because of the skewed distribution of wealth and unintended bequests due to early death. Hurd (1987, 1990) attributes the cross-sectional evidence that the elderly continue saving after retirement to difficulties in detecting indi-vidual savings trajectories using aggregate data, especially given that wealthier households may live longer than their poorer counterparts. Us-ing panel data, Hurd shows that changes in wealth (net savUs-ing) over time are similar for individual elderly households, both with and without chil-dren, and thus he rejects the hypothesis that the bequest motive is im-portant in explaining the savings of the elderly.
Although the economic literature is somewhat ambivalent, popular opin-ion still supports the view that bequests are an important explanatopin-ion of elderly saving behavior. Even if the bequest motive is important, how-ever, it is not obvious why the elderly would want to pass on their wealth, specifically in the form of a house. The fact that many do so now is simply a reflection of heavy concentration of wealth in housing equity. If the elderly could gain liquidity for their housing wealth through reverse mortgages, they are likely to bequeath to their children a more diversified portfolio of assets.
Several recent studies have looked more specifically at the potential mar-ket for reverse mortgages. Venti and Wise (1991) use the 1984 Survey of Income and Program Participation (SIPP) to estimate the impact of a reverse mortgage on the income and assets of homeowners age 55 and older. They fmd that the median elderly homeowner, even in the lowest third of the income distribution, would only have a small percentage in-crease in income from a reverse mortgage. Although they note that most elderly could substantially increase their liquid wealth with a lump-sum payment from a reverse mortgage, Venti and Wise conclude that the po-tential market for reverse mortgages is limited to single persons who are very old.
Merrill, Finkel and Kutty (1992) use a different data set—the American Housing Survey for 1989—and assume that the potential market for re-verse mortgages is composed of households aged 70 or older, with annual incomes less than $30,000, who have lived in their homes at least ten years, and who own fully paid-off houses valued between $100,000 and
$200,000. They find that about 800,000 households (out of twelve mil-lion elderly homeowners aged 62 and older) in the United States meet those criteria. Looking at metropolitan areas, the paper concludes that most of the.se elderly live in California and the Northeast, areas that have had large real increases in house prices.
These studies may underestimate the potential demand for reverse mort-gages by considering only median reverse mortgage payments within a particular group (Venti and Wise) or by choosing a somewhat arbitrary income and house value cutoffs (Merrill, Finkel and Kutty, 1992). Nei-ther study considers the benefits of using a reverse mortgage to pay off debts for the smaller number of elderly who have high levels of indebt-edness.
Data
This paper uses data from the Survey of Income and Program Partici-pation (SIPP), a nationally representative stratified random sample of about 20,000 households. The SIPP is particularly well-suited for a study of potential demand for reverse mortgages among the elderly because it pro-vides data on household composition, fertility history, sources and amounts of monthly income and household balance sheets, including housing eq-uity, other assets and debts. Most of this analysis is done using the 1990 panel, though some comparisons are made with the 1984 panel. The data on fertility history came from the second wave of the 1990 SIPP, while the financial data came from the fourth waves of the 1984 and 1990 SIPP."' Following Venti and Wise (1991), pension wealth was computed as the discounted present value of the stream of payments over the homeowner's expected remaining life span from all private and government pensions, as well as Social Security benefits. The discount rate was assumed to be 6%. Private, state, local and other pension payments were assumed to remain constant in nominal terms throughout the recipient's lifetime, while federal, military and railroad pensions, as well as Social Security pay-ments, were assumed to grow at the rate of inflation (assumed to be 4%). Liquid wealth was defined to include deposits held in financial institu-tions, stocks, bonds and mutual fund shares.
^ The interviews for the fourth wave of the 1984 and 1990 SIPP were conducted in January through April of 1985 and 1991. respectively. The interviews for the second wave of the 1990 SIPP were conducted May through August of 1990. While most households included in the 1990 SIPP were intervievv-ed as part of both the second and fourth waves, a few households were omitted from one of the waves. The number was not large enough to affect the results.
Table 1 • Descriptive statistics of 1990 SIPP panel (all elderly, age 62 and over). Sample Size Median Age (years) Monthly Income ($) Home Equity ($) Pension Wealth ($) Liquid Wealth ($) Total Wealth ($)
Percent under Poverty Line Percent with No Children
Total Sample 4,840 72 1.460 41.000 103,152 9.475 199.357 11.8 22.9 ; Homeowners 3,405 71 1,733 64,000 118,434 15,000 256,398 8.0 21.1 Non-Homeowners 1,435 73 955 0 76,253 1,449 94,974 20.8 27.2
Source: U.S. Bureau of the Census, Survey of Income and Program Participation, 1990 and authors' calculations.
The sample used in this study contains elderly households consisting of either single persons aged 62 or older or couples with both members aged 62 or older. There were 4,840 such households in the 1990 panel, 3,405 of them homeowners.
Table I presents median values of the variables used in the analysis for the whole sample and also by homeownership status. The table reveals the expected higher median income and wealth for homeowners than for renters. It is notable, however, that despite the relatively high median wealth of the homeowners, 8% of them have incomes below the poverty line and could, presumably, benefit from an income-enhancing product like a reverse mortgage. One out of five homeowners in the sample is childless and, presumably, does not have a strong bequest motive that would discourage him or her from taking out a reverse mortgage. Figure 1 displays the wealth composition of the elderly homeowner sam-ple from the 1990 SIPP by age and compares it to comparable data from the 1984 SIPP. Among elderly homeowners in all age categories except the youngest, wealth is greater in 1990 than in 1984. Moreover, the wealth of the elderly is concentrated disproportionately in non-liquid categories, such as housing equity and the present value of the future stream of
pen-o Q + ^ O r-ter v Ag e u c o p 5 > • Llde r o
!i
u UTable 2 • Elderly homeowners with debt, 1990.
Total Mortgage Other Debt Debt Debt Number of Elderly
Homeownerswith Debt in Sample 1,303 680 930 Percentage of the Total Sample of
Elderly Homeowners 38.3 20.0 27.3 For Elderly Homeowners with Debt
Mean Monthly Debt Payments $271.30 $342.60 $129.50 Median Monthly Debt Payments $177.30 $243.40 $76.50 Mean Monthly Debt Payments as
a % of Monthly Income 14 18 6 Median Monthly Debt Payments
as a % of Monthly Income 8 11 4 For All Elderly Homeowners
Monthly Debt Payments as a Monthly Income Less than 10% I0%-20% 20%-30% 30%-40% 40%-50% Over 50% % of 83 9 3 1 1 .1 .5 .8 .4 .9 .4 89.0 6.1 2.4 .7 .6 2.1 94.2 4.2 1.1 .4 .1 .1 Source: U.S. Bureau of the Census, Survey of Income and Program Participation, 1990.
sion payments. Furthermore, this pattern is more pronounced in 1990 than in 1984, with liquid wealth a smaller percentage of total wealth in 1990. Some elderly homeowners may find it most advantageous to use a reverse mortgage to pay off other debts, including mortgage debt, to increase disposable income. Table 2 shows the numbers and percentages of elderly homeowners with debt, as well as the mean and median sizes of their
monthly debt payments and the size of their debt burden relative to in-come. While most elderly homeowners are free of debt, 38% have some form of debt and 20% have mortgage debt. For those who have debt, the median monthly payment is $177. or 8% of their monthly income. While the median debt burden among elderly homeowners does not appear large, it masks a small number of people with heavy debt burdens. The final panel of Table 2 shows the distribution of monthly debt payments as a percentage of the monthly income of elderly homeowners. Seventeen per-cent have monthly debt payments in excess of 10% of their monthly in-come, and 1.4% have debt payments that are more than half their monthly income.
Reverse Mortgage Simulations
This section describes the impact that a reverse mortgage would have on the income of the elderly in the sample. The reverse mortgage simulation employed in this study assumes that the proceeds of the loan are con-verted to an annuity over the borrower's life expectancy.•* Simulations of a more typical (and restrictive) tenure reverse mortgage loan would re-quire assumptions about the length of time the borrower can be expected to stay in the house before moving, for example, to an assisted living facility or a nursing home (known in the insurance industry as the "move-out rate").
The monthly reverse mortgage payment was calculated as follows: First, the maximum amount of the re verse-mortgage loan was determined; that is, the amount the borrower could take out in a lump sum. That amount was based on the value of the house, the amount of equity the borrower has in the house, the projected rate of house price appreciation and the borrower's sex and age (or ages, for a couple). The maximum loan-to-value ratio, including the reverse mortgage balance plus existing mortgage debt, was set at 75%; the origination cost was assumed to be 3% of the equity applied to the reverse mortgage, financed from the proceeds of the loan. Once the lump-sum re verse-mortgage payment was determined, it was converted to a lifetime annuity with monthly payments.
Because women live longer than men, they receive lower reverse mort-gage payments than men.** In the case of couples, the joint "life expec-* This feature of the model most closely resembles the reverse mortgage contract offered by Transamerica HomeFirst.
' Life expectancies were found in the Vital Statistics of the United States J988> published in 1989.
taney" based on both ages resulted in a lower reverse mortgage payment than the payment received by single borrowers. No attempt was made in the study to correct for any self-selection bias that may cause the life expectancy of the population of reverse-mortgage borrowers to be dif-ferent from the life expectancy in the population as a whole. On one hand, the annuity feature of a reverse mortgage should attract people with life expectancies longer than the average. On the other hand, if borrowers use reverse mortgages to help pay for unusually high medical expenses or long-term care, then the reverse mortgage population may be in poorer health than the average person of the same age and, thus, have a shorter life expectancy.
The mortgage interest rate was assumed to be 9.25%, the average fixed rate on a 30-year mortgage prevailing in January 1991.'' The rate of future housing price appreciation, equal to the expected inflation rate, was set at 4.3%.^ The spread between the mortgage rate and the annuity rate was assumed to be 2%, resulting in an annuity rate of 7.25%. To gauge the sensitivity ofthe results to these rate assumptions, calculations were also made with two other sets of assumptions: the mortgage rate, the annuity rate and the house appreciation rate were set 2% lower (7.25%, 5.25% and 2.3%, respectively) and 2% higher (11.25%, 9.25% and 6.3%, respectively).
Table 3 shows the effect of monthly reverse mortgage annuity payments on household income under these three sets of assumptions, which show a broadly similar pattern. Column 1 of Table 3, for example, shows that when the mortgage, annuity and house appreciation rates are set at 9.25%, 4.3% and 7.25%, respectively, more than 40% of all elderly homeowners would receive a boost in income of less than 10%. A significant minority of potential borrowers, however, would see a much bigger jump in come. Over one-third of homeowners could increase their monthly in-come by 20% or more, and a little over one-tenth of the sample would see income rise by over 50%."
'' Flow of Funds data. Federal Reserve Systeni, 1991. Recall that interviews for the fourth wave of 1990 SIPP were conducted in the ftrst half of 1991; therefore,
1991 data were more appropriate than 1990 data.
' The expected inflation rate was the ten-year consensus CPI forecast in the first quarter of 1991, according to the Federal Reserve's quarterly Survey of Profes-sional Forecasters.
" Calculations were also made estimating changes reverse mortgage payments would make in elderly homeowners' net income after debt payments. Assuming the mortgage rate, the annuity rate and the house appreciation rate of 9.25%,
Table 3 • Distribution of monthly reverse mortgage payments as a percentage of monthly income, all elderly homeowners, 1990.
Mortgage Rate (%) 9.25 7.25 11.25 Annuity Rate (%) 7.25 5.25 9.25 Annual House
Appreciation Rate (%) 4.30 2.30 6.30 Reverse Mortgage Payment as a Percent of Monthly Income
Under 10% 10% to 20% 20% to 30% 30% to 40% 40% to 50% Over 50%
Source: Authors' calculations based on 1990 Survey of Income and Program Par-ticipation.
The Reverse Mortgage Group
To examine in more detail the types of households that might be inter-ested in taking out reverse mortgages, this section focuses on the elderly reverse mortgage group, defined as all households aged 62 and older who could increase their post-debt effective income by at least 20%.
The reverse mortgage group represents 38.5% of elderly homeownere. Table 4 indicates that this group has median monthly income $700 below that of all elderly homeowners, and housing equity significantly above the median for all elderly homeowners. These homeowners typically are
41.8 23.8 11.1 6.9 4.2 12.2 46.9 22.9 9.9 6.0 4.2 10.1 37.2 23.7 12.9 7.4 4.8 14.0
7.25% and 4 . 3 % , respectively, the number of households that would have in-creases in income greater than 20% would rise by only about 1.5%. That number jumps to a little over 4% when the simulated program allows households to use lump-sum payments from the reverse mortgage to retire existing debt that carries higher interest rates. Besides the interest savings, retiring existing debt with a tenure reverse mortgage has the additional advantage of setting the term for re-paying the principal equal to the borrower's actual lifetime.
Table 4 • Comparison of reverse 1990. Median Age (years) Income ($) Home Equity ($) Liquid Wealth ($) Total Wealth ($)
Reverse Mortgage Payment ($) (monthly)
mortgage group to all elderly
Elderly Reverse Mortgage Group^ 76 1.064 85,000 10,340 215,101 400 Life Expectancy Remaining (years) 10
homeowners. All Elderly Homeowners 71 1,733 64,000 15,000 256,398 218 13 Number in Sample 1,273 3,405 Percent No Children
Liquid Wealth Under $5,000 Incomes below:
33rd Percentile of All Incomes Poverty Line
Poverty Line After Reverse Mortgage 24.3 40.6 46.7 15.9 4.2 21.1 36.8 25.1 8.0 3.1 ' The reverse mortgage group includes all elderly households whose monthly incomes, net of debt, would increase at least 20% with a reverse mortgage. Source: U.S. Bureau ofthe Census, Survey of Income and Program Participation,
1990; U.S. Department of Heaith and Human Services, Vital Statistics of the United States, 1988, Volume II, Part A, Table 6 - 3 .
also older (have a shorter life expectancy) than all elderly households and are eligible for higher reverse mortgage payments. About one-quarter of the members of the reverse mortgage group have no children and thus, are lacking a bequest motive, which many believe to be a deterrent to reverse mortgages. The median household in the reverse mortgage group would receive a monthly payment of $400, representing an increase in income of almost 40%.
Table 5 • Geographic profile of the reverse mortgage group
New England Middle Atlantic East North Central West North Central South Atlantic East South Central West Souih Central Mountain Pacific Percent of Elderly Reverse Mortgage Group" 6.1 19.5 16.1 7.7 17.6 5.6 6.9 3.4 17.1 Percent of All Elderly Homeowners 4.6 17.1 18.0 9.3 19.1 6.7 8.9 4.3 12.0 Reverse Mortgage Group as a Percentage of Elderly Homeowners in Region 50.0 42.7 33.4 31.1 34.4 31.1 29.0 29.1 53.4
" The reverse mortgage group includes all elderly households whose monthly incomes, net of debt, would increase at least 20% with a reverse mortgage. Alaska included in Mountain Region.
Source: U.S. Bureau ofthe Census, Survey of Income and Program Participation, 1990.
Reverse mortgages could substantially improve the welfare of many im-poverished elderly households. Almost 16% of households in the reverse mortgage group are below the poverty line, a percentage that is higher than the poverty rate for all elderly households. Including reverse mort-gage payments in income, however, lowers the poverty rate for the group to 4.2%. Among all elderly homeowners, reverse mortgages could cut the poverty rate from 8% to 3%.
Potential purchasers of reverse mortgages reside in all areas of the coun-try, with each Census region having at least 29% of all elderly home-owners in the reverse mortgage group (Table 5). The highest percentages of potential reverse mortgage purchasers live in the Pacific, New England and Mid-Atlantic regions. This is not surprising, since between 1982 and 1991 New England experienced the fastest rate of increase in regional
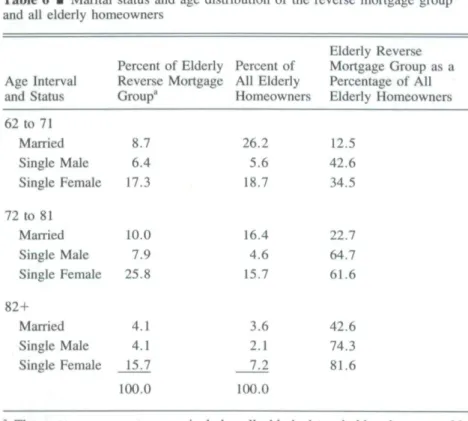
Table 6 • Marital status and age distribution of the reverse mortgage group and all elderly homeowners
Age Interval and Status 62 to 71 Married Single Male Single Female 72 to 81 Married Single Male Single Female 82 + Married Single Male Single Female Percent of Elderly Reverse Mortgage Group'' 8.7 6.4 17.3 10.0 7.9 25.8 4.1 4.1 15.7 100.0 Percent of All Elderly Homeowners 26.2 5.6 18.7 16.4 4.6 15.7 3.6 2.1 7.2 100.0 Elderly Reverse Mortgage Group as a Percentage of All Elderly Homeowners 12.5 42.6 34.5 22.7 64.7 61.6 42.6 74.3 81.6
^ The rever.se mortgage group includes all elderly households whose monthly incomes, net of debt, would increase at least 20% with a reverse mortgage. Source: U.S. Bureau ofthe Census, Survey of Income and Program Participation,
1990.
house prices (91%), followed by Northern California (81%) and the Mid-Atlantic (69%), according to Haurin, Hendershott and Kim (1991).^ The reverse mortgage group is composed mostly of older, single-person households (Table 6). More than three-quarters of all single homeowners aged 82 or over potentially would benefit significantly from a reverse mortgage. Even among younger couples, however, significant numbers
' Menil, Finkel and Kutty (1992) found a much more limited geographic con-centration of demand for reverse mortgages, possibly because they imposed in-come and house value constraints that may not have been met by households in some regions of the country.
of households might find reverse mortgages appealing, including over 12% of 62- to 71-year-old homeowners and 22% of homeowners aged 72 to 81.
Reverse Mortgage Payments as Liquid Wealth
While the potential market for reverse mortgages typically is evaluated in terms of changes in a borrower's monthly income, many elderly house-holds might prefer to get irregular payments, whether in a single lump sum or as an equity-based line of credit, to draw upon in times of need. In fact, one-half of all borrowers in the FHA-insured program chose to use the reverse mortgage solely for a credit line, while another 23% chose the credit line combined with either the term or tenure option (U.S. De-partment of Housing and Urban Development 1992). An American As-sociation of Retired Persons (AARP) survey showed that even among per-sons expressing no current need for a reverse mortgage, 84% wanted the instrument available in case a problem developed.'"
The interest in equity-based lines of credit is not surprising, given the illiquid wealth profile of many homeowners. About 37% of elderly home-owners have less than $5,000 of liquid wealth and are susceptible to fi-nancial shocks that could force them to sell their home. These fifi-nancial shocks could be hous ing-related (such as the failure of a roof or rotting tile in the bathroom), health-related (for example, the need for specific care or drugs not covered by insurance), or even auto-related.
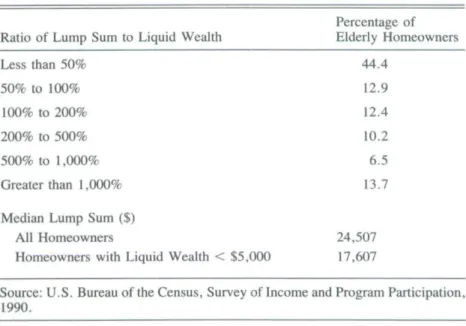
As is clear from Table 7, lump sum payments would substantially in-crease the liquid wealth of many elderly homeowners. A reverse mort-gage could increase the liquid wealth of almost one-third of all households by more than 200%, with about 14% of all homeowners potentially in-creasing liquid wealth tenfold or more. The median lump sum payment for all homeowners would be $24.(X)0 (as compared with liquid wealth of $15,000); whereas households with liquid wealth of less than $5,000 would receive a median payment of over $17,000.
Barriers to Acceptance of Reverse Mortgages
Despite the large numbers of elderly homeowners who could potentially benefit from a reverse mortgage, few financial institutions have shown interest in offering the product. Older consumers tend to be more finan-cially conservative than the general population, and one difficulty is the
Table 7 • Distribution of ratio of lump sum payment to liquid wealth among all elderly homeowners
Percentage of Ratio of Lump Sum to Liquid Wealth Elderly Homeowners Less than 50% 50% to 100% 100% to 200% 200% to 500% 500% to 1,000% Greater than 1,000%
Median Lump Sum ($) All Homeowners
Homeowners with Liquid Wealth < $5,000
Source: U.S. Bureau ofthe Census, Survey of Income and Program Participation, 1990. 24 17 44 12 12 10 6 13 ,507 ,607 ,4 .9 .4 .2 .5 .7
high cost of borrower counseling and the slow process of educating them about the properties of a complex new financial product.
Acceptance of reverse-mortgage products by low-income elderly may also be hampered by the effect that taking out a reverse mortgage can have on eligibility for public assistance such as Supplemental Security Income (SSI) or Medicaid, which many states base on eligibility for SSI. While the proceeds of a reverse mortgage structured as an advance from a lend-ing institution under promissory note secured by a lien on the home are not counted as income for the purposes of eligibility for SSI, if the money accumulates in the bank account instead of being spent every month, it will be counted as a "resource" and may make the borrower ineligible for benefits. This makes taking a reverse mortgage in a lump sum as a cushion against possible emergencies very unattractive for low-income elderly on public assistance.
If the proceeds of a reverse mortgage are used to purchase an annuity, the annuity payments are considered to be income, rather than proceeds of a loan. If the annuity payments push the borrower above the allowable
income minimum, the annuity would make the borrower ineligible for public assistance. This makes the annuity option unattractive to low-in-come elderly.
Furthermore, the interest earnings on the annuity constitute taxable in-come, and so the annuity structure also has drawbacks for those elderly who are not on public assistance and have taxable income. While re-ceiving payments for life regardless of whether one continues to live in the house would no doubt be desirable for many potential consumers of reverse mortgages, a better instrument of this type might provide pay-ments for life while still being legally structured as a loan, so that the payments are not considered to be income.
Conclusion
This paper shows that the potential market for reverse mortgages is larger than previously thought. The results make clear that simply considering the median reverse mortgage payment among all households (or even a subset of households in specific age or income categories), as has been done in other studies, ignores important information. Examination of the distribution of households indicates that this instrument potentially would provide a large boost in income for a significant minority of homeowners. Calculations from this study, using 1990 Census population estimates of the number of persons age 62 and over, show that over six million home-owners in the United States could increase their effective monthly income by at least 20% by using a reverse mortgage." Of these, more than 1.3 million have no children. Furthermore, a reverse mortgage market would allow over 1.4 million poor elderly persons to raise their income above the poverty line.
Almost five million households could receive a lump sum payment from a reverse mortgage that is at least twice as large as their current holdings of liquid assets, and 2.3 million households could increase their liquid assets more than ten times with a reverse mortgage. These households could especially benefit from a market for reverse mortgages, giving them access to resources in case of financial emergencies without losing their home.
'' Because the SIPP is a representative sample, the Census estimate of 24 million elderly households in 1990 and the population percentages shown in the paper can be used to estimate the size of the reverse mortgage market.
Today over 37 million persons are elderly; the Census Bureau expects that number to increase to 41 million by the year 2(KX), and to almost 66 million by the year 2020. Moreover, the demographic trends over the past three decades suggest that not only will the number of the elderly increase rapidly in the future, but they are more likely to be single and without heirs, and thus have a lower bequest motive. The growth of a market for reverse mortgages, however, will depend not only on the size of the po-tential market, but also on institutional constraints, the structure and at-tractiveness of private-sector reverse mortgage contracts and consumer acceptance. Government involvement may help demonstrate consumer in-terest in such a market. Private institutions, however, will determine how these issues are resolved and whether the reverse mortgage market grows to the extent that many people have predicted.
The authors would like to thank Katharine Bradbury. Richard Kopcke. Isaac Megbolugbe, an anonymous referee for helpful comments, Steven Venti for pro-viding some computer programs from previous research, and Mike Jud for ex-ecellent research assistance.
References
Haurin. D. R., P. H. Hendershoti and D. Kim. 1991. Local House Price Indexes; 1982-1991. Journal of the American Real Estate and Urban Economics Asso-ciation 19(3); 451-472.
Hurd, M. D. 1987. Savings ofthe Elderly and Desired Bequests. American Eco-nomic Review 77(3): 298-312.
^. 1990. Research on the Elderly; Economic Status, Retirement, and Con-sumption and Saving. Journal of Economic Literature 28(2): 565-637.
Kotlikoff. L. J. and L. Summers. 1981. The Role of Intergenerational Transfers in Aggregate Capital Accumulation. Journal of Political Economy 89(4): 7 0 6 -32.
Menchick, P. and D. Martin. 1983. Income Distribution, Lifetime Savings and Bequests. American Economic Review (73): 672-90.
Merrill, S. R.. M. Finkel and N. Kutty. 1992. The Market for a Reverse Mort-gage Program for the Elderly Homeowners. Paper presented at the 1993 Fannie Mae conference. Reverse Mortgages.
Mirer, T. 1979. The Wealth-Age Relation Among the Aged. American Economic Review (69): 435-43.
Scholen, K. 1993. Consumer Response to Reverse Mortgages. Paper presented at the 1993 Fannie Mae conference. Reverse Mortgages.
U.S. Department of Housing and Urban Development, Office of Policy Devel-opment and Research. 1992. Preliminary Evaluation ofthe Home Equity Con-version Mortgage Insurance Demonstration. Report to Congress. Washington, D.C.
Venti, S. F. and D. A. Wise. 1989. Aging, Moving and Housing Wealth. In David A. Wise, ed.. The Economics of Aging. Chicago: University of Chicago Press.
. 1990. But They Don't Want to Reduce Housing Equity. In David A. Wise, ed.. Issues in the Economics of Aging. Chicago: University of Chicago Press.
. 1991. Aging and the Income Value of Housing Wealth. Journal of Pub-lic Economics (44): 371-97.