National Tax Journal
Vol. LVII, No. 2, Part 2 June 2004
Abstract -Employee stock purchase plans (ESPPs) are designed to promote employee stock ownership broadly within the firm and provide another tax–deferred vehicle for individual capital accu-mulation in addition to traditional pensions, 401(k)s, and stock options. We outline the individual and corporate tax treatment of ESPPs and the circumstances under which ESPPs will be preferred to cash compensation from a purely tax perspective. We then ex-amine empirically ESPP participation using administrative data from 1997–2001 for a large health services company that employs approximately 30,000 people. The picture that emerges from the analysis of these data suggests that there is substantial non–par-ticipation in these plans even though all employees could increase gross compensation through participation. We discuss a number of potential explanations for non–participation.
INTRODUCTION
T
here has been great interest recently in the use of stock– based compensation in American companies. Although there is an older literature on employee stock ownership plans (ESOPs) and an emerging one on stock options (see Murphy (1999) for a recent review), very little research has been done on employee stock purchase plans (ESPPs). An ESPP is a tax–subsidized saving vehicle that allows a worker to use after–tax income to purchase company stock, often at a discount. For employees in most plans, the primary tax advantage comes from the fact that if the shares are held long enough, the discount on the stock gets taxed as capital gains rather than as ordinary income. Because many of the tax advantages are contingent upon the plan being offered broadly within a firm, ESPPs potentially represent a much broader vehicle for company stock ownership than stock option plans typically targeted to top executives and key employees. Indeed, the National Center for Employee Owner-ship (NCEO, 2001a) estimates that over 15 million American workers are eligible for ESPPs.We make three contributions in this paper. First, we de-scribe the institutional features and parameters associated with ESPP plan design.1 Second, we describe the corporate
Employee Stock Purchase Plans
Gary V. Engelhardt Department of Economics and Center for Policy Research, Maxwell School of Citizenship and Public Affairs, Syracuse University, Syracuse, NY 13244
Brigitte C. Madrian Department of Business and Public Policy, The Wharton School, University of Pennsylvania, Philadelphia, PA 19104-6372
1 We do not discuss the corporate finance implications of ESPPs (Hallman
and Rosenbloom, 2001), the impact of taxes on actual dispositions, nor the impact of company stock risk exposure (Mitchell and Utkus, 2002; Poterba, 2003; Meulbrook, 2002; Liang and Weisbenner, 2002).
and personal income tax treatment of ESPPs, and analyze the circumstances under which employers and employees will jointly prefer compensation through an ESPP relative to cash from a purely tax perspective. Finally, we examine empiri-cally patterns of ESPP participation and contributions using administrative data from 1997–2001 for a large health services company.
There are two principal findings. First, compensation through a tax–quali-fied ESPP, the dominant type offered, appears to be less advantageous from a pure tax perspective than through a non–qualified ESPP or cash, unless cor-porate tax rates are substantially below the top statutory rate and there is sub-stantial share price appreciation. Given that tax–qualified ESPPs are the dominant type of plan, this suggests that non–tax considerations play a significant role in the decision to provide these plans. Sec-ond, for most plans, ESPP participation is essentially a risk–free way to increase gross compensation for the employee, yet participation is only about 40 percent at the company we analyze. This suggests that a substantial fraction of employees are either liquidity constrained, do not fully understand these plans, or face non–trivial transactions costs.
This paper is organized as follows. The first section lays out the basic institutional features of and facts about ESPPs. The second section discusses the personal and corporate income tax treatment of ESPPs, respectively. In the third section we then analyze the joint impact of personal and corporate taxes on the employer provision of ESPPs. The fourth section provides an empirical analysis of ESPP participation
and contributions at a single large firm and considers a number of potential explanations for the substantial non–par-ticipation that is observed. There is a brief conclusion.
ESPPs: FEATURES AND FACTS
An ESPP is an employer–sponsored plan that allows employees to purchase company stock with after–tax income. In a typical ESPP plan, employee contributions to the plan are accumulated by payroll deduction over a six–month offering period. At the end of the offering period, contributions are used to purchase shares of the employer’s stock at a 15 percent dis-count off of the market price of the stock at either the beginning or the end of the offering period, whichever is lower.
Although this is the description of a “typical” ESPP plan, there are many ESPP plan design parameters that vary across firms. For example, although the vast majority of plans accumulate em-ployee contributions smoothly over time through payroll deduction, some plans allow employees to purchase shares with cash outright.2 The period over which this accumulation is done, the offering period, is specified in the company’s plan descrip-tion. Although almost half of companies with ESPPs have a biannual (six–month) offering period, this period can be as short a three months or as long as 27 months (the maximum legal time limit for most plans).3 In all plans, employees are permit-ted to purchase shares at the end of the offering period. In addition, plans with sufficiently long offering periods may specify intermediate purchase dates. For example, the offering period may be one
2 The NCEO (2001b) conducted a survey of 247 companies with stock–based compensation plans in 2000. They
found that only 12 percent of ESPP plans allowed for share purchase with a method other than payroll deduc-tion. A survey of 100 firms with ESPPs by Hewitt Associates (1998) found similar results.
3 The NCEO (2001b) found that 46 percent of companies with ESPPs had a six–month offering period, and 11
percent had a three–month offering period. The offering period can only exceed 27 months if the purchase price at the exercise date reflects the market price (that is, there is no discount, as discussed below). In this case, the offering period can be as long as five years.
year, composed of two biannual purchase periods.4
A key plan parameter is the purchase price of the company stock. Although some plans use the fair market value on the purchase date as the purchase price, over three–quarters have what is known as a “look–back” feature, in which the purchase price is the minimum of the fair market value at the beginning and end of the offering period.5 In addition, the employer may offer the shares at a discount legally limited to be no more than 15 percent applied to the minimum price
from the look–back. Naturally, a plan with a
discount and a look–back feature can re-sult in a significant gain at sale when stock prices rise during the offering period. The NCEO (2001b) found that 86 percent of ESPP plans offered employees the full 15 percent legal maximum discount on the purchase price of the stock, six percent offered a 10 percent discount, and only eight percent offered no discount.6
More complicated ESPPs have a “reset” provision, in which if the stock price falls by the end of the purchase period, the plan automatically withdraws the employees’ accumulated payroll deductions for that period, and rolls them into the next of-fering period. This ensures the lowest purchase price to the employee. Some ESPPs also allow employees with accumu-lated payroll deductions to individually withdraw those funds before the end of the offering period. Usually when this occurs, the plan stipulates the employee is no longer eligible to purchase in that period, and, in some plans, may have to
sit out subsequent offering periods before becoming eligible again.7
TAX TREATMENT OF ESPPs
The tax treatment of ESPPs depends on whether the plan is a qualified or non-qualified plan. NCEO (2001b) reported that 77 percent of ESPP plans were qualified. A qualified plan, often referred to as a “423 plan,” must comply with the rules spelled out in Section 423 of the Internal Revenue Code (IRC).8 These rules require that only the employees of the company, parent company or subsidiaries may participate in the plan, and the right to buy company stock is non–transferable. However, em-ployees who own five percent or more of voting power (for all classes of stock of the company, parent, and subsidiaries) are not eligible for the plan. At its discretion, the plan may further legally exclude from par-ticipation highly–compensated employees as defined in IRC Section 414, employees with less than two years of tenure, and employees who work fewer than twenty hours per week or five months per year.9 In practice, however, these exclusions do not appear frequently. For example, NCEO (2001b) reported that 98 percent of plans allowed employees with less than two years of service to participate and 68 per-cent of plans allowed part–time employees to participate.
Beyond these allowable limits on par-ticipation, all employees must, in general, have the same rights and privileges under the plan. Section 423 limits ESPP purchas-es to $25,000 worth of stock (or lpurchas-ess) per
4 NCEO (2001b) found that only 24 percent of plans allowed for interim purchase dates within the offering
period, and those that did had relatively long offering periods. Eighty–eight percent of the interim purchase periods had a length of six months.
5 NCEO (2001b) found that 78 percent of plans had a look–back feature in determining the purchase price. 6 As an alternative to these price discounts, in some plans the employer will match all or part of the employee
contributions to the ESPP (although ESPP matches are much less prevalent than 401(k) matches).
7 NCEO (2001b) reported that 82 percent of plans allowed withdrawals prior to the end of the offering period, but
not enough detail was given in the report to know whether these came with penalties, reset provisions, etc.
8 Section 423 plans are not covered by the Employee Retirement Income Security Act (ERISA). 9 The company ESPP we analyze below does not exclude highly–compensated employees.
calendar year, although this will bind for only a small fraction of employees. Plans may limit further the extent of employee participation, such as the number of shares an employee can purchase or the fraction of employee compensation that can be allocated to the ESPP plan, as long as this restriction is applied uniformly across employees. Most plans limit employee contributions to no more than 10 to 15 percent of compensation, and 71 percent of plans impose limits on share purchases (NCEO, 2001a). Non–qualified plans do not have to conform to these rules and typically are targeted to a select subset of employees, much like non–qualified stock options (NQSOs).
Personal Income Tax Treatment
For a qualified plan (QESPP), the extent of the personal income tax benefit depends on whether the stock is sold in a qualified disposition. A qualified disposition is one that satisfies what is known as the 1–2 holding rule: the employee must hold onto the stock for (1) at least one year after the purchase date and (2) two years after the beginning of the offering period. If this condition is met, the gain at sale is de-composed into two parts: taxable ordinary income and taxable capital gains. Taxable ordinary income is defined as the lesser of (a) the spread between the fair market value at the time of sale and the purchase price and (b) the discount at the beginning of the offering period. The portion that is tax-able as ordinary income is subject to social security (Federal Insurance Contributions Act (FICA)) and unemployment insurance (Federal Unemployment Tax Act (FUTA)) taxation as well. The taxable capital gain (or loss) is simply that part of the gain at sale not treated as ordinary income.10
Mathematically, we express this as follows. Denote the fair market values
of a share of company stock on the first and last days of the offering period as
Pf and Pl, respectively. Let δ denote the discount off the fair market value, which is legally constrained to be 0 ≤ δ≤ 0.15. With a look–back feature, the purchase (exercise) price, Pe , is
[1] Pe = (1 – δ) min(Pf , Pl).
If the share price falls during the period (and there is no reset provision), the partici-pant purchases at the discounted last–day share price, otherwise the participant does no worse than purchasing at the dis-counted first–day share price. Let c be the employee’s contribution rate made out of after–tax income, but expressed as a frac-tion of gross earnings y. Then at a purchase price Pe, the employee will purchase
cy
[2] N = ————————
(1 – δ) min(Pf , Pl)
shares.
If the shares are sold just when the 1–2 rule is met, denoted as period q, the dispo-sition amount is PqN. The total gain from sale is (Pq – Pe)N, which can be decom-posed on a per share basis into two parts: [3] min(δPf , Pq – (1 – δ)min(Pf , Pl)) and
[4] Pq – (1 – δ)min(Pf , Pl) – min(δPf , Pq
– (1 – δ)min(Pf , Pl)).
Equation [3] is the portion of the gain at sale that is taxed as ordinary income, which is the lesser of (a) the spread be-tween the fair market value at the time of sale, Pq, and the purchase price, Pe = (1 – δ)min(Pf , Pl), and (b) the discount at the beginning of the offering period, δPf . Equation [4] is the portion of the gain at
10 Unlike incentive stock options (ISOs), the excess of the fair market value over the purchase price does not
sale taxed at the long–term capital gains rate.
Participants in a qualified plan may not meet the holding requirements in the 1–2 rule, and, therefore, trigger a disqualify-ing disposition. The spread between the fair market value on the purchase date and the purchase price, Pl – Pe, is treated as cash compensation and is taxed in the
calendar year in which the disposition occurs.
The difference between the sale price and fair market value at purchase, Ps – Pl, is taxed (offset) as a capital gain (loss) at the appropriate capital gains rate depending upon how long the stock was held. The most common disqualifying disposition is to buy company stock and sell it im-mediately after purchase, known as a “same–day sale.”
For dispositions from a non–qualified plan (NQESPP), the spread between the fair market value on the purchase date and the purchase price, Pl – Pe , is treated as cash compensation and is taxed in the
calendar year in which the purchase occurs.11
The difference between the sale price and the fair market value at purchase, Ps – Pl , is taxed (offset) as a capital gain (loss) at the appropriate capital gains rate depending upon how long the stock was held.
Corporate Tax Treatment
At the corporate level, there is also asymmetric tax treatment of QESPPs and NQESPPs. In an NQESPP, the spread between the fair market value on the pur-chase date and the purpur-chase price, Pl – Pe , is treated as cash compensation on which the firm must pay its statutory portion of the payroll tax. The firm deducts the total compensation cost (cash plus payroll tax) in the tax year when the purchase occurred when calculating its corporate income tax. For a disqualifying disposition
in a QESPP, the spread between the fair market value on the purchase date and the purchase price, Pl – Pe , is treated as cash compensation on which the firm must pay payroll tax. However, the firm deducts the total compensation cost (cash plus payroll tax) in the tax year when the disqualifying
disposition occurred when calculating its
corporate income tax. For a qualifying
dis-position in a QESPP, the firm does not get a
corporate tax deduction, not even for the ordinary income the employee ultimately will claim for the personal income tax.
An Example
Consider a typical QESPP with a 15 percent discount (δ = 0.15), look–back, and a six–month offering period. Assume the employee is paid $42,500 annually and (on an after–tax basis) contributes five percent of gross pay to purchase stock, or cy = $2,125. Let the share price be $5 on the first day of the offering period (Pf = $5) and $8 on the last day of the offering period (Pl = $8). With the discount and look–back, the employee gets to purchase at a price, Pe , of $4.25 ($5.00 × 0.85). The total number of shares purchased with the $2,125 con-tributed is, thus, N = 500.
Assume first that the employee holds the shares 18 months for a qualified dis-position. Let the price at disposition, Ps, be $15, which implies a disposition of $7,500. The total gain at sale is $7,500 – $2,125 = $5,375. The discount at the start of offering period was $0.75 per share ($5.00 × 0.15), or $375 ($0.75 × 500). This is less than the total gain at sale, so $375 is taxed as ordinary income and is subject to FICA and FUTA taxes; the remainder, $5,000 ($5,375 – $375), is taxed as a long–term capital gain. Fur-thermore, because the shares were held for a qualified disposition, the employer gets no corporate tax deduction.
11 Therefore, a disqualifying disposition from a QESPP is treated the same as a disposition from an NQESPP
for both personal and corporate taxation, with the only potential difference being the timing of the ordinary income received for the personal tax and the deduction taken for the corporate tax.
Now assume that the shares were dis-posed of immediately after purchase in a same–day sale. In this case, the disposition is $4,000 ($8 × 500). The total gain at sale is $4,000 – $2,125 = $1,875, all of which is taxed as ordinary income and is subject to FICA and FUTA taxes. Because the shares were sold in a disqualifying disposition, the employer gets a corporate tax deduc-tion for the amount, $1,875, taxed as or-dinary income; the employer’s statutory FICA and FUTA taxes on the $1,875 are deductible as well.
TAXES AND THE EMPLOYER PROVISION OF ESPPs
The employer has a choice between offering compensation through cash or an ESPP. To determine which form is pre-ferred, we consider the tax consequences to the employer and employee jointly using the global contracting approach of Scholes et al. (2002). Under this approach, we compare the net benefit to the employ-ee from two forms of compensation that have the same present value after–tax cost to the employer. If one form is tax–pre-ferred by the employee, it will be jointly tax–preferred. Because a QESPP in which all dispositions are disqualifying and an NQESPP are treated effectively the same from the corporate and personal tax per-spectives, a useful point of departure is to compare cash to NQESPP compensation. Later we consider the tradeoff between an NQESPP and QESPP explicitly.
Cash vs. NQESPP Compensation
Without loss of generality, we begin by assuming that the employer wants to pay the employee an additional amount
of compensation above and beyond current gross earnings y.12 Second, we note that once the employee purchases shares through an NQESPP, there is no preferential personal capital gains treat-ment relative to a private purchase by the employee outside of an NQESPP using after–tax cash compensation, and there are no corporate tax implications upon sale. Therefore, the decision to offer an NQESPP hinges solely on the amount and tax treatment of compensation provided to the employee at the time of purchase, and how it is jointly valued relative to cash.13
Specifically, the additional compensa-tion m to the employee who contributes cy to the ESPP is the difference between the fair market value and the exercise price at the time of purchase, Pl – Pe, multiplied by the number of shares purchased, which by [1] and [2] is
Pl
[5] m =
[
———————— – 1]
cy . (1 – δ) min(Pf , Pl)Let τcg be the marginal tax rate on long–
term capital gains, τO be the marginal tax
rate on ordinary income, τP be the
mar-ginal payroll tax rate, and τC the corporate
tax rate. In an NQESPP, m is treated as cash compensation on which the firm must pay its statutory portion of the payroll tax, which is deductible, so that the total net compensation cost to the firm on the last day of the offering period is (1 – τC)(1
+ τP)m. In present value, this is equal to
(1 – τC)(1 + τP)m[1 + (1 – τC)rC]–(l–f) on the
first day of the offering period, where rC is the corporate gross rate of return. On a present value after–tax basis, the em-ployer is indifferent to paying m through
12 Our approach is similar to the approach of Hall and Liebman (2000), who discuss the impact of taxes on the
provision of NQSOs and ISOs. Specifically, the thought experiment here is not to hold the marginal product of labor constant and potentially re–allocate some of current gross earnings to ESPP compensation, in which case there might be gross earnings offsets to those employees who value the ESPP the most.
13 An important non–tax concern in ESPP plan administration is the dilution from offering shares at a discount.
We do not explicitly model this cost to the employer, nor do we model any potential benefit to the employer from increased employee ownership.
an NQESPP on the last day and m′ in cash compensation on the first day of the offer-ing period, where m′ = m[1 + (1 – τC)rC]–(l–f),
which would cost the firm (1 – τC)(1 +
τP)m[1 + (1 – τC)rC]–(l–f) as well.
After payroll and ordinary income taxes, the employee values m′ in cash on the first day of the offering period as (1 – τP– τO)m′,
but values m in deferred compensation on the last day of the offering period as (1 – τP
– τO)m[1 + ρ]–(l–f), where ρ is the employee’s
discount rate. Technically, this discount rate is the sum of the pure rate of time preference from period f to l and the op-portunity cost to the employee of foregoing the use of the contribution cy during the of-fering period. As long as this discount rate exceeds the net corporate rate of return, ρ
> (1 – τC)rC, the employee will prefer the
compensation paid in cash. NQESPP vs. QESPP
Recall that the employer does not get a corporate tax deduction for compensation of m paid through a qualifying disposition
in a QESPP, but is able to deduct m at pur-chase in a NQESPP. This means that the employer is indifferent between paying compensation of m through a QESPP to
m/[(1 + τP)(1 – τC)] through an NQESPP.
For compensation of m in a QESPP, if the shares are sold just when the 1–2 rule is met, then from [2]–[4] the present after–tax value to the employee at q is
[6]
The first term in square brackets is the portion of the gain at sale that is taxed as ordinary income, and the second term in square brackets is the portion of the gain at sale taxed at the long–term capital gains rate. In contrast, for compensation of m/[(1 + τP)(1 – τC)] in an NQESPP, if the
shares are sold at q, the after–tax value at
q to the employee is
[7]
+
The first term in square brackets in [7] is the portion of the gain at sale that is taxed as ordinary income (expressed in period
q dollars), and the second term in square brackets is the portion of the gain at sale taxed at the long–term capital gains rate. Therefore, whether the compensation is paid through a QESPP versus an NQESPP depends upon under what values of τcg, τO,
τP, and τC [6] dominates [7], given rC and a
share price path.
There are two clear predictions from [6] and [7]. First, a QESPP should become relatively more desirable as the corporate tax rate falls, because compensation paid through a QESPP is not corporate tax deductible but is through an NQESPP. Sec-ond, a QESPP should become relatively
more desirable as the spread between the ordinary and long–term gains rates wid-ens, and the employee is able to convert a larger portion of ESPP compensation from ordinary to capital gains income.
Figure 1 shows how the tax advantage of compensation through a QESPP versus
[
min(δPf , Pq – (1 – δ) min(Pf , Pl))cy]
—————————————— (1 – τO – τP) (1 – δ) min(Pf , Pl)[(
Pl)
———————— –(1 – δ) min(P 1 f , Pl)(
m)
—————— (1+τ P)(1–τC) [1 + (1 – τC)rC](q–l)]
(1 – τO – τP)[(
Pq – Pl)
———————— (1 – δ) min(P f , Pl)(
m)
—————— (1+τ P)(1–τC) [1 + (1 – τC)rC](q–l)]
(1 – τcg).[
Pq – (1 – δ) min(Pf , Pl) – min(δPf , Pq – (1 – δ) min(Pf , Pl))cy]
——————————————————————— (1 – τcg) .
(1 – δ) min(Pf , Pl) +
Figur e 1. Tax Advantage of QESPP to NQESPP by Corporate T ax Rate, 10% Annual Shar e Appr eciation
an NQESPP (defined as the quotient of [6] to [7]) changes with the corporate tax rate,
τc, assuming both a 15 percent discount
and a look–back, annual share price ap-preciation of 10 percent, a profit rate of ten percent, and q – l equal to 18 months (the minimum required holding time for a qualified distribution with a six–month offering period). A tax advantage of greater than one means that the QESPP is preferred to the NQESPP.
As noted above, the tax advantage declines as the corporate tax rate rises, holding other tax rates fixed. Specifically, the solid line gives the tax advantage for an employee with marginal tax rates of 28, 7.65, and 20 percent on ordinary income, payroll, and long–term capital gains, respectively. At the statutory corporate tax rate of 35 percent the tax advantage is 0.89, which implies that the personal tax benefit from the compensa-tion paid through a QESPP is 89 percent of that if paid through an NQESPP. This employee prefers the QESPP only when the corporate tax rate falls below 22 per-cent. The single–dashed line gives the tax advantage for a high–income employee in the top income tax bracket and above the OASDI taxable earnings cap, with marginal tax rates of 39.6, 1.45, and 20 percent on ordinary income, payroll, and long–term capital gains, respectively.14 At the statutory corporate tax rate of 35 per-cent, the tax advantage is 0.88 in this case. This employee prefers the QESPP only when the corporate tax rate is 20 percent or less. Finally, the double–dashed line gives the tax advantage for a low–income employee with marginal tax rates of 15, 7.65, and 10 percent on ordinary income, payroll, and long–term capital gains, respectively. At the statutory corporate tax rate of 35 percent, the tax advantage
is 0.88 in this case. This employee prefers the QESPP only when the corporate tax rate is 21 percent or less.
Figure 2 illustrates how the tax advan-tage changes as the marginal tax rate on long–term capital gains changes, using the same parameter values as in Figure 1, except the corporate tax rate is fixed at 35 percent. The tax advantage declines as the capital gains rate rises, holding other tax rates fixed. However, the QESPP is never preferred to the NQESPP by any of the employees under this parameter-ization.
Empirical Implications
This analysis of the influence of taxes on the incentives for employers to provide ESPPs highlights two important issues for empirical analysis. First, QESPPs are offered far more frequently than NQESPPs (77 percent of plans vs. 23 per-cent as reported by NCEO (2001b)), even though the latter seem to have a greater tax advantage. In contrast, the vast major-ity of stock option plans, 95 percent, are non–qualified (Hall and Liebman, 2000). Yet for the three prototypical employees illustrated in Figure 1, QESPPs are jointly tax–preferred to NQESPPs only when the corporate tax rate is substantially below the top statutory rate of 35 percent (in the 20–22 percent range, depending upon the employee). Indeed, the assumption of large capital gains associated with 10 percent annual share price appreciation helps to drive the relative attractiveness of QESPPs in the figure. If annual share price appreciation is instead assumed to be 1 percent, then QESPPs dominate NQESPPs only when the corporate tax rate is in the 14–18 percent range (depending on the employee).
14 This line actually lies below the lines for 28 and 15 percent marginal tax rates on ordinary income, respectively.
The tax value is monotonically increasing in the ordinary income tax rate, holding other tax rates fixed; how-ever, the line for the 39.6 percent marginal tax rate has a lower payroll tax rate of 1.45 percent. If the payroll tax rate were assumed to be 7.65 percent, the 39.6 percent marginal tax rate line would lie above the lines for the 28 and 15 percent rates.
Figur e 2. Tax Advantage of QESPP to NQESPP by Capital Gains T ax Rate, 10% Annual Shar e Price Appr eciation
This naturally raises the question of why firms even offer QESPPs. One po-tential explanation is some firms do have both a low marginal corporate tax rate (due to low corporate taxable income) and sufficiently high share price appreciation to make offering a QESPP desirable from a tax perspective. In this regard, NCEO (2001b) reports that the top three indus-tries in 2000 with ESPPs were software, e–commerce, and semiconductor and electronic component manufacturing.
Another explanation is that the non–tax benefits of broad–based employee owner-ship through qualified plans often cited in the plan administration literature, such as increased loyalty and retention, are sufficiently large to offset any tax disad-vantage relative to a non–qualified plan. We note, however, that there is nothing in principle that prevents the employer from offering an NQESPP that is broad–based and uniform across employees and, thus, mimics a QESPP in design. In practice, there appear to be design differences in the two types of plans. For example, NCEO (2001a) reported that, even though there is nothing that prohibits the employer from doing so, most NQESPPs did not offer a discount on the purchase of company stock, which is common in QESPPs.
The accounting treatment of ESPPs may explain this. Specifically, QESPPs have been deemed as noncompensatory plans for accounting purposes, such that there is no expense recognition at grant, exercise, or sale. However, NQESPPs that provide a discount and are not broad–based may recognize an expense for the amount of the discount (similar to NQSOs granted in the money prior to 2000). This potential non–tax cost of NQESPPs may explain both why NQESPPs typically have not offered discounts and why QESPPs have been the dominant type of plan.
Second, given that the employer has chosen to offer an ESPP, employee partici-pation would be predicted to be 100 per-cent if all employees were fully informed,
financially rational, with access to perfect capital markets and no transactions costs, because contributing to an ESPP and disposing of shares in a same–day sale is essentially a risk–free way to increase gross compensation. To see this, note that the factor in square brackets in [5] is the gross return to the employee on the contribution if the shares are disposed of in a same–day sale. With a 15 percent discount (δ = 0.15), which is typical, this return is 17.6 percent even with zero or negative share appreciation during the offering period. For a six–month offering period, this implies an annualized rate of return of over 38 percent, far above the annual interest rate charged on credit card debt. Moreover, this is the lower–bound on the potential return to ESPP participa-tion—with a look–back and any positive share appreciation, the actual return can be even greater. Only employees not fully informed or who were unable to borrow would not find participation attractive.
EMPIRICAL ANALYSIS WITH COMPANY DATA
Unfortunately, we do not have data on a large random sample of companies to examine empirically the impact of taxes on the employer provision of ESPPs, and leave that analysis for future research. Instead, in the remainder of the paper, we examine patterns of ESPP participation and contributions using administrative data from 1997–2001 for a large health services company that employs approxi-mately 30,000 people. We use the perfect capital markets, perfectly informed, no transactions cost model as a point of departure for the analysis of employee participation conditional on the firm having
decided to offer the plan. Not surprisingly
(at least to some readers), we do not find the universal participation in the ESPP plan that this paradigm would suggest. Because of this, we first lay out what employee characteristics are correlated
with participation, and then we outline a number of alternative factors that might explain the substantial non–participa-tion.
Company Data Description
The company data come from eight cross–sectional snapshots of all active employees: June and December, 1997; June and December, 1998; June and December, 1999; June, 2000; and December, 2001. The data contain basic administrative items, such as hire date, birth date, race/ethnic-ity, gender, and gross pay. The data also include variables that capture several important aspects of employee stock pur-chase plan participation, although we do not have all of this information available for some of the early cross sections. The ESPP data include participation status, the contribution rate, number of shares held, and, for later cross–sections, the number of shares bought and sold. We also have data on 401(k) participation, such as current participation status and an individual’s current contribution rate and investment allocation. In addition, we have data on stock options, which are granted to less than 15 percent of the company’s employ-ees, at a single point–in–time.
There are four non–wage/savings programs sponsored by this company. The first is the 401(k) plan. This plan is discussed in greater detail in Madrian and Shea (2001). Company stock is not an investment option within the 401(k) plan, and employer matching contribu-tions are not made in the form of company stock.
The second savings plan sponsored by the company is the QESPP. The features of this company’s employee stock purchase plan are fairly standard. The plan has two annual offering periods that begin on January 1 and July 1 of each calendar year and are six months in duration. Employees can contribute to the plan an integer percentage of gross earnings up to
a maximum of 10 percent through payroll deduction. The plan has both a look–back feature and a discount—the stock pur-chase price is 15 percent off of the lesser of the fair market price at the beginning and the end of the offering period. All full–time employees are eligible for the plan, as are part–time employees working 20 or more hours per week and temporary employees with assignments lasting more than five months. Beginning in 1999, all employees were immediately eligible to participate upon hire (although they could not actually enroll until the next offering period); before 1999, there was a 60–day service requirement.
The third company–sponsored savings plan is an employee stock ownership plan (ESOP). This plan is not associated with the 401(k) plan and is not voluntary. At year–end, the company allocates a total number of shares, determined annually on the basis of corporate profitability, to the ESOP. These shares are then distrib-uted across employees on the basis of employee compensation (that is, higher paid employees receive proportionately more shares). Overall, however, the ESOP is small—the mean value of the ESOP ac-counts is just over $300—and, in fact, the ESOP was discontinued toward the end of our sample period.
Finally, the company grants stock op-tions to approximately 4,000 of its 30,000 employees. These tend to be the more highly compensated managerial employ-ees within the firm. Unfortunately, we do not have very extensive information on the stock options granted to employees over time, or on when they are exercised. We do, however, have a snapshot of the stock options held by employees at a single point in time.
The sample used for our analysis is all employees who are ESPP eligible, 401(k) eligible, and who have been with the company for at least 1 year. We impose the tenure restriction because the service requirements for both ESPP and 401(k)
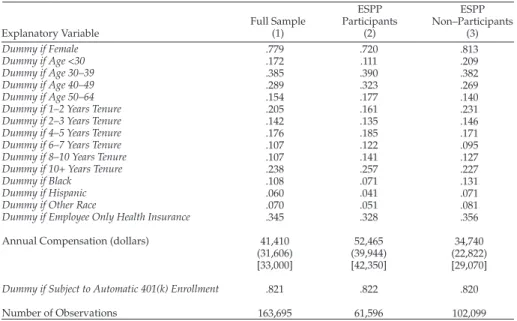
eligibility changed during the period cov-ered by our data. Employees with more than one year of tenure, however, were continuously eligible to participate in both plans over the entire time period. Condi-tional on having one year of tenure, almost 99 percent of employees are eligible for both the ESPP and 401(k) plan. Overall, our sample includes 163,695 person–year observations on 44,943 employees. Table 1 gives summary statistics on the employees in our sample.
One feature of the compensation struc-ture that changed quite significantly over our sample period is the switch to auto-matic enrollment in the 401(k) plan. Prior to 1998, employees were only enrolled in the 401(k) if they made an affirmative election. Beginning April 1, 1998, however, all newly hired employees were automati-cally enrolled in the plan and required to contribute 3 percent of pay unless they
actively opted out of participation (a so–called negative election). Madrian and Shea (2001) examined in greater detail the impact of automatic enrollment on 401(k) participation, contribution rates, and investment allocation. While ESPP participation at this company always has been through an affirmative election, the dramatic increase in 401(k) participation from automatic enrollment documented in Madrian and Shea (2001) could have affected ESPP participation if employ-ees viewed the 401(k) and the ESPP as substitute saving vehicles.15 We discuss this below.
Participation and Contributions: Basic Facts
Table 2 gives summary statistics on ESPP participation and contribution rates for each cross–section. Column (1)
TABLE 1
SAMPLE MEANS OF SELECTED VARIABLES
ESPP Non–Participants (3) Dummy if Female Dummy if Age <30 Dummy if Age 30–39 Dummy if Age 40–49 Dummy if Age 50–64 Dummy if 1–2 Years Tenure Dummy if 2–3 Years Tenure Dummy if 4–5 Years Tenure Dummy if 6–7 Years Tenure Dummy if 8–10 Years Tenure Dummy if 10+ Years Tenure Dummy if Black
Dummy if Hispanic Dummy if Other Race
Dummy if Employee Only Health Insurance
Annual Compensation (dollars)
Dummy if Subject to Automatic 401(k) Enrollment
Number of Observations .779 .172 .385 .289 .154 .205 .142 .176 .107 .107 .238 .108 .060 .070 .345 41,410 (31,606) [33,000] .821 163,695 .720 .111 .390 .323 .177 .161 .135 .185 .122 .141 .257 .071 .041 .051 .328 52,465 (39,944) [42,350] .822 61,596 .813 .209 .382 .269 .140 .231 .146 .171 .095 .127 .227 .131 .071 .081 .356 34,740 (22,822) [29,070] .820 102,099 Source: Authors’ calculations. The sample is pooled cross–sectional data from the company studied and is restricted to individuals who are eligible for the ESPP, the 401(k) and have at least one year of tenure with the firm. Standard deviations are reported in parentheses, medians in brackets.
Explanatory Variable Full Sample (1)
ESPP Participants
(2)
15 Madrian and Shea (2001) noted in their paper that it did not appear that the increase in 401(k) savings observed
shows the sample size of each cross–sec-tion. Column (2) illustrates that across all employees, the participation rate, defined as the share of eligible employees having committed to purchase shares in that cross–section’s offering period (not as having a positive ESPP share balance) fluctuated between 35 and 38 percent and then rose to almost 44 percent in December, 2001. During this same period, the stock price appreciated significantly. The time path of share prices is shown in Figure 3, along with the S&P 500 for comparison. Column (4) of Table 2 shows that the average contribution rate
(conditional on participating) was basi-cally time–invariant, hovering around 4.6 percent of pay. Only 7.7 percent of em-ployees (or 20 percent of participants) contributed 10 percent of pay, the plan limit.
Columns (1)–(3) of Table 3 show ESPP participation and contribution rates by various demographic and job characteris-tics measured in the administrative data: gender, age, race, job tenure and gross pay. The first set of rows in Table 3 shows that ESPP participation is much higher for men than women (47.6 percent vs. 34.8 percent), so that being female is
associ-TABLE 2
SUMMARY STATISTICS ON ESPP PARTICIPATION AND CONTRIBUTION RATES Mean ESPP Contribution Rate of Participants (%) (4) 06/1997 12/1997 06/1998 12/1998 06/1999 12/1999 06/2000 12/2001 20,896 20,333 21,808 19,189 20,350 19,824 19,829 21,466 36.0 37.2 35.8 37.1 35.8 37.1 38.0 43.8 1.6 1.7 1.7 1.7 1.6 1.7 1.8 2.0 4.5 4.5 4.6 4.5 4.6 4.6 4.7 4.7 Source: Authors’ calculations. The sample is restricted to individuals who are eligible for the ESPP, the 401(k) and have at least one year of tenure with the firm.
Observation Date Sample Size (1)
ESPP Participation Rate (%) (2) Mean ESPP Contribution Rate (%) (3)
ated with a reduction in participation of 12.8 percentage points. Participation rates are substantially higher for whites than for blacks, Hispanics, or individuals of another or unknown race. In particular, blacks have a participation rate that is 16.5 percentage points lower than that of whites. Finally, the other rows of the table indicate that participation increases monotonically with age, tenure, and income.
We include the tabulations on 401(k) behavior for employees hired prior to automatic enrollment, shown in columns (4)–(6), as an important comparison. In
principle, under the perfect capital mar-kets, perfect information, no transactions costs model, 401(k) participation also
should be 100 percent and all employ-ees should contribute to the plan limit, because the employees can receive the employer match, cash out, pay the early withdrawal penalty tax, and still come out ahead. This is clearly not the case, as 401(k) participation, though higher than ESPP participation, is also well below 100 percent. As with the ESPP, 401(k) partici-pation is much higher for men and whites and increases with age, tenure, and in-come. The same observable characteristics
TABLE 3
ESPP AND 401(K) PARTICIPATION AND AVERAGE CONTRIBUTION RATES BY DEMOGRAPHIC CHARACTERISTICS
Employee Stock Purchase Plan (ESPP)
401(k) Plan (Employees hired before
automatic enrollment) Sex Male Female Age <30 30–39 40–49 50–64 Race/Ethnicity White Black Hispanic Other/NA Tenure 1–2 years 2–3 years 4–5 years 6–7 years 8–10 years 10+ years Income <$20K $20–$29K $30–$39K $40–$49K $50–$59K $60–$69K $70–$79K ≥$80K 47.6% 34.8 24.3% 38.1 41.9 43.1 41.2% 24.7 25.8 27.7 29.5% 35.7 39.5 42.8 40.0 40.7 14.1% 24.9 35.3 46.8 55.8 59.5 63.2 72.0 2.63 1.47 1.02 1.69 1.93 2.19 1.91 0.83 1.16 1.28 1.35 1.65 1.88 2.03 1.83 1.78 0.61 0.91 1.40 2.06 2.66 3.07 3.44 4.65 5.54 4.22 4.23 4.45 4.60 5.08 4.62 3.38 4.49 4.61 4.58 4.61 4.75 4.75 4.57 4.37 4.35 3.68 3.90 4.41 4.78 5.17 5.44 6.47 72.0% 67.1 47.6% 68.5 73.4 78.5 72.7% 49.9 52.9 55.0 41.5% 56.3 65.9 74.9 77.2 81.7 39.0% 57.5 71.7 78.0 84.4 87.3 88.3 91.0 5.39 4.66 2.79 4.53 5.33 6.60 5.26 2.65 3.31 3.88 3.01 3.99 4.55 5.15 5.27 5.94 2.35 3.37 4.84 5.99 7.17 7.74 7.75 6.97 7.48 6.94 5.88 6.62 7.26 8.41 7.23 5.31 6.24 7.04 7.25 7.10 6.91 6.89 6.84 7.28 6.04 5.85 6.75 7.67 8.49 8.85 8.77 7.66 Source: Authors’ calculations. The sample is pooled cross–sectional data from the company studied and is restricted to individuals who are eligible for the ESPP, the 401(k) and have at least one year of tenure with the firm. The sample for the 401(k) plan is further restricted to employees who were hired before the company adopted automatic enrollment in 1998.
Participation rate (1) Contribution rate (2) Contribution rate given participation (3) Participation rate (4) Contribution rate (5) Contribution rate given participation (6)
that drive ESPP participation also appear to drive 401(k) participation.16
Because many of the factors associ-ated with ESPP participation are highly correlated with each other (for example, high–income employees are more likely to also be older, white, male, and high tenured employees), we next turn to esti-mating multivariate models to isolate the independent impact of these demographic characteristics on ESPP participation and contributions. The primary dependent variable, Dc, is a dummy that takes on
a value of one if the employee commits at the beginning of the offering period to contribute to the ESPP and purchase company stock at the end of the offering period, and zero otherwise. Let i index in-dividuals, s states, and t offering periods. Then the baseline specification is [8] Distc = α′X
ist + βDitauto + γs + θt + uist,
in which X is a vector of variables explain-ing the participation decision and includes a constant along with dummy variables for the categories of demographic and job characteristics shown in Table 3. The excluded categories are male, age 50 and over, white, job tenure of one to two years, and gross pay less than $20,000. We do not observe marital status in these
data. However, we have the employee’s health insurance election: employee–only coverage, employee plus one dependent (a spouse or child), employee plus two dependents (spouse and/or children), or coverage waived. Because individuals who elected employee–only coverage are predominantly single, we included a dummy for this health election category in the X vector as a rough control for marital status. We also included a dummy vari-able Dauto equal to one if the employee was
subject to automatic 401(k) enrollment and zero otherwise and a full set of state and offering period fixed effects, γ and θ, respectively.17
Column (1) of Table 4 shows the param-eter estimates from the linear probability model of ESPP participation. Robust stan-dard errors that account for the fact that there are multiple observations on individ-uals are reported in parentheses. Women have a statistically significant 0.91 percent-age point lower probability of participating in the ESPP. This is, however, substantially smaller in magnitude than the male–fe-male difference of 12.8 percentage points in the unconditional ESPP participation rates tabulated in Table 3. This indicates that the simple tabulations were driven almost completely by other characteristics that are correlated with being female.
16 One factor that affects 401(k) but not ESPP participation is taxes. A number of papers have estimated the
impact of marginal tax rates on participation in and contributions to tax–subsidized saving vehicles, includ-ing Venti and Wise (1988), Milligan (2002, 2003), Veall (2001), Engelhardt (1994, 1996), Engelhardt and Kumar (2003), and Cunningham and Engelhardt (2002). We estimated specifications similar to equation [8] below to examine the impact of taxes on ESPP participation. In particular, we estimated the effect of the spread between the marginal tax rate on ordinary and capital gains income on participation in and contribution to the ESPP. We calculated the combined federal–state marginal tax rate on ordinary income using the NBER’s TAXSIM calculator (Feenberg and Coutts, 1993). The offering periods from January 1997 to December 2001 spanned the capital gains tax changes in TRA97 and IRSRRA98, as well as the proposed changes in TRRA99 that were not enacted. We used these changes in the tax treatment of capital gains to identify the effect of taxes on ESPP participation. In none of the specifications did the marginal tax rate spread affect ESPP participation, and in many specifications the estimated parameter entered with the incorrect sign. In contrast, similar regressions for 401(k) participation as a function of the first–dollar marginal tax rate on 401(k) contributions showed strong evidence that participation and contributions rose with the marginal tax rate, which was expected given the deductibility of contributions. The results are available from the authors upon request.
17 We include time effects to account for differences over time in the attractiveness of ESPP participation. For
example, employees may be more wont to participate in the ESPP if the company stock (or stock in general) has been doing well in the recent past. We include state effects to account for differences across states in the attractiveness of ESPP participation. For example, holding other factors constant, employees in high cost–of–liv-ing states may face more bindcost–of–liv-ing liquidity constraints that make ESPP participation less attractive.
TABLE 4
BASELINE REGRESSIONS FOR ESPP PARTICIPATION AND CONTRIBUTION RATES Tobit Contribution Rate (4) Female Age < 30 Age 30–39 Age 40–49 Black Hispanic Other Race/NA
Employee–only Health Insurance Tenure 2–3 years Tenure 4–5 years Tenure 6–7 years Tenure 8–10 years Tenure 10+ years Earnings $20–$29K Earnings $30–$39K Earnings $40–$49K Earnings $50–$59K Earnings $60–$69K Earnings $70–$79K Earnings ≥$80K σ N R2 –0.0091 (0.0030) –0.0773 (0.0041) –0.0366 (0.0035) –0.0219 (0.0037) –0.0714 (0.0035) –0.0720 (0.0045) –0.0598 (0.0043) –0.0060 (0.0024) –0.0222 (0.0036) 0.0130 (0.0039) 0.0353 (0.0037) 0.0594 (0.0043) 0.0445 (0.0039) 0.1045 (0.0034) 0.1978 (0.0039) 0.2999 (0.0044) 0.3859 (0.0053) 0.4204 (0.0064) 0.4543 (0.0077) 0.5367 (0.0055) –– 163,044 0.1242 –0.0032 (0.0002) –0.0053 (0.0003) –0.0040 (0.0002) –0.0032 (0.0002) –0.0048 (0.0002) –0.0035 (0.0003) –0.0027 (0.0003) –0.0004 (0.0001) 0.0007 (0.0002) 0.0020 (0.0002) 0.0034 (0.0002) 0.0045 (0.0003) 0.0035 (0.0002) 0.0032 (0.0002) 0.0076 (0.0002) 0.0132 (0.0003) 0.0188 (0.0003) 0.0226 (0.0004) 0.0259 (0.0006) 0.0373 (0.0004) –– 163,044 0.1489 –0.0070 (0.0003) –0.0061 (0.0005) –0.0066 (0.0004) –0.0055 (0.0004) –0.0077 (0.0004) 0.0005 (0.0006) 0.0002 (0.0006) 0.0000 (0.0003) 0.0046 (0.0004) 0.0043 (0.0004) 0.0051 (0.0004) 0.0050 (0.0004) 0.0041 (0.0040) –0.0057 (0.0006) –0.0031 (0.0007) 0.0002 (0.0007) 0.0034 (0.0008) 0.0069 (0.0008) 0.0092 (0.0009) 0.0181 (0.0008) –– 61,332 0.1004 –0.0074 (0.0005) –0.0194 (0.0008) –0.0109 (0.0007) –0.0078 (0.0007) –0.0182 (0.0007) –0.0144 (0.0010) –0.0111 (0.0009) –0.0012 (0.0005) 0.0011 (0.0007) 0.0053 (0.0007) 0.0097 (0.0007) 0.0135 (0.0008) 0.0105 (0.0007) 0.0236 (0.0010) 0.0418 (0.0010) 0.0589 (0.0011) 0.0730 (0.0012) 0.0807 (0.0013) 0.0873 (0.0015) 0.1092 (0.0013) .0264 (.0003) 163,044 ––
Source: Authors’ calculations. The sample is pooled cross–sectional data from the company studied and is restricted to individuals who are eligible for the ESPP, the 401(k) and have at least one year of tenure with the firm. Robust standard errors in parentheses. All specifications include a constant, the dummy for automatic 401(k) enrollment, and a full set of state and offering period fixed effects (not reported).
Independent Variables OLS Participation (1) OLS Contribution Rate (2) OLS Contribution Rate Given Participation (3)
Once these other factors are controlled for, women are only slightly less likely to participate than men. For similar reasons, the black–white difference of 16.5 percentage points in Table 3 falls to a statistically significant 7.1 percentage points upon controlling for other observ-able employee characteristics. The other major differences between the simple tabulations and the regression results for participation is that upon controlling for other factors, the impact of age and tenure is U–shaped, rather than monotonically increasing.
Columns (2)–(4) of Table 4 report results from the estimation of the same specifi-cation as in [8], but with the dependent variable measuring the contribution rate,
[9] cist = α′Xist + βDitauto + γ
s + θt + uist,
in which c is constrained by the plan to be an integer percentage of gross pay from 0 to 10 percent. Column (2) shows ordinary least squares (OLS) estimates of the pa-rameters in [9] for all sample individuals, whereas column (3) shows OLS estimates only for the sub–sample with positive contributions. Column (4) shows estimates based on a two–limit Tobit model that rec-ognizes the minimum and maximum con-tribution rates of 0 and 10 percent explicitly. The results in columns (2)–(4) indicate that the demographic and job characteristics drive contributions in a similar manner as participation in column (1).
Explanations for Non–Participation With participation far below 100 percent and the contribution rate much less than the plan limit, it is obvious that employ-ees’ behavior is not described well by the perfect capital markets, perfect knowledge, and no transactions costs model. We focus on four explanations for this puzzle: liquid-ity constraints, imperfect plan information, asset choice, and transactions costs.
Liquidity Constraints
First, it may be that non–participants are liquidity constrained. Low income and minority status are correlated with low participation and contributions in Tables 3 and 4. These factors have been as-sociated closely with liquidity constraints in the previous literature, including Japelli (1990), Cox (1990), Hurst and Charles (2002), Ladd (1998), and Yinger (1998), among many others, and might suggest that liquidity constraints are an important reason for less than full par-ticipation.
Although there is no way to assess this definitively in these data, because there are no clearly delineated measures of liquidity constraints, there are three reasons why such constraints probably are not the most important factor. First, 62 percent of ESPP non–participants contributed to the company 401(k) plan. This alone suggests that these individu-als are not liquidity constrained. In fact, a fully informed employee would real-ize that the compensation–maximizing strategy would be to contribute the limit in the ESPP, engage in a same–day sale, and use the proceeds to fund the 401(k) contribution and capture the employer match. But employees do not appear to do this. Indeed, only 10 percent of 401(k) contributors are limit contributors to the ESPP, and this may simply indicate a strong taste for saving rather than a pure arbitrage. Second, the company adopted automatic 401(k) enrollment partway through the sample, which defaulted many non–401(k) participants into con-tributing 3 percent of gross pay annually to the 401(k). If employees were liquidity constrained, automatic enrollment in the 401(k) should have reduced participation in the ESPP by making the constraint more binding. However, as Madrian and Shea (2001) estimated and documented, auto-matic 401(k) enrollment had no impact on ESPP participation. Third, recall that the worst an employee could do on a
annual-ized return basis for a riskless same–day sale of shares purchased through the ESPP is just over 38 percent. This is far above the annual interest rate on credit card debt, sometimes thought of as the marginal source of borrowing for many households. Finally, the findings that low income and minority status are associated with lower participation are not unique to liquid-ity constraints. Indeed, these employee characteristics could be correlated with employee plan knowledge and financial sophistication.
Imperfect Knowledge of the Plan
A second explanation for non–participa-tion is imperfect knowledge of the plan. The employee simply may not understand well enough the plan features and tax treatment of the various types of dispositions to make an informed decision on participation. The tax discussion and equations [1]–[7] above are actually fairly complicated and were based on our reading of Section 423 of the IRC and related IRS tax regulations. In fact, our reading of the plan design and admin-istration literature indicated that there was substantial confusion among so–called experts on the corporate tax treatment of ESPPs. So, it does not seem surprising that employees might not understand these plans very well. We also note that partici-pation was higher in the 401(k) plan which is less complicated and likely much better understood by the typical employee. In this regard, during our sample the company offered financial planning seminars to employees. We obtained the PowerPoint presentation from these seminars, and only one slide out of thirty was devoted to the ESPP plan, and it came at the end of the presentation. The bulk of the seminar focused on the 401(k) plan.
Another reason why employees might not participate is that the firm may not ad-vertise the availability of same–day sales if the objective is to encourage long–term
share ownership. This is similar to why employers often do not advertise the availability of pre–retirement borrowing against and hardship withdrawals of 401(k) balances.
Asset Choice
Another potential explanation is that employees do not view the ESPP as a way to increase compensation, but rather, as a way to incorporate company stock into the savings portfolio. Because company stock was not an investment option in the 401(k) plan, the easiest way for most employees to acquire their preferred holdings of company stock is through the ESPP. To see whether this explanation is valid, we exam-ine the relationship between the receipt of employer stock options and participation in the ESPP. If participation in the ESPP is driven by a lack of access to employer stock elsewhere, we would expect participation in the ESPP to decline with the receipt of employer stock options.
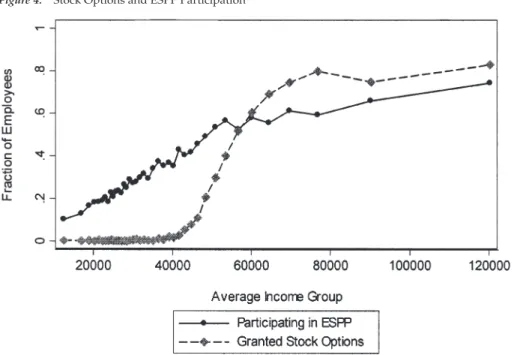
Figure 4 shows the relationship between income and both the fraction of employees participating in the ESPP and the fraction of employees (primarily managerial) who have received stock options.18 Note that the receipt of stock options is strongly correlated with income—virtually no em-ployees with incomes of less than $40,000 have been granted stock options. But the relationship between income and the fraction of employees participating in the ESPP does not appear to change around $40,000 in income when the fraction of employees receiving stock options starts to increase rather markedly. The patterns are similar if one considers the number of options received by employees and not just a binary indicator for whether or not options have been received. Overall, we find little support for the notion that the ESPP is used by employees as a way to purchase company stock if access to com-pany stock is not available elsewhere.
Transactions Costs
Following the work of Madrian and Shea (2001) on 401(k) participation at this company, we think that a likely explana-tion for the lack of universal participaexplana-tion in the ESPP is procrastination—many employees delay in signing up for the plan. This procrastination could be due to transactions costs—either the direct costs of enrollment, or, more likely, to the indi-rect costs of learning about the plan (and, in particular, why the plan is such a good deal). Alternatively, this procrastination could arise from the type of self–defeat-ing behavior generated by present–biased preferences (O’Donoghue and Rabin, 1999a and 1999b; Diamond and Koszegi, 2003; Laibson, Repetto and Tobacman, 1998).
CONCLUSION
Most employee stock purchase plans are designed to promote employee stock ownership broadly in the firm and pro-vide another tax–deferred vehicle for
capital accumulation in addition to tradi-tional pensions and 401(k)s. There are two principal findings from our analysis. First, compensation through a tax–qualified ESPP, the dominant type offered, appears to be less advantageous from a pure tax perspective than through a non–qualified ESPP or cash, unless corporate tax rates are substantially below the top statutory rate and there is substantial share price appreciation. Given that tax–qualified ESPPs are the dominant type, this sug-gests that non–tax considerations play a significant role in the decision to provide these plans. Second, for most plans, ESPP participation is essentially a risk–free way to increase gross compensation for the employee, yet participation is only about 40 percent in the company we analyze, which is quite puzzling and suggests that a substantial fraction of employees are liquidity constrained, do not fully understand these plans, or face non–trivial transactions costs. Clear areas for future research are estimating the impact of taxes
on provision of ESPPs in a random sample of employers, the impact of capital gains tax changes on the timing of ESPP stock dispositions, which would require much more detailed data tracking different vin-tages of purchases and sales of company stock, both before and after TRA97 and IRSRRA98, and empirically examining and testing alternative explanations for non–participation.
Acknowledgments
We would like to thank Rosanne Altshuler, Christopher Cunningham, James Poterba, Roger Gordon, and two anonymous referees for useful comments, and Daniel Feenberg for assistance with TAXSIM. All errors are our own.
REFERENCES
Cox, Donald.
“Intergenerational Transfers and Liquidity Constraints.” Quarterly Journal of Economics
105 No. 1 (February, 1990): 187–217. Cunningham, Christopher R., and Gary V. Engelhardt.
“Federal Tax Policy, Employer Matching, and 401(k) Saving: Evidence from HRS W–2 Records.” National Tax Journal 55 No. 3 (September, 2002): 617–45.
Diamond, Peter, and Botond Koszegi. “Quasi–Hyperbolic Discounting and
Retire-ment.” Journal of Public Economics 87 Nos. 9–10 (September, 2003): 1839–72.
Engelhardt, Gary V.
“Tax Subsidies to Saving for Home Purchase: Evidence from Canadian RHOSPs.” National
Tax Journal 47 No. 2 (June, 1994): 363–88.
Engelhardt, Gary V.
“Tax Subsidies and Household Saving: Evidence from Canada.” Quarterly Journal
of Economics 111 No. 4 (November, 1996):
1237–68.
Engelhardt, Gary V., and Anil Kumar. “Employer Matching and 401(k) Saving:
Evidence from the Health and Retirement Study.” Syracuse University. Mimeo, 2003.
Feenberg, Daniel, and Elisabeth Coutts. “An Introduction to the TAXSIM Model.”
Journal of Policy Analysis and Management 12
No. 1 (Winter, 1993): 189–94. Hall, Brian J., and Jeffrey B. Liebman. “The Taxation of Executive Compensation.”
In Tax Policy and the Economy, Volume 14,
ed-ited by James M. Poterba, 1–44. Cambridge, MA: MIT Press, 2000.
Hallman III, G. Victor, and Jerry S. Rosenbloom.
“Employee Stock Compensation Plans.” In
The Handbook of Employee Benefits, Fifth Edi-tion, edited by Jerry S. Rosenbloom, 741–58. New York: McGraw–Hill, 2001.
Hewitt Associates.
Survey Findings: Employee Stock Purchase
Plans. Lincolnshire, IL: Hewitt Associates,
1998.
Hurst, Erik, and Kerwin Charles.
“The Transition to Home Ownership and the Black/White Wealth Gap.” Review
of Economics and Statistics 84 No. 2 (May,
2002): 281–97. Jappelli, Tullio.
“Who is Credit Constrained in the U.S. Economy?” Quarterly Journal of Economics
105 No. 1 (February, 1990): 98–113. Ladd, Helen F.
“Evidence on Discrimination in Mortgage Lending.” Journal of Economic Perspectives
12 No. 2 (Spring, 1998): 41–62. Laibson, David I., Andrea Repetto, and Jeremy Tobacman.
“Self–Control and Saving for Retirement.”
Brookings Papers on Economic Activity
(1998:1): 91–196.
Liang, Nellie, and Scott Weisbenner. “Investor Behavior and the Purchase
of Company Stock in 401(k) Plans— The Importance of Plan Design.” NBER Working Paper No. 9131. Cambridge, MA: National Bureau of Economic Research, 2002.
Madrian, Brigitte C., and Dennis F. Shea. “The Power of Suggestion: Inertia in 401(k)
Participation and Savings Behavior.”
Quar-terly Journal of Economics 116 No. 4
Meulbrook, Lisa.
“Company Stock in Pension Plans: How Costly Is It?” Harvard Business School. Mimeo, 2002.
Milligan, Kevin.
“Tax–Preferred Savings Accounts and Mar-ginal Tax Rates: Evidence on RRSP Participa-tion.” Canadian Journal of Economics 35 No. 3 (August, 2002): 436–56.
Milligan, Kevin.
“How Do Contribution Limits Affect Contributions to Tax–Preferred Savings Accounts?” Journal of Public Economics 87 No. 2 (February, 2003): 253–81.
Mitchell, Olivia S., and Stephen P. Utkus. “The Role of Company Stock in Defined
Contribution Plans.” NBER Working Paper No. 9250. Cambridge, MA: National Bureau of Economic Research, 2002.
Murphy, Kevin J.
“Executive Compensation.” In Handbook
of Labor Economics, Vol. 3, edited by Orley
Ashenfelter and David Card, 2485–563. Amsterdam: North Holland, 1999. National Center for Employee Ownership.
Employee Stock Purchase Plans. Oakland,
CA: National Center for Employee Owner-ship, 2001a.
National Center for Employee Ownership.
Current Practices in Stock Option Plan Design,
Second Edition. Oakland, CA: National
Cen-ter for Employee Ownership, 2001b.
O’Donoghue, Ted, and Matthew Rabin. “Incentives for Procrastinators.”
Quar-terly Journal of Economics 114 No.3 (August,
1999a): 769–816.
O’Donoghue, Ted, and Matthew Rabin. “Doing It Now or Later.” American Economic
Review 89 No.1 (March, 1999b): 103–24.
Poterba, James M.
“Employer Stock and 401(k) Plans.” Ameri-can Economic Review Papers and Proceedings
93 No. 2 (May, 2003): 398–404.
Scholes, Myron S., Mark A. Wolfson, Merle Erickson, Edward L. Maydew, and Terry Shevlin.
Taxes and Business Strategy: A Planning
Ap-proach, Second Edition. Upper Saddle River,
NJ: Prentice Hall, 2002. Veall, Michael R.
“Did Tax Flattening Affect RRSP Contribu-tions?” Canadian Journal of Economics 34 No. 1 (February, 2001): 120–31.
Venti, Steven F., and David A. Wise.
“The Determinants of IRA Contributions and the Effect of Limit Changes.” In Pen-sions in the U.S. Economy, edited by Zvi Bodie, John B. Shoven, and David A. Wise, 9–47. Chicago, IL: University of Chicago Press, 1988.
Yinger, John.
“Evidence on Discrimination in Consumer Markets.” Journal of Economic Perspectives 12 No. 2 (Spring, 1998): 23–40.