Methods for accident investigation
R
O
S
S
Reliability, Safety, and Security Studies at NTNU
Dept. of Production and Quality Engineering Visiting address: Telephone: Facsimile: S.P. Andersens vei 5 +47 73 59 38 00 +47 73 59 71 17 TITLE
Methods for accident investigation
AUTHOR
Snorre Sklet
SUMMARY
This report gives an overview of some important, recognized, and commonly used methods for investigation of major accidents. Investigation of major accidents usually caused by multiple, interrelated causal factors should be performed by a multi-disciplinary investigation team, and supported by suitable, formal methods for accident investigation. Each of the methods has different areas of application and a set of methods ought to be used in a comprehensive accident investigation. The methods dealt with are limited to methods used for in-depth analysis of major accidents.
ARCHIVE KEY 1958.2002 REPORT NO. ROSS (NTNU) 200208 ISBN 82-7706-181-1 DATE 2002-11-10 SIGNATURE Marvin Rausand PAGES/APPEND. 75 KEYWORD NORSK SIKKERHET ULYKKE ULYKKESGRANSKING KEYWORD ENGLISH SAFETY ACCIDENT ACCIDENT INVESTIGATION
Summary
This report gives an overview of some important, recognized, and commonly used methods for investigation of major accidents. The methods dealt with are limited to methods used for in-depth analysis of major accidents.
The objective of accident investigation, as seen from a safety engineer’s point of view are to identify and describe the true course of events (what, where, when), identify the direct and root causes or contributing factors to the accident (why), and to identify risk reducing measures in order to prevent future accidents (learning).
Investigation of major accidents usually caused by multiple, interrelated causal factors should be performed by a multi-disciplinary investigation team, and supported by suitable, formal methods for accident investigation. A number of methods are described in this report. Each of the methods has different areas of application and a set of methods ought to be used in a comprehensive accident investigation. A comprehensive accident investigation should analyse the influence of all relevant actors on the accident sequence. Relevant actors might span from technical systems and front-line personnel via managers to regulators and the Government.
Contents
SUMMARY... 1
CONTENTS ... 3
1 INTRODUCTION ... 5
1.1 INTRODUCTION TO ACCIDENT INVESTIGATION AND DELIMITATIONS OF THE REPORT... 5
1.2 GLOSSARY / DEFINITIONS AND ABBREVIATIONS... 8
1.2.1 Definitions and terms used in accident investigation ... 8
1.2.2 Abbreviations... 11
2 WHAT IS ACCIDENT INVESTIGATION ABOUT?... 13
2.1 PRECONDITIONS FOR ACCIDENT INVESTIGATION... 13
2.2 AN USEFUL FRAMEWORK FOR ACCIDENT INVESTIGATION... 13
2.3 THE PURPOSE OF ACCIDENT INVESTIGATION... 15
2.4 RESPONSIBILITY FOR ACCIDENT INVESTIGATION... 15
2.5 CRITERIA FOR ACCIDENT INVESTIGATIONS... 16
3 THE ACCIDENT INVESTIGATION PROCESS ... 19
3.1 COLLECTING EVIDENCE AND FACTS... 20
3.2 ANALYSIS OF EVIDENCE AND FACTS... 21
3.3 RECOMMENDATIONS AND REPORTING... 24
4 METHODS FOR ACCIDENT INVESTIGATIONS ... 25
4.1 DOE’S CORE ANALYTICAL TECHNIQUES... 27
4.1.1 Events and causal factors charting (ECFC)... 27
4.1.2 Barrier analysis ... 30
4.1.3 Change analysis... 32
4.1.4 Events and causal factors analysis ... 35
4.1.5 Root cause analysis ... 36
4.2 OTHER ACCIDENT INVESTIGATION METHODS... 37
4.2.1 Fault tree analysis ... 37
4.2.2 Event tree analysis... 39
4.2.3 MORT ... 40
4.2.4 Systematic Cause Analysis Technique (SCAT) ... 42
4.2.5 STEP (Sequential timed events plotting) ... 45
4.2.6 MTO-analysis ... 50
4.2.7 Accident Analysis and Barrier Function (AEB) Method ... 53
4.2.8 TRIPOD ... 56
5 DISCUSSION AND CONCLUSION ... 67
5.1 DISCUSSION... 67
5.2 CONCLUSION... 71
1 Introduction
1.1 Introduction to accident investigation and
delimitations of the report
The accident investigation process consists of a wide range of activities, and is described somewhat different by different authors. DOE (1999) divide the investigation process into three phases; collection of evidence and facts, analysis of these facts, and development of conclusions and development of judgments of need and writing the report, see Figure 1. These are all overlapping phases and the whole process is iterative. Some authors also include the implementation and follow-up of recommendations in the investigation phase (e.g., Kjellén, 2000).
Figure 1. Three phases in an accident investigation.
In this report it is focused on the analysis of data and especially on methods applicable to this work. The focus on the data analysis, do not means that the other phases are not as important, but is a way of limiting the scope of the report.
According to Kjellén (2000), certain priorities have to be made in order to focus on the accidents and near accidents that offer the most significant opportunities for learning. He recommends the following approach (see Figure 2)1:
1
This approach is not limited to major accidents, but also include occupational accidents.
Collection of
evidence and facts Analysis of evidence and facts; Development of
conclusions
Development of judgments of need;
1. All reported incidents (accidents and near accidents) are investigated immediately at the first level by the supervisor and safety representative.
2. A selection of serious incidents, i.e. frequently recurring types of incidents and incidents with high loss potential (actual or possible) are subsequently investigated by a problem-solving group.
3. On rare occasions, when the actual or potential loss is high, an accident investigation commission carries out the investigation. This commission has an independent status in relation to the organisations that are responsible for the occurrence.
Figure 2. Accident investigation at three levels (Kjellén, 2000).
This last category will also include events that Reason calls organisational accidents (Reason, 1997). Organisational accidents are the comparatively rare, but often catastrophic, events that occur within complex, modern technologies such as nuclear power plants, commercial aviation, petrochemical industry, etc. Organisational accidents have multiple causes involving many people operating at
Independant investigation commission Work place Problem-solving group Immediate investigation by first-line supervisor Reporting Implementation of remedial actions Accidents Near accidents All events All events In exceptional cases Frequent or severe events
are according to Reason (1997) a product of technological innovations that have radically altered the relationship between systems and their human elements.
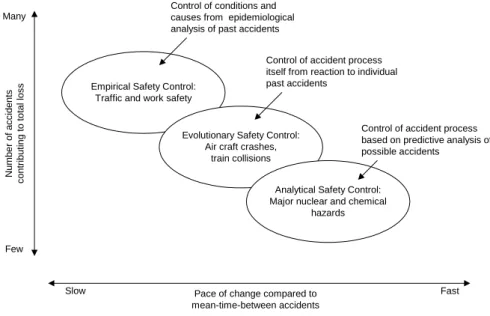
Rasmussen (1997) proposes different risk management strategies for different kinds of accidents, see Figure 3. The accident investigation methods dealt with in this report are limited to methods used for evolutionary safety control, i.e. in-depth analysis of major accidents (ref. Kjelléns third point and Reasons organisational accidents). Methods used for empirical safety control (e.g., statistical data analysis) and analytical safety control (probabilistic risk analysis) are not treated separately in this report, even though some of the methods may also be used in probabilistic risk analysis.
Figure 3. Rasmussen’s risk management strategies.
The various accident investigations methods are usually based on different models for accident causation2, in which help to establish a
2
A study by Andersson & Menckel (1995) identified eleven conceptually different models. The general trend they found is that most “primitive” models focus on one accident, one factor or one individual, while the more recent models refer to more complex disorders, multifactorial relationships, many or all persons in a society, and the environment as whole. Interest and focus have an ever increasing time-span, and concentrate increasingly on the “before the
Empirical Safety Control: Traffic and work safety
Evolutionary Safety Control: Air craft crashes,
train collisions
Analytical Safety Control: Major nuclear and chemical
hazards Control of conditions and
causes from epidemiological analysis of past accidents
Control of accident process itself from reaction to individual past accidents
Control of accident process based on predictive analysis of possible accidents
Pace of change compared to mean-time-between accidents Fast Slow Many Numbe r of ac c ident s c ontr ibut ing to to tal los s Few
shared understanding of how and why accidents happen. A detailed description of the different accident models will not be given in this report, only a listing of the main “classes” of accident models. For those interested in more details about accident models, Kjellén’s description of these models in his book (Kjellén, 2000) is recommended as a starting point.
The main classes of accident models are (based on Kjellén, 2000): 1. Causal-sequence models
2. Process models 3. Energy model 4. Logical tree models
5. Human information-processing models 6. SHE management models
To summarise the purpose and delimitations, this report will focus on methods for analysis of major accidents usually caused by multi-factorial system failures.
1.2 Glossary / definitions and abbreviations
1.2.1 Definitions and terms used in accident
investigation
Within the field of accident investigation, there is no common agreement of definitions of concepts. Especially the notion of cause has been discussed. While some investigators focus on causal factors (e.g., DOE, 1997), others focus on determining factors (e.g., Kjellén and Larsson, 1981), contributing factors (e.g., Hopkins, 2000), active failures and latent conditions (e.g., Reason, 1997) or safety problems (Hendrick & Benner, 1987).
Hopkins (2000) defines cause in the following way: “one thing is said to be a cause of another if we can say but for the first the second would not have occurred”. Leplat (1997) expresses this in a more formal way by saying that in general, the following type of definition of cause is accepted: “to say that event X is the cause of event Y is to say that the
occurrence of X is a necessary condition to the production of Y, in the circumstances considered”. Such a definition implies that if any one of the causal pathways identified are removed, the outcome would probably not have occurred. Using the term contributing factor may be less formal, if an event has not occurred, this would necessarily not prevented the occurrence of the accident. Kletz (2001) recommends avoiding the word cause in accident investigations and rather talk about what might have prevented the accident.
Accident investigators may use different frames for their analysis of accidents, but nevertheless the conclusions about what happened, why did it happen and what may be done in order to prevent future accidents may be the same.
Some definitions are included in this chapter. These definitions are meant as an introduction to the terms. Several of the terms are defined in different ways by different authors. The definitions are quoted without any comments or discussions in this report in order to show some of the specter. Therefore, these definitions represent the authors’ opinions.
Accident A sequence of logically and chronologically related deviating events involving an incident that results in injury to personnel or damage to the environment or material assets. (Kjellén, 2000)
An unwanted transfer of energy or an environmental condition that, due to the absence or failure of barriers and controls, produces injury to persons, damage to property, or reduction in process output. (DOE, 1997)
Barrier Anything used to control, prevent, or impede energy flows. Common types of barriers include equipment, administrative procedures and processes, supervision/management, warning devices, knowledge and skills, and physical. Barriers may be either control or safety. (DOE, 1997)
Barrier analysis An analytical technique used to identify the energy sources and the failed or deficient barriers and controls that contributed to an accident. (DOE, 1997)
Causal factor An event or condition in the accident sequence necessary and sufficient to produce or contribute to the unwanted result. Causal factors fall into three categories; direct cause, contributing cause and root cause. (DOE, 1997)
Cause of accident Contributing factor or root cause. (Kjellén, 2000) Contributing cause An event or condition that collectively with
other causes increases the likelihood of an accident but which individually did not cause the accident. (DOE, 1997)
Contributing factor More lasting risk-increasing condition at the workplace related to design, organisation or social system. (Kjellén, 2000)
Controls Those barriers used to control wanted energy flows, such as the insulation on an electrical cord, a stop sign, a procedure, or a safe work permit. (DOE, 1997)
Direct cause The immediate events or conditions that caused the accident. (DOE, 1997)
Event An occurrence; something significant and real-time that happens. An accident involves a sequence of events occurring in the course of work activity and culminating in unintentional injury or damage. (DOE, 1997)
Events and causal factor chart Graphical depiction of a logical series of events and related conditions that precede the accident. (DOE, 1997)
Root cause An underlying system-related prime (the most basic) reason why an incident occurred (CCPS, 1992)
The causal factor(s) that, if corrected, would prevent recurrence of the accident. (DOE, 1997)
Most basic cause of an accident/incident, i.e. a lack of adequate management control resulting in deviations and contributing factors. (Kjellén, 2000) Root cause analysis Any methodology that identifies the causal
factors that, if corrected, would prevent recurrence of the accident. (DOE, 1997)
1.2.2 Abbreviations
AEB-analysis Accident evolution and barrier analysis BRF Basic Risk Factors
CCPS Center for Chemical Process Safety DOE U.S. Department of Energy
MORT Management and Organisational Review Technique MTO Menneske, teknologi og organisasjon
PSF Performing Shaping Factor
SCAT Systematic Cause Analysis Technique STEP Sequential Timed Events Plotting
2
What is accident investigation
about?
2.1 Preconditions for accident investigation
This chapter starts with some preconditions for accident investigation that every accident investigator should bear in mind at work:
• Major accidents are unplanned and unintentional events that result in harm or loss to personnel, property, production, the environment or anything that has some value.
• Barriers (physical and management) should exist to prevent accidents or mitigate their consequences. Major accidents occur when one or more barriers in a work system fail, to fulfill its functions, or do not exist.
• Major accidents almost never result from a single cause; most accidents involve multiple, interrelated causal factors.
• Major accidents are usually the result of management system failures, often influenced by environmental factors or the public safety framework (e.g., set by contracts, the market, the regulators or the Government)
• Accident investigators should remain neutral and independent and present the results from the investigations in an unbiased way3.
2.2 An useful framework for accident
investigation
According to Rasmussen (1997), accidents are caused by loss of control of physical processes that are able to injure people, and/or damage the environment or property. The propagation of an accidental course of events is shaped by the activity of people, which can either trigger an accidental flow of events or divert a normal flow.
3
Hopkins (2000) identified three distinct principles of causal selection being in operation at the Commission after the Longford-accident:
1.Self-interest, select causes consistent with self-interest 2.Accident prevention, select causes which are most controllable 3.The legal perspective, select causes which generate legal liability
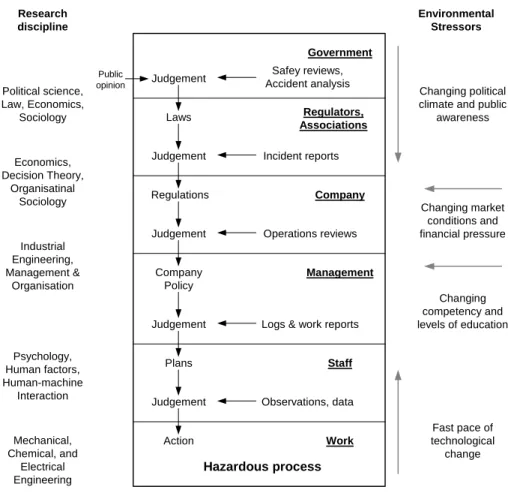
Many levels of politicians, managers, safety officers, and work planners are involved in the control of safety by means of laws, rules, and instructions that are established to control some hazardous, physical process. The socio-technical system actually involved in the control of safety is shown in Figure 4.
Figure 4. The socio-technical system involved in risk management (Rasmussen, 1997).
This framework is chosen as a view on investigation of major accidents and will be discussed further in the discussion in chapter 5.
Judgement Judgement Judgement Judgement Judgement Laws Regulations Company Policy Plans Action Government Regulators, Associations Company Management Staff Work Safey reviews, Accident analysis Incident reports Operations reviews
Logs & work reports
Observations, data Hazardous process Political science, Law, Economics, Sociology Economics, Decision Theory, Organisatinal Sociology Industrial Engineering, Management & Organisation Mechanical, Chemical, and Electrical Engineering Psychology, Human factors, Human-machine Interaction Public opinion Research discipline Environmental Stressors Changing political climate and public
awareness Changing market conditions and financial pressure Changing competency and levels of education Fast pace of technological change
2.3 The purpose of accident investigation
An accident investigation may have different purposes:
• Identify and describe the true course of events (what, where, when)
• Identify the direct and root causes / contributing factors of the accident (why)
• Identify risk reducing measures to prevent future, comparable accidents (learning)
• Investigate and evaluate the basis for potential criminal prosecution (blame)
• Evaluate the question of guilt in order to assess the liability for compensation (pay)
As we see, there may be different purposes in which initiate accident investigations. The different purposes will not be discussed anymore in this report.
2.4 Responsibility for accident investigation
Who should be responsible for performing accident investigations and how thoroughly should the accident be investigated?
The history of accident investigation in the past decades shows a trend to go further and further back in the analysis, i.e., from being satisfied with identifying human errors by front-personnel or technical failures to identify weaknesses in the governmental policies as root causes. In order to know when we should stop our investigation, we need what Rasmussen (1990) called stop-rules. Reason (1997) suggests that we should stop when the causes identified are no longer controllable. The stopping rule suggested by Reason (1997), leads to different stopping points for different parties. Companies should trace causes back to failures in their own management systems and develop risk-reducing measures that they have authority to implement.
Supervisory authorities (e.g., The Norwegian Petroleum Directorate), appointed governmental commissions of inquiries (e.g., the Sleipner-commission, and the Åsta-commission) or permanent investigation boards (e.g., The Norwegian Aircraft Accident Investigation Board)
should in addition focus on regulatory systems and ask whether weaknesses in these systems contributed to the accident.
The police and the prosecuting authority are responsible for evaluating the basis for potential criminal prosecution, while the court of justice is responsible for passing sentence on a person or a company.
The liability for compensation is within the insurance companies’ and the lawyer’s range of responsibility.
2.5 Criteria for accident investigations
What is a “good” accident investigation? This question is difficult to answer in a simple way, because the answer depends on the purpose of the investigation. Nevertheless, I have included ten fundamental criteria for accident investigations stated by Hendrick & Benner (1987). Three criteria are related to objectives and purposes of the accident investigation, four to investigative procedures, and three to the outputs from the investigation and its usefulness.
Criteria related to objectives and purposes
• Realistic
The investigation should result in a realistic description of the events that have actually occurred.
• Non-causal
An investigation should be conducted in a non-causal framework and result in an objective description of the accident process events. Attribution of cause or fault can only be considered separate from, and after the understanding of the accident process is completed to satisfy this criterion.
• Consistent
The investigation performance from accident to accident and among investigations of a single accident to different investigators should be consistent. Only consistency between results of different investigations enables comparison between them.
Criteria related to investigation procedures
• Disciplining
An investigation process should provide an orderly, systematic framework and set of procedures to discipline the investigators’ tasks in order to focus their efforts on important and necessary tasks and avoid duplicative or irrelevant tasks.
• Functional
An investigation process should be functional in order to make the job efficient, e.g. by helping the investigator to determine which events were part of the accident process as well as those events that were unrelated.
• Definitive
An investigation process should provide criteria to identify and define the data that is needed to describe what happened.
• Comprehensive
An investigation process should be comprehensive so there is no confusion about what happened, no unsuspected gaps or holes in the explanation, and no conflict of understanding among those who read the report.
Criteria related to output and usefulness
• Direct
The investigation process should provide results that do not require collection of more data before the needed controls can be identified and changes made.
• Understandable
The output should be readily understandable.
• Satisfying
The results should be satisfying for those who initialised the investigation and other individuals that demand results from the investigations.
Some of these criteria are debatable. For instance will the second criterion related to causality be disputable. Investigators using the causal-sequence accident model will in principle focus on causes during their investigation process. Also the last criterion related to satisfaction might be discussed. Imagine an investigation initialised by the top management in a company. If the top management is criticised
in the accident report, they are not necessarily satisfied with the results, but nevertheless it may be a “good” investigation.
3 The accident investigation process
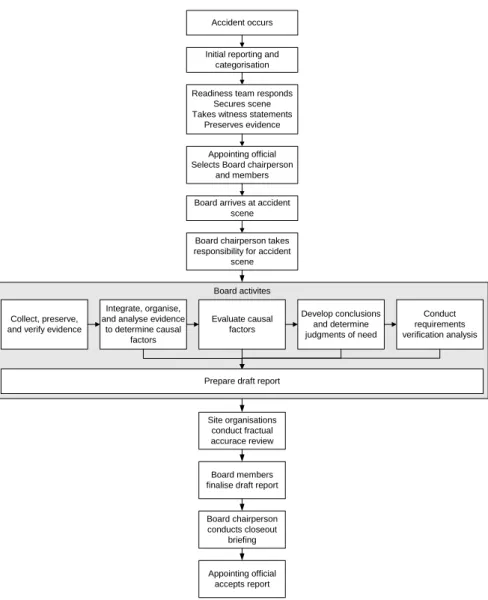
Figure 5 shows the detailed accident investigation process as described by DOE (1999). As shown in the figure, the process starts immediately when an accident occurs, and the work is not finished before the final report is accepted by the appointing official. This report focuses on the process of analysing evidence to determine and evaluate causal factors (see chapter 4), but first a few comments to the other main phases.Figure 5. DOE’s process for accident investigation (DOE, 1999). Board activites Accident occurs Develop conclusions and determine judgments of need Evaluate causal factors Integrate, organise,
and analyse evidence to determine causal
factors Collect, preserve,
and verify evidence
Board chairperson takes responsibility for accident
scene Board arrives at accident
scene Appointing official Selects Board chairperson
and members Readiness team responds
Secures scene Takes witness statements
Preserves evidence Initial reporting and categorisation
Conduct requirements verification analysis
Prepare draft report
Board members finalise draft report
Appointing official accepts report Site organisations conduct fractual accurace review Board chairperson conducts closeout briefing
3.1 Collecting evidence and facts
Collecting data is a critical part of the investigation. Three key types of evidence are collected during the investigation process:
• Human or testamentary evidence
Human or testamentary evidence includes witness statements and observations.
• Physical evidence
Physical evidence is matter related to the accident (e.g. equipment, parts, debris, hardware, and other physical items).
• Documentary evidence
Documentary evidence includes paper and electronic information, such as records, reports, procedures, and documentation.
The major steps in gathering evidence are collecting human, physical and documentary evidence, examining organisational concerns, management systems, and line management oversight and at last preserving and controlling the collected evidence.
Collecting evidence can be a lengthy, time-consuming, and piecemeal process. Witnesses may provide sketchy or conflicting accounts of the accident. Physical evidence may be badly damaged or completely destroyed, Documentary evidence may be minimal or difficult to access. Thorough investigation requires that board members are diligent in pursuing evidence and adequately explore leads, lines of inquiry, and potential causal factors until they gain a sufficiently complete understanding of the accident.
This topic will not be discussed anymore in this report, but for those interested in the topic are the following references useful; DOE (1999), CCPS (1992) and Ingstad (1988).
3.2 Analysis of evidence and facts
Analysis of evidence and facts is the process of determining causal factors, identify latent conditions or contributing factors (or whatever you want to call it) and seeks to answer the following two questions:
• What happened where and when?
• Why did it happen?
DOE (1999) describes three types of causal factors: 1. Direct cause
2. Contributing causes 3. Root causes
A direct cause is an immediate event or condition that caused the accident (DOE, 1997). A contributing cause is an event or condition that together with other causes increase the likelihood of an accident but which individually did not cause the accident (DOE, 1997). A root cause is the causal factor(s) that, if corrected, would prevent recurrence of the accident (DOE, 1997).
There are different opinions of the concept of causality of accidents, see comments in section 1.2.1, but this topic will not be discussed any further here.
CCPS (1992) lists three analytical approaches by which conclusions can be reached about an accident:
• Deductive approach
• Inductive approach.
• Morphological approach
In addition, there exists different concepts for accident investigation not as comprehensive as these system-oriented techniques. These are categorized as non-system-oriented techniques.
The deductive approach involves reasoning from the general to the specific. In the deductive analysis, it is postulated that a system or process has failed in a certain way. Next an attempt is made to determine what modes of system, component, operator and organisation behaviour contribute to the failure. The whole accident
investigation process is a typical example of a deductive reasoning. Fault tree analysis is also an example of a deductive technique.
The inductive approach involves reasoning from individual cases to a general conclusion. An inductive analysis is performed by postulating that a particular fault or initiating event has occurred. It is then determined what the effects of the fault or initiating event are on the system operation. Compared with the deductive approach, the inductive approach is an “overview” method. As such it bring an overall structure to the investigative process. To probe the details of the causal factors, control and barrier function, it is often necessary to apply deductive analysis. Examples of inductive techniques are failure mode and effects analysis (FMECA), HAZOP’s and event tree analysis.
The morphological approach to analytical incident investigation is based on the structure of the system being studied. The morphological approach focuses directly on potentially hazardous elements (for example operation, situations). The aim is to concentrate on the factors having the most significant influence on safety. When performing a morphological analysis, the analyst is primarily applying his or her past experience of incident investigation. Rather than looking at all possible deviations with and without a potential safety impact, the investigation focuses on known hazard sources. Typically, the morphological approach is an adaptation of deductive or inductive approaches, but with its own guidelines.
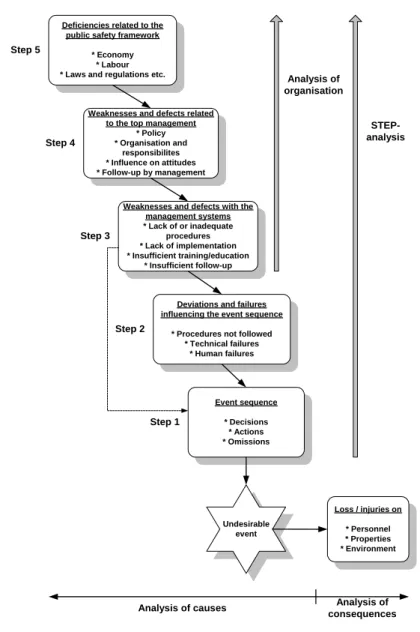
SINTEF has developed a useful five-step model for investigation of causes of accidents. The model is illustrated in Figure 6.
Step 1 is identification of the event sequences just before the accident. Step 2 is identification of deviations and failures influencing the event sequence that led to the accident. This includes deviations from existing procedures, deviations from common practice, technical failures and human failures. Step 3 is identification of weaknesses and defects with the management systems. The objective is to detect possible causes of the deviations or failures identified in Step 2. Step 4 is identification of weaknesses and defects related to the top management of the company, because it is their responsibility to
deficiencies related to the public safety framework, i.e. marked conditions, laws and regulations.
Figure 6. SINTEF’s model for analysis of accident causes (Arbeidsmiljøsenteret, 2001).
Different methods for analysis of evidence and facts are further discussed in chapter 4.
Deficiencies related to the public safety framework
* Economy * Labour * Laws and regulations etc.
Event sequence * Decisions
* Actions * Omissions Deviations and failures influencing the event sequence
* Procedures not followed * Technical failures
* Human failures Weaknesses and defects with the
management systems * Lack of or inadequate procedures * Lack of implementation * Insufficient training/education * Insufficient follow-up Weaknesses and defects related
to the top management * Policy * Organisation and responsibilites * Influence on attitudes * Follow-up by management Undesirable event Loss / injuries on * Personnel * Properties * Environment
Analysis of causes Analysis of
consequences Step 1 Step 5 Step 4 Step 3 Step 2 Analysis of organisation STEP-analysis
3.3 Recommendations and reporting
One of the main objectives of performing accidents investigations is to identify recommendations that may prevent the occurrence of future accidents. This topic will not be discussed any further, but the recommendations should be based on the analysis of evidence and facts in order to prevent that the revealed direct and root causes might lead to future accidents. At the company level the recommended risk reducing measures might be focused on technical, human, operational and/or organisational factors. Often, it is even more important to focus attention towards changes in the higher levels in Figure 4, e.g., by changing the regulations or the authoritative supervisory practice. A useful tip is to be open-minded in the search for risk reducing measures and not to be narrow in this part of the work.
Hendrick and Benner (1987) says that two thoughts should be kept in mind regarding accident reports:
• Investigations are remembered trough their reports
4 Methods for accident investigations
A number of methods for accident investigation have been developed, with their own strengths and weaknesses. Some methods of great importance are selected for further examination in this chapter. The selection of methods for further description is not based on any scientific selection criteria. But the methods are widely used in practice, well acknowledged, well described in the literature4 and some methods that are relatively recently developed.In order to show the span in different accident investigation methods, Table 1 shows an oversight over methods described by DOE (1999) and Table 2 shows an oversight described by CCPS (1992). Some of the methods in the tables are overlapping, while some are different.
Table 1. Accident investigation analytical techniques presented in DOE (1999).
Core Analytical Techniques
Events and Causal Factors Charting and Analysis Barrier Analysis
Change Analysis Root Cause Analysis
Complex Analytical Techniques
For complex accidents with multiple system failures, there may in addition be need of analytical techniques like analytic tree analysis, e.g.
Fault Tree Analysis
MORT (Management Oversight and Risk Tree) PET (Project Evaluation Tree Analysis) Specific Analytical Techniques
Human Factors Analysis
Integrated Accident Event Matrix Failure Modes and Effects Analysis Software Hazards Analysis
Common Cause Failure Analysis Sneak Circuit Analysis
72-Hour Profile
Materials and Structural Analysis
Scientific Modelling (e.g., for incidents involving criticality and atmospheric despersion)
4
Some methods are commercialised and therefore limited described in the
Table 2. Accident investigations methods described by CCPS (1992).
Investigation method
Accident Anatomy method (AAM) Action Error Analysis (AEA)
Accident Evolution and Barrier Analysis (AEB) Change Evaluation/Analysis
Cause-Effect Logic Diagram (CELD) Causal Tree Method (CTM)
Fault Tree Analysis (FTA)
Hazard and Operability Study (HAZOP)
Human Performance Enhancement System (HPES)1
Human Reliability Analysis Event Tree (HRA-ET)
Multiple-Cause, Systems-oriented Incident Investigation (MCSOII) Multilinear Events Sequencing (MES)
Management Oversight Risk Tree (MORT)
Systematic Cause Analysis Technique (SCAT)1
Sequentially Timed Events Plotting (STEP)
TapRoot™ Incident Investigation System1
Technique of Operations Review (TOR) Work Safety Analysis
1
Proprietary techniques that requires a license agreement.
These two tables list more than 20 different methods, but do not include a complete list of methods. Other methods are described elsewhere in the literature.
Since DOE’s Workbook Conducting Accident Investigation (DOE, 1999) is a comprehensive and well-written handbook, the description of accident investigation methods starts with DOE’s core analytical techniques in section 4.1. Their core analytical techniques are:
• Events and Causal Factors Charting and Analysis
• Barrier Analysis
• Change Analysis
• Root Cause Analysis
• SCAT (Systematic Cause Analysis Technique)
• STEP (Sequential Timed Events Plotting)
• MTO-analysis
• AEB Method
• TRIPOD-Delta
• Acci-Map
The four last methods are neither listed in Table 1 nor Table 2, but are commonly used methods in different industries in several European countries.
The readers should be aware of that this chapter is purely descriptive. Any comments or assessments of the methods are made in chapter 5.
4.1 DOE’s core analytical techniques
54.1.1 Events and causal factors charting (ECFC)
Events and causal factors charting is a graphical display of the accident’s chronology and is used primarily for compiling and organising evidence to portray the sequence of the accident’s events. The events and causal factor chart is easy to develop and provides a clear depiction of the data. Keeping the chart up-to-date helps insure that the investigation proceeds smoothly, that gaps in information are identified, and that the investigators have a clear representation of accident chronology for use in evidence collection and witness interviewing.
Events and causal factors charting is useful in identifying multiple causes and graphically depicting the triggering conditions and events necessary and sufficient for an accident to occur.
Events and causal factors analysis is the application of analysis to determine causal factors by identifying significant events and conditions that led to the accident. As the results from other analytical techniques are completed, they are incorporated into the events and causal factors chart. “Assumed” events and conditions may also be incorporated in the chart.
5
DOE (1999) pinpoints some benefits of the event and causal factors charting:
• Illustrating and validating the sequence of events leading to the accident and the conditions affecting these events
• Showing the relationship of immediately relevant events and conditions to those that are associated but less apparent – portraying the relationships of organisations and individuals involved in the accident
• Directing the progression of additional data collection and analysis by identifying information gaps
• Linking facts and causal factors to organisational issues and management systems
• Validating the results of other analytic techniques
• Providing a structured method for collecting, organising, and integrating collected evidence
• Conveying the possibility of multiple causes
• Providing an ongoing method for organising and presenting data to facilitate communication among the investigators
• Clearly presenting information regarding the accident that can be used to guide report writing
• Providing an effective visual aid that summarises key information regarding the accident and its causes in the investigation report.
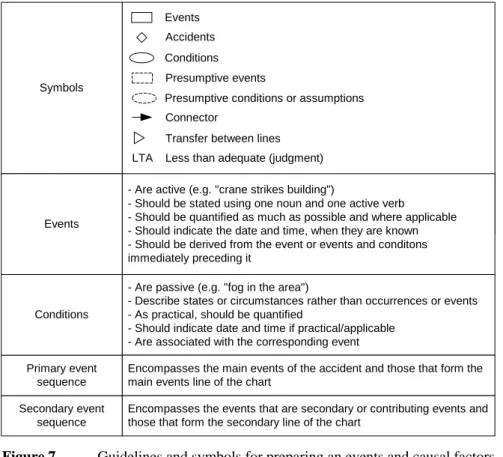
Figure 7 gives an overview over symbols used in an event and causal factor chart and some guidelines for preparing such a chart.
Figure 7. Guidelines and symbols for preparing an events and causal factors chart. (DOE, 1999)
Figure 8 shows an event and causal factors chart in general.
Figure 8. Simplified events and causal factors chart. (DOE, 1999)6.
6
Similar to MES in Table 2.
Condition Accident event Condition Secondary event 1 Event 1 Secondary event 2 Event 4 Event 3 Event 2 Secondary events sequence Primary events sequence Condition Condition Condition Events Accidents Conditions Connector
Transfer between lines Less than adequate (judgment) LTA
- Are active (e.g. "crane strikes building")
- Should be stated using one noun and one active verb
- Should be quantified as much as possible and where applicable - Should indicate the date and time, when they are known - Should be derived from the event or events and conditons immediately preceding it
- Are passive (e.g. "fog in the area")
- Describe states or circumstances rather than occurrences or events - As practical, should be quantified
- Should indicate date and time if practical/applicable - Are associated with the corresponding event
Encompasses the main events of the accident and those that form the main events line of the chart
Encompasses the events that are secondary or contributing events and those that form the secondary line of the chart
Secondary event sequence Primary event sequence Conditions Symbols Events Presumptive events
4.1.2 Barrier analysis
Barrier analysis is used to identify hazards associated with an accident and the barriers that should have been in place to prevent it. A barrier is any means used to control, prevent, or impede the hazard from reaching the target.
Barrier analysis addresses:
• Barriers that were in place and how they performed
• Barriers that were in place but not used
• Barriers that were not in place but were required
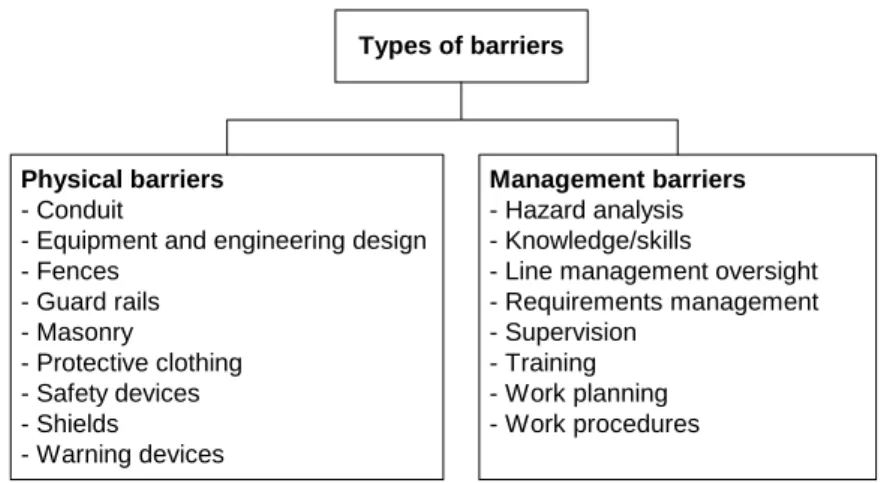
• The barrier(s) that, if present or strengthened, would prevent the same or similar accidents from occurring in the future. Figure 9 shows types of barriers that may be in place to protect workers from hazards.
Figure 9. Examples on barriers to protect workers from hazards (DOE, 1999)7
Physical barriers are usually easy to identify, but management system barriers may be less obvious (e.g. exposure limits). The investigator must understand each barrier’s intended function and location, and how it failed to prevent the accident. There exists different ways in
Types of barriers
Management barriers
- Hazard analysis - Knowledge/skills
- Line management oversight - Requirements management - Supervision - Training - Work planning - Work procedures Physical barriers - Conduit
- Equipment and engineering design - Fences - Guard rails - Masonry - Protective clothing - Safety devices - Shields - Warning devices
which defences or barriers may be categorized, i.e. active or passive barriers (see e.g. Kjellén, 2000), hard or soft defences (see e.g. Reason, 1997), but this topic will not be discussed any further in this report. To analyse management barriers, investigators may need to obtain information about barriers at three organisational levels responsible for the work; the activity, facility and institutional levels. For example, at the activity level, the investigator will need information about the work planning and control processes that governed the work activity, as well as the relevant safety management systems. The investigator may also need information about safety management systems at the facility level. The third type of information would be information about the institutional-level safety management direction and oversight provided by senior line management organisations.
The basic steps of a barrier analysis are shown in Figure 10. The investigator should use barrier analysis to ensure that all failed, unused, or uninstalled barriers are identified and that their impact on the accident is understood. The analysis should be documented in a barrier analysis worksheet. Table 3 illustrates a barrier analysis worksheet.
Figure 10. Basic steps in a barrier analysis (DOE, 1999).
Basic Barrier Analysis steps
Step 1 Identify the hazard and the target. Record them at the top of the
worksheet
Step 2 Identify each barrier. Record in column one.
Step 3 Identify how the barrier performed (What was the barrier’s
purpose? Was the barrier in place or not in place? Did the barrier fail? Was the barrier used if it was in place?) Record in column two.
Step 4 Identify and consider probable causes of the barrier failure.
Record in column three.
Step 5 Evaluate the consequences of the failure in this accident. Record
Table 3. Barrier analysis worksheet.
Hazard: 13.2 kV electrical cable Target: Acting pipefitter
What were the barriers?
How did each barrier perform?
Why did the barrier fail?
How did the barrier affect the accident? Engineering drawings Drawings were incomplete and did not identify electrical cable at sump location Engineering drawings and construction specifications were not procured Drawings used were preliminary No as-built
drawings were used to identify location of utility lines Existence of electrical cable unknown Indoor excavation permit Indoor excavation permit was not obtained Pipefitters and utility specialist were unaware of indoor excavation permit requirements Opportunity to identify existence of cable missed 4.1.3 Change analysis
Change is anything that disturbs the “balance” of a system operating as planned. Change is often the source of deviations in system operations. Change analysis examines planned or unplanned changes that caused undesired outcomes. In an accident investigation, this technique is used to examine an accident by analysing the difference between what has occurred before or was expected and the actual sequence of events. The investigator performing the change analysis identifies specific differences between the accident–free situation and the accident scenario. These differences are evaluated to determine whether the differences caused or contributed to the accident.
identify all causal factors of an accident. When conducting a change analysis, it is important to have a baseline situation that the accident sequence may be compared to.
Figure 11. The change analysis process. (DOE, 1999)
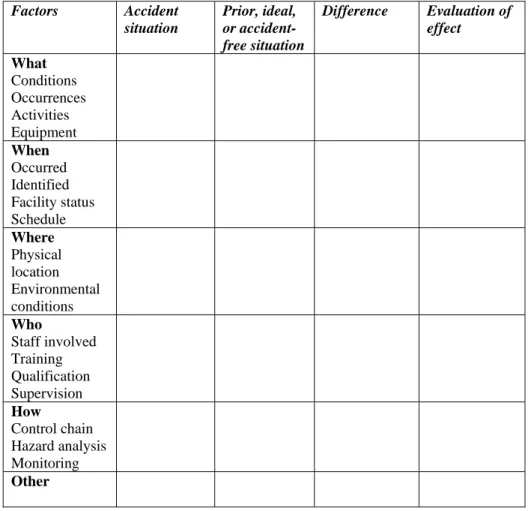
Table 4 shows a simple change analysis worksheet. The investigators should first categorise the changes according to the questions shown in the left column of the worksheet, i.e., determine if the change pertained to, for example, a difference in:
• What events, conditions, activities, or equipment were present in the accident situation that were not present in the baseline (accident-free, prior, or ideal) situation (or vice versa)
• When an event or condition occurred or was detected in the accident situation versus the baseline situation
• Where an event or condition occurred in the accident situation versus where an event or condition occurred in the baseline situation
• Who was involved in planning, reviewing, authorising, performing, and supervising the work activity in the accident versus the accident-free situation.
• How the work was managed and controlled in the accident versus the accident-free situation.
To complete the remainder of the worksheet, first describe each event or condition of interest in the second column. Then describe the related event or condition that occurred (or should have occurred) in the baseline situation in the third column. The difference between the event and conditions in the accident and the baseline situations should
Describe accident situation
Describe comparable accident-free situation
Input results into events and causal
factors chart Analyse differences for effect on accident Identify differences Compare
be briefly described in the fourth column. In the last column, discuss the effect that each change had on the accident.
The differences or changes identified can generally be described as causal factors and should be noted on the events and causal factors chart and used in the root cause analysis.
A potential weakness of change analysis is that it does not consider the compounding effects of incremental change (for example, a change that was instituted several years earlier coupled with a more recent change). To overcome this weakness, investigators may choose more than one baseline situation against which to compare the accident scenario.
Table 4. A simple change analysis worksheet. (DOE, 1999)
Factors Accident situation Prior, ideal, or accident-free situation Difference Evaluation of effect What Conditions Occurrences Activities Equipment When Occurred Identified Facility status Schedule Where Physical location Environmental conditions Who Staff involved Training Qualification Supervision How Control chain Hazard analysis Monitoring
4.1.4 Events and causal factors analysis
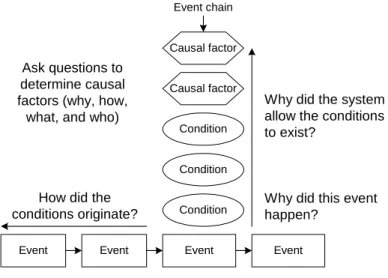
The events and causal factors chart may also be used to determine the causal factors of an accident, as illustrated in Figure 12. This process is an important first step in later determining the root causes of an accident. Events and causal factors analysis requires deductive reasoning to determine which events and/or conditions that contributed to the accident.
Figure 12. Events and causal factors analysis. (DOE, 1999)
Before starting to analyse the events and conditions noted on the chart, an investigator must first ensure that the chart contains adequate detail. Examine the first event that immediately precedes the accident. Evaluate its significance in the accident sequence by asking:
“If this event had not occurred, would the accident have occurred?”
If the answer is yes, then the event is not significant. Proceed to the next event in the chart, working backwards from the accident. If the answer is no, then determine whether the event represented normal activities with the expected consequences. If the event was intended and had the expected outcomes, then it is not significant. However, if the event deviated from what was intended or had unwanted consequences, then it is a significant event.
Condition Causal factor
Causal factor
Condition Condition
Event Event Event Event
How did the conditions originate?
Why did the system allow the conditions to exist?
Why did this event happen?
Ask questions to determine causal factors (why, how,
what, and who)
Carefully examine the events and conditions associated with each significant event by asking a series of questions about this event chain, such as:
• Why did this event happen?
• What events and conditions led to the occurrence of the event?
• What went wrong that allowed the event to occur?
• Why did these conditions exist?
• How did these conditions originate?
• Who had the responsibility for the conditions?
• Are there any relationships between what went wrong in this event chain and other events or conditions in the accident sequence?
• Is the significant event linked to other events or conditions that may indicate a more general or larger deficiency?
The significant events, and the events and conditions that allowed the significant events to occur, are the accident’s causal factors.
4.1.5 Root cause analysis
Root cause analysis is any analysis that identifies underlying deficiencies in a safety management system that, if corrected, would prevent the same and similar accidents from occurring. Root cause analysis is a systematic process that uses the facts and results from the core analytic techniques to determine the most important reasons for the accident. While the core analytic techniques should provide answers to questions regarding what, when, where, who, and how, root cause analysis should resolve the question why. Root cause analysis requires a certain amount of judgment.
A rather exhaustive list of causal factors must be developed prior to the application of root cause analysis to ensure that final root causes are accurate and comprehensive.
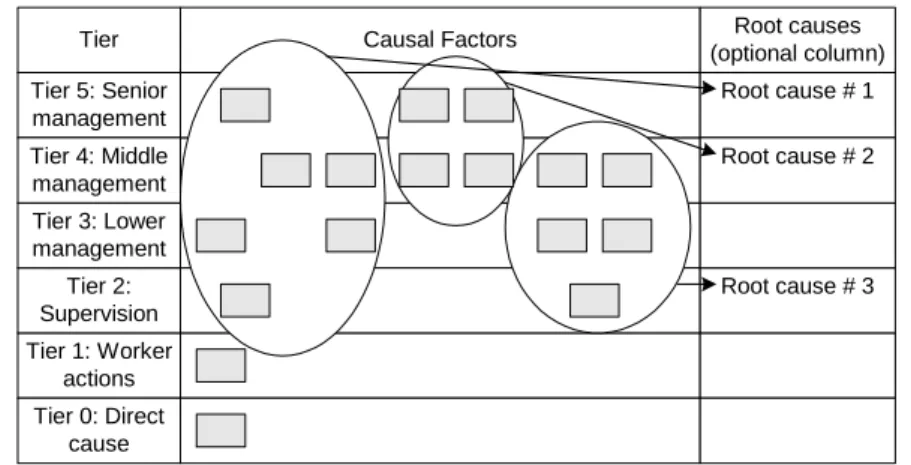
One method for root cause analysis described by DOE is TIER diagramming. TIER-diagramming is used to identify both the root causes of an accident and the level of line management that has the
Linkages among causal factors are then identified and possible root causes are developed. A different diagram is developed for each organisation responsible for the work activities associated with the accident.
The causal factors identified in the events and causal factors chart are input to the TIER-diagrams. Assess where each causal factor belong in the TIER-diagram. After arranging all the causal factors, examine the causal factors to determine whether there is linkage between two or more of them. Evaluate each of the causal factors statements if they are root causes of the accident. There may be more than one root cause of a particular accident.
Figure 13 shows an example on a TIER-diagram.
Figure 13. Identifying the linkages to the root causes from a TIER-diagram.
4.2 Other accident investigation methods
4.2.1 Fault tree analysis8Fault tree analysis is a method for determining the causes of an accident (or top event). The fault tree is a graphic model that displays the various combinations of normal events, equipment failures, human errors, and environmental factors that can result in an accident. An example of a fault tree is shown in Figure 14.
8
The description is based on Høyland & Rausand, 1994.
Causal Factors Tier Tier 5: Senior management Tier 1: Worker actions Tier 2: Supervision Tier 3: Lower management Tier 4: Middle management Tier 0: Direct cause Root causes (optional column) Root cause # 1 Root cause # 3 Root cause # 2
Figure 14. Illustration of a fault tree (example from the Åsta-accident).
A fault tree analysis may be qualitative, quantitative, or both. Possible results from the analysis may be a listing of the possible combinations of environmental factors, human errors, normal events and component failures that may result in a critical event in the system and the probability that the critical event will occur during a specified time interval.
The strengths of the fault tree, as a qualitative tool is its ability to break down an accident into root causes.
The undesired event appears as the top event. This event is linked to the basic failure events by logic gats and event statements. A gate symbol can have one or more inputs, but only one output. A summary of common fault tree symbols is given in Figure 15. Høyland and Rausand (1994) give a more detailed description of fault tree analysis.
Malfunction of the signalling system
Human error (engine driver) Line section already "occupied" by another train Sabotage/ act of terros Engine failure (runaway train) Or Or No signal Green signal (green flash)
Figure 15. Fault tree symbols.
4.2.2 Event tree analysis9
An event tree is used to analyse event sequences following after an initiating event. The event sequence is influenced by either success or failure of numerous barriers or safety functions/systems. The event sequence leads to a set of possible consequences. The consequences may be considered as acceptable or unacceptable. The event sequence
9
The description is based on Villemeur, 1991. A And E1 E2 E3 A Or E1 E2 E3
The OR-gate indicates that the output event A occurs if any of the
input events Ei occur.
The AND-gate indicates that the output event A occurs when all the
input events Ei occur simultaneously.
Basic event
Undeveloped event
Comment rectangle
The basic event represents a basic equipment failure that requires no further development of failure causes
The undeveloped event represents an event that is not examined further because information is unavailable or because its consequences is insignificant
The comment rectangle is for supplementary information
The transfer-out symbol indicates that the fault tree is developed further at the occurrence of the corresponding Transfer-in symbol Transfer-out Transfer-in Logic gates Input events Description of state Transfer symbols AND-gate OR-gate Symbol Description
is illustrated graphically where each safety system is modelled for two states, operation and failure.
Figure 16 illustrates an event tree of the situation on Rørosbanen just before the Åsta-accident. This event tree reveals the lack of reliable safety barriers in order to prevent train collision at Rørosbanen at that time.
An event tree analysis is primarily a proactive risk analysis method used to identify possible event sequences. The event tree may be used to identify and illustrate event sequences and also to obtain a qualitative and quantitative representation and assessment. In an accident investigation we may illustrate the accident path as one of the possible event sequences. This is illustrated with the thick line in Figure 16.
Figure 16. Simplified event tree analysis of the risk at Rørosbanen just before the Åsta-accident.
4.2.3 MORT10
MORT provides a systematic method (analytic tree) for planning, organising, and conduction a comprehensive accident investigation. Through MORT analysis, investigators identify deficiencies in specific
Two trains at the same section of the line
ATC (Automatic Train
Control)
The rail traffic controller detects
the hazardous situation
Train drivers stop the train The rail traffic
controller alerts about the hazard
Yes Yes Yes Yes No No No No Collision Collison avoided Collision Collision Collison avoided
control factors and in management system factors. These factors are evaluated and analysed to identify the causal factors of the accident. Basically, MORT is a graphical checklist in which contains generic questions that investigators attempt to answer using available factual data. This enables investigators to focus on potential key causal factors. The upper levels of the MORT diagram are shown in Figure 17.
MORT requires extensive training to effectively perform an in-depth analysis of complex accidents involving multiple systems. The first step of the process is to select the MORT chart for the safety program area of interest. The investigators work their way down through the tree, level by level. Events should be coded in a specific colour relative to the significance of the accident. An event that is deficient, or Less Than Adequate (LTA) in MORT terminology is marked red. The symbol is circled if suspect or coded in red if confirmed. An event that is satisfactory is marked green in the same manner. Unknowns are marked in blue, being circled initially and coloured if sufficient data do not become available, and an assumption must be made to continue or conclude the analysis.
When the appropriate segments of the tree have been completed, the path of cause and effect (from lack of control by management, to basic causes, contributory causes, and root causes) can easily be traced back through the tree. The tree highlights quite clearly where controls and corrective actions are needed and can be effective in preventing recurrence of the accident.
Figure 17. The upper levels of the MORT-tree.
PET (Project Evaluation Tree) and SMORT (Safety Management and Organisations Review Technique) are both methods based on MORT but simplified and easier to use. PET and SMORT will not be described further. PET is described by DOE (1999) and SMORT by Kjellén et al (1987).
4.2.4 Systematic Cause Analysis Technique (SCAT)11
The International Loss Control Institute (ILCI) developed SCAT for the support of occupational incident investigation. The ILCI Loss Causation Model is the framework for the SCAT system (see Figure 18).
Injuries, damage, other costs, performance lost
or degraded Future undesired events 1 Or Implementation LTA Amelioration LTA Accident Management system factos LTA Specific controls factors LTA Oversights and
omissions Assumed risks
Risk assessment system LTA Risk 2
Risk 1 Risk 3 Risk n
And Or Or Policy LTA T S/M S M
SA1 SA2 MA1 MA2 MA3
Or
What happened? Why?
A B C D R A Drawing break. Transfer to section of tree indicated by symbol identification letter-number
Figure 18. The ILCI Loss Causation Model (Bird and Germain, 1985).
The result of an accident is loss, e.g. harm to people, properties, products or the environment. The incident (the contact between the source of energy and the “victim”) is the event that precedes the loss. The immediate causes of an accident are the circumstances that immediately precede the contact. They usually can be seen or sensed. Frequently they are called unsafe acts or unsafe conditions, but in the ILCI-model the terms substandard acts (or practices) and substandard conditions are used. Substandard acts and conditions are listed in Figure 19.
Figure 19. Substandard acts and conditions in the ILCI-model.
Basic causes are the diseases or real causes behind the symptoms, the reasons why the substandard acts and conditions occurred. Basic causes help explain why people perform substandard practices and
Lack of
control Incident Loss
Immediate causes Basic causes Inadequate: Program Program standards Compliance to standards Personal factors Job factors People Property Product Environment Service Contact with energy, substance or people Substandard acts Substandard conditions
Substandard practices/acts Substandard conditions
1. Operating equipment without authority 2. Failure to warn
3. Failure to secure
4. Operating at improper speed 5. Making safety devices inoperable 6. Removing safety devices 7. Using defective equipment 8. Using equipment improperly
9. Failing to use personal protective equipment 10. Improper loading
11. Improper placement 12. Improper lifting
13. Improper position for task 14. Servicing equipmnet in operation 15. Horseplay
16. Under influence of alcohol/drugs
1. Inadequate guards or barriers
2. Inadequate or improper protective equipment 3. Defective tools, equipment or materials 4. Congestion or restricted action 5. Inadequate warning system 6. Fire and explosion hazards
7. Poor housekeeping, disorderly workplace 8. Hazardous environmental conditions 9. Noise exposures
10. Radiation exposures
11. High or low temperature exposures 12. Inadequate or excessive illumination 13. Inadequate ventilation
why substandard conditions exists. An overview of personal and job factors are given in Figure 20.
Figure 20. Personal and job factors in the ILCI-model.
There are three reasons for lack of control: 1. Inadequate program
2. Inadequate program standards and 3. Inadequate compliance with standards
Figure 21 shows the elements that should be in place in a safety program. The elements are based on research and experience from successful safety programs in different companies.
Figure 21. Elements in a safety program in the ILCI-model.
The Systematic Cause Analysis Technique is a tool to aid an
Personal factors Job factors
1. Inadequate capability - Physical/physiological - Mental/psychological 2. Lack of knowledge 3. Lack of skill 4. Stress - Physical/physiological - Mental/psychologica 5. Improper motivation
1. Inadequate leadership and/or supervision 2. Inadequate engineering
3. Inadequate purchasing 4. Inadequate maintenance
5. Inadequate tools, equipment, materials 6. Inadequate work standards
7. Wear and tear 8. Abuse or misuse
Elements in a safety program
1. Leadership and administration 2. Management training
3. Planned inspection
4. Task analysis and procedures 5. Accident/incident investigation 6. Task observations 7. Emergency preparedness 8. Organisational rules 9. Accident/incident analysis 10. Employee training
11. Personal protective equipment 12. Health control
13. Program evaluation system 14. Engineering controls 15. Personal communications 16. Group meetings
17. General promotion 18. Hiring and placement 19. Purchasing controls 20. Off-the-job safety
blocks on a SCAT chart. Each block corresponds to a block of the loss causation model. Hence, the first block contains space to write a description of the incident. The second block lists the most common categories of contact that could have led to the incident under investigation. The third block lists the most common immediate causes, while the fourth block lists common basic causes. Finally, the bottom block lists activities generally accepted as important for a successful loss control program. The technique is easy to apply and is supported by a training manual.
The SCAT seems to correspond to the SYNERGI tool for accident registration used in Norway. At least, the accident causation models used in SCAT and SYNERGI are equivalent.
4.2.5 STEP (Sequential timed events plotting)12
The STEP-method was developed by Hendrick and Benner (1987). They propose a systematic process for accident investigation based on multi-linear events sequences and a process view of the accident phenomena.
STEP builds on four concepts:
1. Neither the accident nor its investigation is a single linear chain or sequence of events. Rather, several activities take place at the same time.
2. The event Building Block format for data is used to develop the accident description in a worksheet. A building block describes one event, i.e. one actor performing one action.
3. Events flow logically during a process. Arrows in the STEP worksheet illustrate the flow.
4. Both productive and accident processes are similar and can be understood using similar investigation procedures. They both involve actors and actions, and both are capable of being repeated once they are understood.
With the process concept, a specific accident begins with the action that started the transformation from the described process to an
12
accident process, and ends with the last connected harmful event of that accident process.
The STEP-worksheet provides a systematic way to organise the building blocks into a comprehensive, multi-linear description of the accident process. The STEP-worksheet is simply a matrix, with rows and columns. There is one row in the worksheet for each actor. The columns are labelled differently, with marks or numbers along a time line across the top of the worksheet, as shown in Figure 22. The time scale does not need to be drawn on a linear scale, the main point of the time line is to keep events in order, i.e., how they relate to each other in terms of time.
Figure 22. STEP-worksheet.
An event is one actor performing one action. An actor is a person or an item that directly influences the flow or events constituting the accident process. Actors can be involved in two types of changes, adaptive changes or initiating changes. They can either change reactively to sustain dynamic balance or they can introduce changes to which other actors must adapt. An action is something done by the actor. It may be physical and observable, or it may be mental if the actor is a person. An action is something that the actor does and must be stated in the active voice.
The STEP worksheet provides a systematic way to organise the building blocks (or events) into a comprehensive, multi-linear description of the accident process. Figure 23 shows an example on a
Actor A Actor D Actor C Actor B T0 Time Etc.
STEP-diagram of an accident where a stone block falls off a truck and hits a car13.
Figure 23. An example on a simple STEP-diagram for a car accident.
The STEP-diagram in Figure 23 also shows the use of arrows to link tested relationships among events in the accident chain. An arrow convention is used to show precede/follow and logical relations between two or more events. When an earlier action is necessary for a latter to occur, an arrow should be drawn from the preceding event to the resultant event. The thought process for identifying the links between events is related to the change of state concepts underlying STEP methods. For each event in the worksheet, the investigator asks, “Are the preceding actions sufficient to initiate this actions (or event) or were other actions necessary?” Try to visualize the actors and actions in a “mental movie” in order to develop the links.
Sometimes it is important to determine what happened during a gap or time interval for which we cannot gather any specific evidence. Each remaining gap in the worksheet represents a gap in the understanding of the accident. BackSTEP is a technique by which you reason your way backwards from the event on the right side of the worksheet gap
13
The STEP-diagram is based on a description of the accident in a newspaper article. T0 Time Car Car driver Drap Stone block Truck Truck driver loads stone on truck Truck driver drives truck from A to B Truck drives from A to B Car driver dies Truck driver fastens the stone block Car drive from B to A
Car driver tries to avoid to hit
the stone
The car hits the stone
block Stone falls off
the truck Drap fails
The car "coll-apses" (coll-ision damaged) Car driver
starts the car
Legend Truck driver Drap fails Actor Event link Actor Truck driver Car driver observes the stone Car driver strikes