160
CONSIDERATIONS RELATING TO INTERNATIONAL TRADE
WITH CORN (2009 - 2011)
PÂNZARU R.L., MEDELETE D.M.
Faculty of Agriculture and Horticulture, University of Craiova
Key words: corn, imports, exports, quantity, value, balance of trade
ABSTRACT
Starting from the importance of maize crop (food, industrial, fodder, agricultural technology and technological, export, etc.) and the size of cultivation of this plant worldwide, it was considered interesting a topic related to international trade of this product.
Presenting the essential aspects of the phenomenon of international trade, corn for are materialized the by highlighting - quantity and value - of imports and exports. Data collected mentions both global levels, continental and national relevant phenomena.
Unfortunately the work could not capture the qualitative aspects, nor those related to the existence of genetically modified organisms, mainly due to lack of space for spreading study, but also because of the high complexity of observations to be achieved.
INTRODUCTION
The importance and economic benefits of corn production arising from its use or intended versatility: fodder, industrial, agricultural technology - technological item for export and source of profit for farms.
The factors of profitability and economic efficiency in the production of maize grain are: average yield per hectare, production management and marketing costs.
In regulating grain markets and directing production for these crops an important role belongs to creating a balance between supply and demand. At the current stage of our country's EU accession policy objectives differ according to the preconditions for recovery of agriculture in general.
Export has the content or investing overseas sale of goods or values, processed products, completed or repaired in a country.
Regarding the export of agricultural products, it should be understood that all commercial operations through plant and animal products - unprocessed or processed, in varying degrees - are sold on the external market.
An export of agricultural products is a part of overall exports to the national economy is committed, covering the following objectives: participation in international division of labor; attract hard currencies or currency ratio required of all economic agents in agriculture.
Factors that influence the export of agricultural plants and animals are domestic market supply and demand of agricultural products - directly and indirectly supplying the population for industrial processing; trends in demand and supply on the world market for agricultural products.
METHOD AND MATERIAL
For carrying out the study are used a system of indicators to highlight specific trade with sunflowers - imports, exports, trade balance.
161
𝑀 =𝑋1+ 𝑋2+. . . . +𝑋𝑛 n
In the case of the composition of indicators has appealed to the following formula:
𝑆 = 𝑋1, 𝑋2, … … , 𝑋𝑛
𝑋𝑡 𝑥100
RESULTS AND DISCUSSIONS
It shows the structure and evolution - in time - of imports and exports, worldwide, with corn and their trade balance (period 2008-2010).
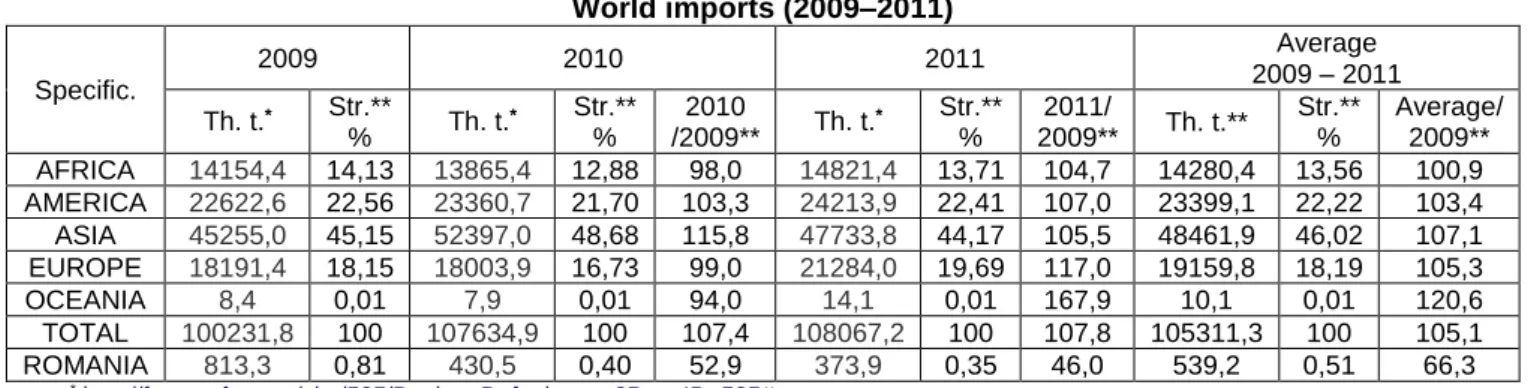
Table 1 presents the evolution and structure of imports worldwide.
Table 1 CORN –
World imports (2009–2011)
Specific.
2009 2010 2011 2009 – 2011 Average
Th. t.* Str.**
% Th. t.
* Str.** %
2010
/2009** Th. t.
* Str.** %
2011/
2009** Th. t.**
Str.** %
Average/ 2009** AFRICA 14154,4 14,13 13865,4 12,88 98,0 14821,4 13,71 104,7 14280,4 13,56 100,9 AMERICA 22622,6 22,56 23360,7 21,70 103,3 24213,9 22,41 107,0 23399,1 22,22 103,4 ASIA 45255,0 45,15 52397,0 48,68 115,8 47733,8 44,17 105,5 48461,9 46,02 107,1 EUROPE 18191,4 18,15 18003,9 16,73 99,0 21284,0 19,69 117,0 19159,8 18,19 105,3 OCEANIA 8,4 0,01 7,9 0,01 94,0 14,1 0,01 167,9 10,1 0,01 120,6 TOTAL 100231,8 100 107634,9 100 107,4 108067,2 100 107,8 105311,3 100 105,1 ROMANIA 813,3 0,81 430,5 0,40 52,9 373,9 0,35 46,0 539,2 0,51 66,3
* http://faostat.fao.org/site/535/DesktopDefault.aspx?PageID=535#ancor **own calculations
In 2009 the global quantities imported have reached 100 231, 8 thousand tons value that was established by percentage contribution of 45.15% for Asia - 45255.0 thousand tons, 22.56% America – 22622.6 thousand tons, 18.15% Europe - 18191,4 thousand tons, 14.13% Africa – 14154.4 thousand tons and 0.01% for Oceania – 8.4 thousand tons.
In the case of 2010 there is significant amount of 7.9 thousand tons for Oceania, 13865.4 thousand tons in Africa, Europe 18003.9 thousand tons, where 23360.7 thousand tons for American continent and 52397.0 thousand tons for Asian continent, amounts which led to a global indicator of 107634.9 thousand tons. Given this situation, the structure pointer highlights continental weights: 0.01% Oceania, Africa 12.88%, 16.73 % Europe, 21.70% and 48.68% for Africa and America.
In 2011, Asia imported 47733.8 thousand tons of corn - 44.17% in the structure, America 24213.9 thousand tons - 22.41%, Europe 21284.0 thousand tons - 19.69%, Africa 14821.4 thousand tons - 13.71% and Oceania 14.1 thousand tons - 0.01%. These amounts were determined a global level indicator of 108067.2 thousand tons.
162
Fig. 1. CORN. World imports quantitative structure - average of the period (%)
Regarding Romania's contribution to the achievement of global level indicator, average participation rate was 0.51% - 0.81 sequential levels, 0.40 and 0.35% for 2009, 2010 and the year 2011 to 539.2, 813.3, 430.5 and 373.9 thousand t. (Fig. 2.).
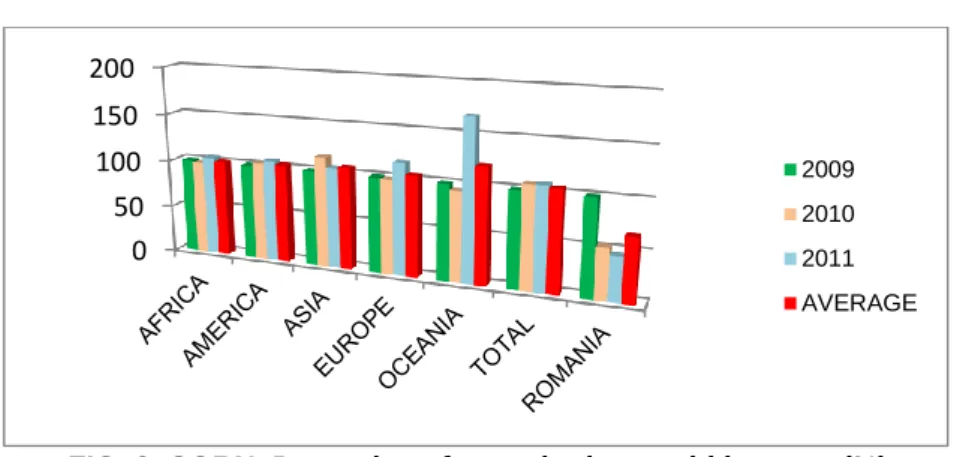
If we analyze the evolution in time of the indicator (Fig. 3) may offer the following observations:
for African continent indicator registered an uneven evolution (due to the situation in 2010 and 2011), beside the reporting base - 2009. Thus 2010 and 2011 indices with fixed base values were 98.0% and 104 7%, and the average period exceeded 0.9% in 2009;
the American continent can find the rising evolution of the indicator, the dynamics is dominated by the component index above par levels - exceeding by 3.3, 3.4 and 7.0% the reporting base (2009) for 2010, the average of the period and respective year 2011;
the Asian continent has shown an upward trend indicator uneven. In this regard it is noted overtaking the reference term: 1.05 times for 2011, 1.07 times the average period 1.15 times in 2010;
Europe imports have evolved quantitative uneven. This specific decreases of 1.0% in 2010, were followed by increases of 17.0% for 2011. The average period exceeds term of reference by 5.3%;
in the case of Oceania the indicator has evolved unevenly - 94.0 and 167.9% limits for the years 2010 and 2011 compared to the base of reporting. Regarding the average of the period there is an outrunning by 1.20 times beside the term of comparison;
global indicator evolved strictly ascending. As a result we talk about exceedances of reporting base: 5.1% for the average of the period, 7.4% for 2010, 7.8% in 2011;
Romania is characterized by a strict downward trend in imports of corn, negative differences - compared to term of reference - being 33.7, 47.1 and 54.0% for the average of the period 2010 and respective 2011.
FIG. 2. CORN. Romania - share in world imports quantitative structure (%) 13,56
22,22 46,02
18,19 0,01
AFRICA AMERICA ASIA EUROPE OCEANIA
0,81
163
FIG. 3. CORN. Dynamics of quantitative world imports (%)
Table 2 presents the quantitative exports of maize and food aid implemented worldwide.
Table 2. CORN –
World exports (2009–2011)
Specific.
2009 2010 2011 2009 – 2011 Average
Th. t.* Str.**
% Th. t.*
Str.** %
2010
/2009** Th. t.*
Str.** %
2011
/2009** Th. t.**
Str.** %
Average /2009** AFRICA 1799,6 1,79 1587,5 1,47 88,2 3647,6 3,33 202,7 2344,9 2,21 130,3 AMERICA 66718,7 66,29 81886,2 75,93 122,7 73790,4 67,30 110,6 74131,7 69,90 111,1 ASIA 5131,7 5,10 3561,3 3,31 69,4 5187,7 4,73 101,1 4626,9 4,36 90,2 EUROPE 26979,5 26,80 20797,4 19,28 77,1 26972,9 24,60 99,9 24916,6 23,50 92,4 OCEANIA 21,6 0,02 13,7 0,01 63,4 47,4 0,04 219,4 27,6 0,03 127,6 TOTAL 100651,1 100 107846,1 100 107,1 109646,0 100 108,9 106047,7 100 105,4 ROMANIA 1686,4 1,68 2054,5 1,90 121,8 2310,7 2,11 137,0 2017,2 1,90 119,6 * http://faostat.fao.org/site/535/DesktopDefault.aspx?PageID=535#ancor
**own calculations
In 2009 the global quantities exported have reached 100651.1 thousand tons, level established by effective contributions that vary from 21.6 thousand tons for Oceania to 66618.7 thousand tons in the case of American continent. Following this situation, we share variable continental weights with structure, as follows: 0.02% Oceania, 1.79% African - 1,799,600 t, 5.10% Asian - 5,131,700 t, 26.80 % Europe - 26,979,500 t, 66.29% America.
For 2010 exported quantities ranged from 13.7 and 81886.2 thousand tons for Oceania to the American continent, which led to a global indicator of 107846.1 thousand tons. The structure composed includes weights of 0.01 % in Oceania, 1.47% African – 1587.5 thousand tons, 3.31% for the Asian continent – 3561.3 thousand tons, 19.28% in the European continent – 20797.4 thousand tons and 75.93 % for America.
For 2011 the total amount exported was 109646.0 thousand tons, this being based on continental levels: 47.4 thousand tons Oceania, Africa 3.647.6 thousand tons, 5187.7 thousand tons Asia, 26972.9 thousand tons Europe and America 73790.4 thousand tone. Following these quantities, the structure of the indicator known weights of 0.04% for Oceania, Africa 3.33%, 4.73% in Asia, 24.60% to 67.30% for Europe and America respectively.
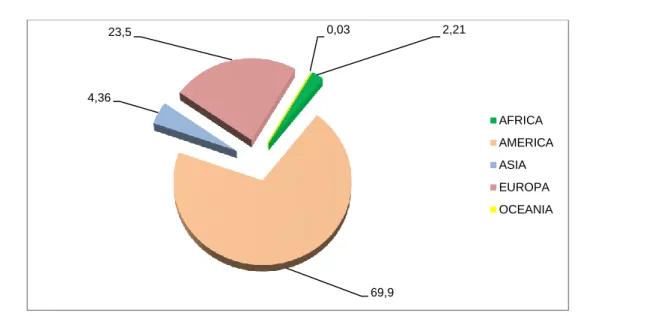
Determining the average of the period been reached to a global quantity exported of 106047.7 thousand tons, which is based on the amount of continental contribution percentage (Fig. 4): 0.03% Oceania (27.6 thousand tons); 2.21% Africa (2344.9 thousand tons); 4.36% Asian (4626.9 thousand tons); 23.50% Europe (24916.6 thousand tons); 69.90% America (74131.7 thousand tons).
0 50 100 150 200
164
FIG. 4. CORN. World exports quantitative structure - period average (%)
Romania recorded worldwide, a share of 1.90% of the total amount of corn exported - 2017.2 compared to 106047.7 thousand tons (Fig. 5). In the years of the series dynamic components Romania shares in world export quantities were 1.68, 1.90 and 2.11% for 2009, 2010 and 2011 (1686.4, 2054.5 and 2310.7 thousand tons).
FIG. 5. CORN. Romania - share in world exports quantitative structure (%)
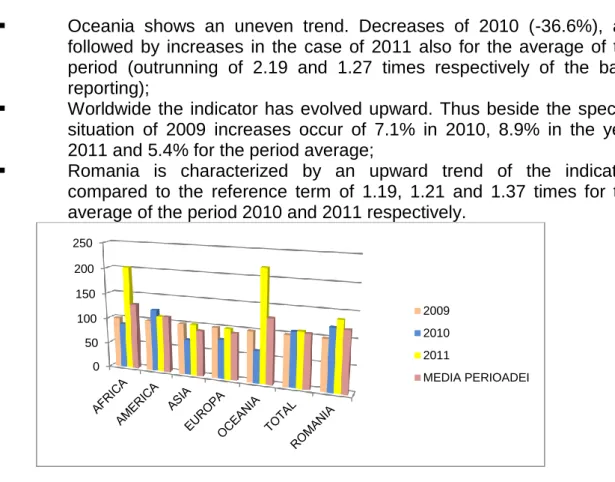
Analyzing the evolution in time of quantities exported of corn (fig. 6) we can formulate a number of considerations such as:
for the African continent the indicator has evolved unevenly compared to the reporting base. So if 2010 was achieved only 88.2% of it, in 2011 there was a 2.02 times outrunning of it and for of the period average the exceeded was 30.3%;
in the case of American continent the indicator trend evolution is an upward one - uneven dynamics consisting only of indexes above unit. They were higher compared to the reporting base 22.7% in 2010, 11.1% for the average of the period and 10.6% in 2011;
Asia is characterized by an uneven development of the indicator. In this regard subunit values of the indices are reported in 2010 also for period average (69.4 and 90.2% respectively), and values above par in 2011 (outrunning to 1.01 times the specific level of 2009);
quantities of maize exported to Europe have evolved downward strict - uneven. Under these conditions decreases compared to term were, 2.01% in 2011, 7.6% for the average of the period and 22.9% in 2010;
2,21
69,9 4,36
23,5 0,03
AFRICA AMERICA ASIA EUROPA OCEANIA
2009 2010 2011 AVERAGE
1,68 1,90
165
Oceania shows an uneven trend. Decreases of 2010 (-36.6%), are followed by increases in the case of 2011 also for the average of the period (outrunning of 2.19 and 1.27 times respectively of the base reporting);
Worldwide the indicator has evolved upward. Thus beside the specific situation of 2009 increases occur of 7.1% in 2010, 8.9% in the year 2011 and 5.4% for the period average;
Romania is characterized by an upward trend of the indicator, compared to the reference term of 1.19, 1.21 and 1.37 times for the average of the period 2010 and 2011 respectively.
FIG. 6. CORN. The dynamics of quantitative exports in the world (%)
Table 3 shows the trade balance of world trade made for maize.
For 2009, global trade balance deficit has character -3052.4 million. $, caused by prominent deficiency aspect for the Asian continent 8935.2 million. $, And the African -2363.9 million deficit. $. The rest of continental trade surpluses: 1.6 mil. $ Oceania, 654.1 mil. $ Europe, and 7591.0 mil. $ America.
Year 2010, mentained the weak trade with maize (-3407.6 mil. $) and this time we have deficits for Asia and Africa (-11753.4 -2616.3 million $ respectively.), While surpluses occur in the American continent and Europe and Oceania (10844.1, 107, 5 and 1.5 mil. $).
In the year 2011 the world situation remains unchanged, but reducing the deficit to 2615.1 mil. $. This level was determined by specific deficits for Africa and Asia (-3467.9, respectively -14384.5 mil. $). As in previous years, the 2011 surplus balances remain in Oceania, Europe and America - 10.9, 1091.5 and 14134.9 million respectively. $.
Table 3. CORN - trade balance of world trade - Thousands. $ (2009-2011)
Specific. 2009 2010 2011
Average 2009 – 2011 export* import* ±** export* import* ±** export* import* ±** export** import** ±** AFRICA 518,1 2882,0 -2363,9 432,4 3039,7 -2616,3 1158,4 4626,3 -3467,9 703,0 3516,0 -2813,0 AMERICA 12664,1 5073,1 +7591,0 16275,1 5431,0 +10844,1 22127,4 7992,5 +14134,9 17022,2 6165,5 +10856,7 ASIA 1048,5 9983,7 -8935,2 857,0 12610,4 -11753,4 1502,6 15887,1 -14384,5 1136,0 12827,1 -11691,1 EUROPE 5679,2 5025,1 +654,1 5168,0 5060,5 +107,5 8918,6 7827,1 +1091,5 6588,6 5970,9 +617,7
OCEANIA 9,4 7,8 +1,6 8,9 7,4 +1,5 20,4 9,5 +10,9 12,9 8,2 +4,7
TOTAL 19919,3 22971,7 -3052,4 22741,4 26149,0 -3407,6 33727,4 36342,5 -2615,1 25462,7 28487,7 -3025,0 ROMÂNIA 347,7 181,5 +166,2 514,5 118,6 +395,9 805,1 157,5 +647,6 555,8 152,5 +403,3
* http://faostat.fao.org/site/535/DesktopDefault.aspx?PageID=535#ancor **own calculations
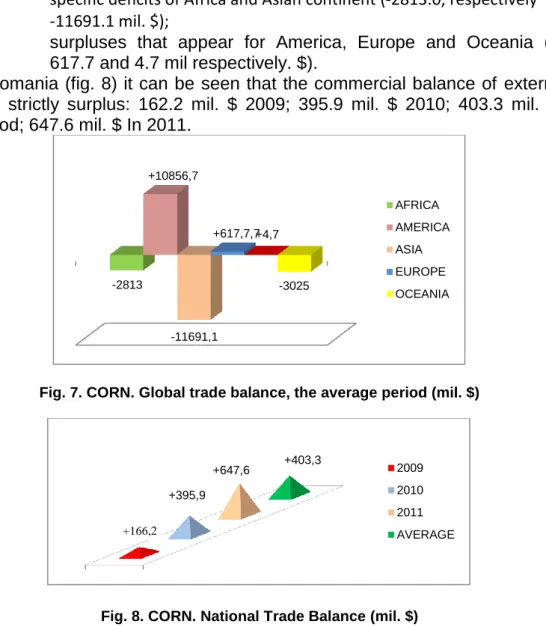
Based on specific sequential values of 2009, 2010 and 2011 was determined the average period that maintains the weak global balance: -3025.0 mil. $ (Fig. 7). Situation flawed balance of trade is determined by the following aspects:
0 50 100 150 200 250
2009 2010 2011
166
specific deficits of Africa and Asian continent (-2813.0, respectively
-11691.1 mil. $);
surpluses that appear for America, Europe and Oceania (10857.6, 617.7 and 4.7 mil respectively. $).
For Romania (fig. 8) it can be seen that the commercial balance of external trade, with corn, is strictly surplus: 162.2 mil. $ 2009; 395.9 mil. $ 2010; 403.3 mil. $ for the average period; 647.6 mil. $ In 2011.
Fig. 7. CORN. Global trade balance, the average period (mil. $)
Fig. 8. CORN. National Trade Balance (mil. $)
CONCLUSIONS For imports there is a series of conclusions, such as:
Asia dominates imports through a share of 46.02% (at quantitative) and 45.03% respectively (in terms of value);
upward trend in imports is strictly - worldwide, while continental units appear as irregular fluctuations (greater of the amounts imported) and upward;
Romania shows a downward trend of imports - both in quantity and value, positive considering previous observations.
Export situation highlights issues such as:
within a global structure of exports predominate America, Europe followed at a great distance, rest of the world accounting for significant shares - generally below 5.0% (both for export quantities and values collected after the export);
is worth a fairly large share of the American continent - 69.90 and 66.85%, and low weights Oceania (0.03 and 0.05%) and Africa (2.21 and 2.76%) - first values refer to quantitative structure indicator weights;
an the indicator has evolved upward - worldwide, in both cases (ie quantity values) with beneficial trends in the second case;
-2813
+10856,7
-11691,1
+617,7,7+4,7
-3025
AFRICA AMERICA ASIA EUROPE OCEANIA
+166,2
+395,9
167
a negative issues occur to Africa, Asia and Oceania where true indicator known "disasters" (in terms of actual levels recorded);
Romania is characterized by a quite significant levels of indicators - average weights of 1.90 and 2.18%. Evolution of exports, both in quantity and value, is a favorable one, talking even doubling the values in 2011 compared to term of reference.
Regarding the trade balance can draw the following considerations:
the strictly deficit balance is mostly determined by the specific situation of Asia (annual deficits 8935.2, 11753.4 and 14384.5 respectively mil. $), Even if it is compensated often of American surpluses (7591.0 , 10844.1 and 14134.9 respectively mil. $).
In this case Europe and Oceania cannot compensate African balance deficits;
is worth noting that during the dynamic series, Romania presents purely surplus 166.2, 395.9 and 647.6 respectively mil. $).
BIBLIOGRAPHY
1. Barbu C., Pânzaru RL, 2000, The Agrarian Economy, Hyperion Publishing House, Craiova;
2. Pânzaru RL, Medelete DM, Ştefan G., 2007, "Elements of management and marketing in agriculture", Universitaria Publishing House, Craiova.
3. Pânzaru RL, Medelete DM, Ştefan G., 2009, "The Economics of crop production", Universitaria Publishing House, Craiova.
4. Angela Popescu, 1997, "The integration of the product of grain baking" CIDF, Bucharest;
5. Timmer, PC, et al., 1986, "Analyse the alimentaire politique", Edition Economica, Paris, France