MJCCA9 – 768 ISSN 1857-5552 e-ISSN 1857-5625
Received: November 4, 2017 DOI: 10.20450/mjcce.2019.1333
Accepted: February 12, 2019 Original scientific paper
STRUCTURAL CHARACTERIZATION OF KAEMPFEROL:
A SPECTROSCOPIC AND COMPUTATIONAL STUDY
Dejan Milenković1*, Jasmina M. Dimitrić Marković2, Dušan Dimić2, Svetlana Jeremić3,
Dragan Amić4, Marijana Stanojević Pirković5, Zoran S. Marković3
1
Bioengineering Research and Development Center, 34000 Kragujevac, Republic of Serbia
2
Faculty of Physical Chemistry, University of Belgrade, Studentski trg 12–16, 11000 Belgrade, Republic of Serbia
3
Department of Chemical-Technological Sciences, State University of Novi Pazar, Vuka Karadžića bb, Novi Pazar, 36300, Republic of Serbia
4
Faculty of Agriculture, Josip Juraj Strossmayer University of Osijek, Kralja Petra Svačića 1D, 31000 Osijek, Republic of Croatia
5Faculty of Medical Sciences University of Kragujevac, Svetozara Markovića 69,
34000 Kragujevac, Serbia [email protected]
Calculations based on the density functional theory, with the B3LYP functional and the 6-311++G(d,p) basis set, were performed with the aim of confirming the molecular structure and spectro-scopic characteristics of kaempferol, a naturally occurring flavonoid molecule. The electronic structure of kaempferol was examined using NBO analysis. The assigning of the experimentally obtained IR and Ra-man spectra was performed after the best-fit-based comparison with theoretical spectra. The 13C and 1H
NMR experimental spectra were related to the theoretically obtained values of the chemical shifts deter-mined by the GIAO method. The correlation coefficient and the average absolute error values proved B3LYP-D3 to be an adequate method in describing the NMR parameters of kaempferol. Molecular dock-ing analysis was carried out in order to identify the potency of inhibition of the title molecule against hu-man procalcitonin. The inhibition activity was obtained for 10 conformations of ligand inside the protein.
Keywords: kaempferol; density functional theory; spectroscopic characterization; molecular docking
СТРУКТУРНА КАРАКТЕРИЗАЦИЈА НА КАМФЕРОЛ: СПЕКТРОСКОПСКИ И КОМПЈУТЕРСКИ ИСПИТУВАЊА
Извршени се пресметки базирани на теоријата на густина на функционалот со функционалот B3LYP и основниот сет 6-311++G(d,p) со цел да се потврдат молекулската структура и спектроскопските карактеристики на камферол, флавоноидна молекула од природно потекло. Електронската структура беше испитана со NBO анализа. Асигнацијата на експериментално добиените IR и рамански спектри беше извршена со најдобро усогласената споредба со теоретските спектри. Експерименталните спектри 13C и 1H NMR беа споредени со
теоретски добиените вредности на хемиските поместувања определени со методот GIAO. Коефициентот на корелација и просечните вредности на апсолутната грешка покажаа дека B3LYP-D3 е соодветен метод за опишување на NMR-параметрите на камферол. Анализата на припојување беше извршена со цел да се идентификува способноста за инхибиција на ова соединение со хуман прокалцитонин. Инхибициската активност беше добиена за 10 конформации на лигандот внатре во протеинот.
1. INTRODUCTION
Flavonoids, as natural polyphenolic com-pounds, are reported to exert a wide range of posi-tive health effects arising mainly from their antiox-idant ability. They represent an important group of phytochemicals with over 8000 individual com-pounds known. They have roles as antioxidants, antimicrobials, receptors and screening molecules for light, visual attractors and feeding repellents. Flavonoids are common in everyday human diet, as their presence indicates good-quality food, fla-vor identification, and taste thresholds influencing food preference [1, 2]. The fact that flavonoids are recognized as highly potent external defense com-ponents against oxidative stress in various stages, makes them some of the most widely investigated biochemically active molecules today [3].
Many studies on flavonoids have shown that they exhibit prominent therapeutic and pharmaco-logical activities, among which their antiallergenic, antiviral, anti-inflammatory and vasodilating prop-erties are particularly interesting. Most studies into antioxidant activity are related to their structural features: the carbon–carbon double bond in posi-tion 2, an OH group in posiposi-tion 3, OH groups pre-sent in the A and B rings, and AC–B ring coplanar-ity [4‒16]. However, it has been found that, under the specific conditions, some can exhibit pro-oxidant activity as well [12].
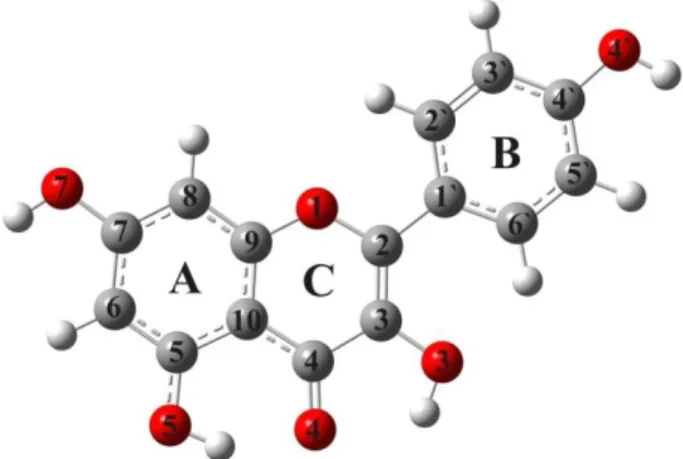
Kaempferol (3,5,7-trihydroxy-2-(4’-hydro-xyphenyl)-4H-chromen-4-one; Fig. 1) is a natural flavonoid that can be found mainly in vegetables (broccoli, cabbage, leek, beans, tomato), fruits (strawberries, grapes), tea, gingko, and in many medical herbs used in traditional medicine [3, 17]. Known as a strong antioxidant, kaempferol helps in the prevention of arteriosclerosis, inhibits the oxidation of low-density lipoproteins and lowers the aggregation of platelets in the blood. It reduces the risk of cancer development (including pancre-atic, lung and gastric cancer and ovarian cancer in women) by inhibiting angiogenesis in vitro and/or in vivo [3]. Kaempferol has proven its pharmaco-logical activity as good radical scavenger in pa-tients with diabetes, asthma and carcinogenesis [18]. It also inhibits enzymes such as cyclooxygen-ases (COXs), lipoxygencyclooxygen-ases (LOXs), and induces nitric oxide synthase (iNOS) known to be present during the process of inflammation [3].
Numerous authors characterize an investi-gated compound by comparing theoretical and ex-perimental results [19‒21]. The aim of this study is to contribute to the elucidation of the structure of kaempferol by using quantum chemical
calcula-tions at the B3LYP-D3 level of theory in conjunc-tion with different spectroscopic methods (IR, Ra-man and 1H and 13C NMR).
In addition, kaempferol is investigated for its reactivity toward human procalcitonin (PCT) pro-tein by means of molecular docking analysis. PCT (~13 kDa) is a peptide consisting of 116 amino acids. This protein is degraded enzymatically into lower-molecular-weight peptides. Calcitonin is the final product and consists of 32 amino acids. In the serum of healthy humans, all precursors can be detected, including PCT and the mature peptide hormone. In septic patients, the PCT in serum con-tains a peptide of only 114 amino, instead of the predicted PCT of 116 amino acids in healthy pa-tients [22]. The biological effect of this protein was proven in the study of Nylén et al., who showed that the elevated concentrations can lead to sepsis, but can be treated by anti-PCT antibodies [23].
Fig. 1. The optimized structure and numbering of kaempferol
2. EXPERIMENTAL SECTION
2.1. Materials
Kaempferol and potassium bromide (KBr, IR grade) were obtained from Aldrich. Both chem-icals were used without further purification.
2.2. IR, Raman and NMR spectra
Raman spectrum was recorded on a Thermo Scien-tific DXR Raman spectrometer. The excitation source was a high-brightness diode-pumped solid-state laser with wavelength 532 nm. The objective lens was set to the value of 50 ×. A spectrograph with a 900 lines mm–1 grating was used for analysis of the scattered light. The spectrum was obtained between 3400 and 400 cm−1 directly from the pure powder samples. The output of the laser was fixed at 10 mW with an acquisition time of 10 s with 10 scans. Fluorescence was corrected for, and data acquisition and processing was performed with Thermo Scientific OMNIC software.
The theoretical Raman intensities (𝐼𝑖𝑅) were derived based on the Raman scattering activities:
(1)
)
(
0 i 4 i1 i1 iR
i
C
B
S
I
The quantity Bi is a temperature factor that includes the contribution of the excited vibrational states, as predicted by the Boltzmann distribution:
1 exp
i ih c
B
kT
(2)where h, k, c and T are the Planck and Boltzmann constants, the speed of light and temperature, re-spectively. The wavenumber of the laser excitation line is υ0 (υ0 = 18 797 cm−1 corresponding to 532 nm), υi is the wavenumber of the normal mode (cm−1), while Si is the Raman scattering activity of the normal mode Qi. The calculated Raman inten-sity, 𝐼𝑖𝑅, is presented in arbitrary units (C is a
con-stant equal to 10−12). Because of the low contribu-tion of the excited vibracontribu-tional states, the value of Bi is assumed to be 1. Otherwise, as is reported in the literature, the calculated Raman intensities for the bands below 300 cm−1 were overestimated when compared to the experimental values [24].
NMR spectra, in DMSO-d6 with TMS as in-ternal standard, were determined on a Varian Gem-ini 200 MHz NMR spectrometer (1H at 200 MHz and 13C at 50 MHz).
3. THEORETICAL BACKGROUND
Optimization of the geometry of kaempferol was performed by using a B3LYP-D3 local density functional method and the 6-311++G (d, p) basis set, as implemented in the Gaussian 09 package [25‒28]. This functional has been successfully re-ported in the literature for similar compounds [29, 30]. B3LYP-D3 was selected as a method widely applied for the NMR chemical shifts of similar
molecules that has proved to predict the interatom-ic interactions at short and medium distances (≤5 Å) more accurately and reliably than traditional DFT methods. Hybrid GGA B3LYP-D3 included an empirical correction term proposed by Grimme [31, 32] and the stability of the obtained structure was verified to be the minimum on the potential energy surface. The calculated wavenumbers were scaled by a factor of 0.9873 in order to obtain a better match between the calculated and the exper-imental wavenumber values. For the prediction of IR and Raman spectra, the optimized gas-phase geometry was used. PED (Potential Energy Distri-bution) analysis using VEDA software was applied for estimation and assignation of the vibrational modes [33. 34]. The 1H and 13C chemical shifts were predicted by means of the GIAO (Gauge In-dependent Atomic Orbital) method, as implement-ed in Gaussian 09 with DMSO as solvent [35]. The NBO analysis was performed by using NBO 5.9 software [36, 37]. The polarizability and hyperpo-larizability tensors (αxx, αxy, αyy, αxz, αyz, αzz and βxxx, βxxy, βxyy, βyyy, βxxz, βxyz, βyyz, βxzz, βyzz, βzzz) can be obtained by a Gaussian frequency job out-put file. The molecular docking simulation was carried out using AutoDock 4.0 software [38]. The structure of human PCT was adapted from litera-ture data [39]. Discovery Studio 4.0 was used for the preparation of protein for docking by removing the crystallized ligand, water molecules and co-factors [40]. To calculate Kollman charges and to add polar hydrogen, the AutoDockTools (ADT) graphical user interface was applied. Kaempferol was prepared for docking by minimizing its energy at the previously mentioned level of theory. The flexibility of the ligands was considered, while the protein or biomolecules remained as rigid struc-tures in ADT. All kaempferol bonds were set to be rotatable. The Geistenger method for calculation of partial charges was employed. All calculations for protein–ligand flexible docking were performed using the Lamarckian Genetic Algorithm (LGA) method. A grid box with dimensions 92.007 Å 0.202 Å 0.111 Å of human PCT was used in order to cover the protein binding site and to ena-ble the ligands to move freely. Inhibition potency of kaempferol was investigated and discussed.
4. RESULTS AND DISCUSSION
4.1. Molecular geometry of kaempferol
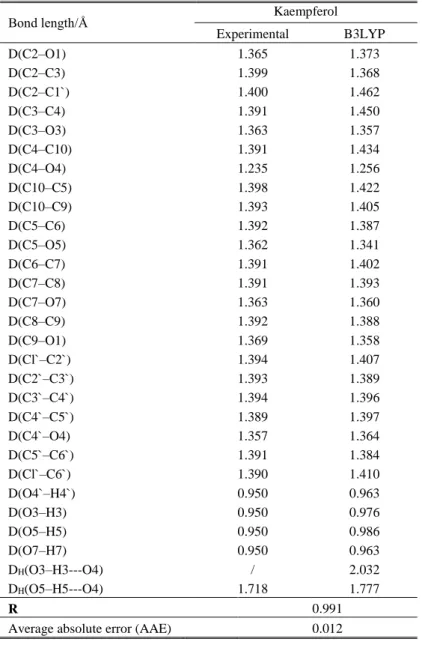
lack of X-ray crystallographic structural data of pure kaempferol (to the best of our knowledge) the DAPK1-kaempferol complex (PDB code: 5AUX) structure was used [41], with the isolated parame-ters for the molecule of interest. Because of the rigidity of the molecule, it is expected that the structural parameters in the complex do not change significantly [42]. The most stable conformation of kaempferol was taken from our previous work [43, 44]. The calculated and experimental bond lengths are listed in Table 1.
Table 1 shows that B3LYP-D3 reproduces excellently the bond lengths of kaempferol with a mean correlation coefficient (R) of 0.991 and an average absolute error (AAE) for bond length of 0.012 Å. The optimized and experimental bond angles are given in Table S1 in the Supporting In-formation. The theoretical data indicate that kaempferol is planar (τ(C3–C2–C1`–C2`) is 0.0) (Table S1). On the other hand, the experimentally determined dihedral angle between B and C rings amounts to 168.9º.
T a b l e 1
The bond lengths in the neutral molecule, optimized with
the B3LYP-D3/6-311++G(d,p) model (the atom numbering is in line with Figure 1). Experimental values are also included.
Bond length/Å Kaempferol
Experimental B3LYP
D(C2–O1) 1.365 1.373
D(C2–C3) 1.399 1.368
D(C2–C1`) 1.400 1.462
D(C3–C4) 1.391 1.450
D(C3–O3) 1.363 1.357
D(C4–C10) 1.391 1.434
D(C4–O4) 1.235 1.256
D(C10–C5) 1.398 1.422
D(C10–C9) 1.393 1.405
D(C5–C6) 1.392 1.387
D(C5–O5) 1.362 1.341
D(C6–C7) 1.391 1.402
D(C7–C8) 1.391 1.393
D(C7–O7) 1.363 1.360
D(C8–C9) 1.392 1.388
D(C9–O1) 1.369 1.358
D(Cl`–C2`) 1.394 1.407
D(C2`–C3`) 1.393 1.389
D(C3`–C4`) 1.394 1.396
D(C4`–C5`) 1.389 1.397
D(C4`–O4) 1.357 1.364
D(C5`–C6`) 1.391 1.384
D(Cl`–C6`) 1.390 1.410
D(O4`–H4`) 0.950 0.963
D(O3–H3) 0.950 0.976
D(O5–H5) 0.950 0.986
D(O7–H7) 0.950 0.963
DH(O3–H3---O4) / 2.032
DH(O5–H5---O4) 1.718 1.777
R 0.991
Average absolute error (AAE) 0.012
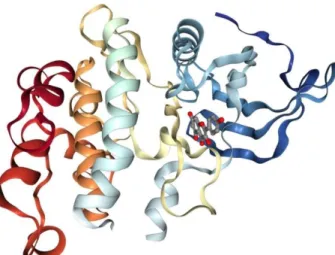
The deviation of the B ring from planarity is probably caused by the repulsion between H3 and H6` hydrogen atoms. If the known differences be-tween the vacuum and condensed-phase environ-ments are taken into the account, this discrepancy can be ascribed to the packing in the DAPK1– kaempferol complex (Fig. 2).
Fig. 2. Crystal structure of DAPK1–kaempferol complex (PDB code: 5AUX)
4.2. NBO analysis
The electronic structure of kaempferol was examined using NBO analysis. In order to evaluate the donor–acceptor interactions, analysis of the second-order Fock matrix was performed. The sta-bilization energy (E(2)) for each donor (i) and ac-ceptor (j) associated with the delocalization be-tween i and j is determined as:
2
(2)
(
ij)
ij i
j i
F
E
E
q
E
E
(3)where qi is the donor orbital occupancy, Ei, Ej are the diagonal elements (orbital energies) and Fi,j is the off-diagonal NBO Fock matrix element. The large E(2) value indicates the intensive interaction between the electron-donors and electron-acceptors and the greater extent of conjugation of the whole system. The possible intensive interactions are giv-en in Table 2.
The most important interaction (n-π*) ener-gy, related to resonance in the molecule, is electron donation from the LP2(O) atom orbitals to the
an-tibonding acceptor π*(C–C) of the phenyl ring (LP2(O5) → π*(C5–C6) (159.2 kJ mol–1)). This large interaction energy indicates hyperconjugation between the electron-donating oxygen atom and the phenyl ring. Also, the other oxygen lone elec-tron pairs show a significant elecelec-tron-donating ability to the antibonding acceptor π*(C–C) orbital of the phenyl ring. Besides LP2(O) → π*(C–C) and LP2(O) → σ*(C–C) interactions, strong intra-molecular hyperconjugative interactions are formed by orbital overlap between π(C–C) → π*(C–C) bond orbitals, resulting in intramolecular charge transfer (ICT), which causes stabilization of the system. These interactions lead to an increase in electron density (ED) in the C–C antibonding orbitals, which weakens their respective bonds. The EDs at the conjugated π(~1.63–1.76 e) and π* bonds (~0.3–0.4 e) of the phenyl and α-pyrone rings clearly demonstrate strong electron delocaliza-tion, leading to stabilization by ~43–144 kJ mol‑1
.
The kaempferol structure is characterized by two intramolecular hydrogen bonds (IHBs) which additionally stabilize the structure. The NBO anal-ysis revealed that the lone pair–antibonding orbital interactions between the carbonyl oxygen and the adjacent O–H bonds are responsible for the hydro-gen-bond formation. Since the O4(2p) and O4(1p) orbitals are abundant in electrons, while the O5– H5(σ*) orbital is electron-deficient, it was found that charge transfer from the O4(2p) to the O5– H5(σ*) orbital is a favorable donor–acceptor inter-action with stabilization energy of 57.61 kJ mol–1. This has a significant effect on the strength of the hydrogen-bond delocalization energy. Also, there is significantly weaker charge transfer from O4(1p) to O5–H5(σ*) (Table 2). These findings are in ac-cord with the IHB lengths, and the decrease in strength with bond elongation is proven (see Table 1). These are weaker interactions and the second-order interaction energies are proportional to the hydrogen-bond strengths.
T a b l e 2
Second-order perturbation theory analysis of the kaempferol Fock matrix
Donor (i) Acceptor (j) ED (i) ED (j) E
(2)
kJmol–1
Ei‒Ej
a.u.
Fi,j
a.u.
πC5-C6 π*C7-C8 1.69 0.40 116.9 0.28 0.08
πC5-C6 π*C9-C10 1.69 0.48 51.21 0.27 0.05
πC7-C8 π*C5-C6 1.66 0.36 53.09 0.28 0.05
πC7-C8 π*C9-C10 1.66 0.48 123.4 0.27 0.08
πC9-C10 π*C5-C6 1.63 0.36 102.8 0.29 0.08
πC9-C10 π*C7-C8 1.63 0.40 52.30 0.29 0.05
πC9-C10 π*O4-C4 1.63 0.41 143.8 0.26 0.09
πC2-C3 π*O4-C4 1.76 0.41 103.2 0.28 0.08
πC2-C3 π*C1`-C6` 1.76 0.40 43.30 0.32 0.05
πC1-C6` π*C2-C3 1.63 0.31 78.62 0.27 0.06
πC1-C6` π*C2`-C3` 1.63 0.30 90.00 0.28 0.07
πC1-C6` π*C4`-C5` 1.63 0.39 73.30 0.27 0.06
πC2`-C3` π*C1`-C6` 1.70 0.40 66.19 0.28 0.06
πC2`-C3` π*C4`-C5` 1.70 0.39 95.31 0.27 0.07
πC4`-C5` π*C1`-C6` 1.64 0.40 101.9 0.29 0.08
πC4`-C5` π*C2`-C3` 1.64 0.30 64.10 0.29 0.06
LP1 O7 σ*C6-C7 1.98 0.02 24.60 1.16 0.07
LP2 O7 π*C7-C8 1.86 0.40 123.9 0.35 0.10
LP1 O5 σ*C5-C10 1.98 0.03 26.90 1.09 0.08
LP2 O5 π*C5-C6 1.82 0.36 159.2 0.33 0.11
LP1 O4 σ*H5-O 1.97 0.31 11.56 1.20 0.05
LP2 O4 σ*H5-O5 1.87 0.04 57.61 0.69 0.09
LP2 O4 σ*H3-O3 1.87 0.02 14.31 0.69 0.05
LP2 O4 σ*C4-C10 1.87 0.05 55.19 0.78 0.09
LP2 O4 σ*C3-C4 1.87 0.06 69.50 0.74 0.10
LP2 O1 π*C9-C10 1.76 0.48 125.9 0.36 0.10
LP2 O1 π*C2-C3 1.76 0.31 114.9 0.37 0.09
LP2 O3 π*C2-C3 1.87 0.31 124.4 0.34 0.09
LP1 O4` σ*C4`-C5` 1.98 0.03 25.61 1.17 0.08
LP2 O4` π*C4`-C5` 1.87 0.39 119.6 0.35 0.10
4.3. Electrostatic potential and charge distribution
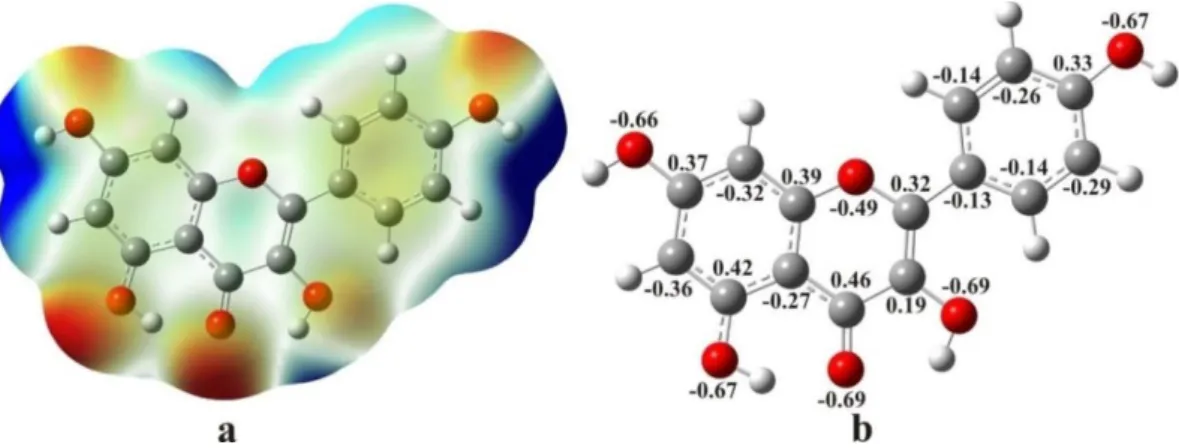
The charge distribution in molecules is usu-ally represented by a map of electrostatic potential (MEP). This is a useful feature to study reactive sites on the surface of the molecule, given that an approaching electrophile would be attracted to negative regions (electron-rich/red color) while the positive region (electron-poor/blue color) would be a preferred site for nucleophilic attack. MEP offers more intuitive way to understand the polarity of a molecule by correlating it with the molecular struc-ture and the physicochemical properties [45‒50]. The MEP of kaempferol is presented in Figure 3a.
The MEP in the case of the investigated molecule (Fig. 3a) clearly indicates that the chromene oxygen atom 4, as well as oxygen atoms 3, 5, 7 and 4, contribute to the most
electronega-tive regions (red). Due to the excess negaelectronega-tive charge, one can expect a relatively high nucleo-philic activity of this part of the molecule. This is in agreement with the fact that the negative regions of the MEP contain the electronegative atoms with the lone electron pairs. On the other hand, the posi-tive MEP values are localized over the hydrogen atoms bonded to oxygen atoms.
Fig. 3. Molecular electrostatic potential surface (left) and the natural charge distribution (right)
The C4 atom has greater positive charge than other C atoms in the chromene part of the molecule. In addition, the C5 atom has more posi-tive value than other atoms in the A and B rings. On the other hand, a slightly positive natural charge is distributed almost uniformly over the hydrogen atoms. The obtained results indicate that the H atoms bonded to O7 and O4 have more positive values than the other hydrogen atoms.
4.4. Nonlinear optical activity
The polarizabilities and the first-order hy-perpolarizabilities of kaempferol were calculated using the DFT/B3LYP-D3 method with the 6-311++G (d,p) basis set in order to investigate the relationship between molecular structure and non-linear optical properties (NLO). The calculated polarizability and the first hyperpolarizability (β) of kaempferol were based on the finite-field ap-proach. The total electric dipole moment (μ), mean polarizability (Δα) and the total first-order static hyperpolarizability (βtotal), were calculated using the x, y and z components of these electric mo-ments [51]. It is well known that higher values of dipole moment, molecular polarizability and first-order hyperpolarizability are important for the more pronounced NLO properties of a compound. The calculated total electric dipole moment (μ), mean polarizability (α) and total first-order static hyperpolarizability (βtotal) and their components are presented in Table S2. In the present case, the cal-culated total dipole moment of kaempferol is 1.78 D. The predicted value of the linear polariza-bility (αtot) and total first-order static hyperpolar-izability (βtotal) are found to be 33.539 × 10⁻²⁴ esu and 28.428 × 10⁻³⁰ esu, respectively. The calculat-ed value of βtotal of kaempferol is 150 times higher than that of urea (0.1947 × 10⁻³⁰ esu) [52], which is one of the prototypical molecules used in the study of the NLO properties of molecular systems and
the value frequently used as a threshold for com-parative purposes. Remarkably, the high polariza-bility of kaempferol shows its drug-likeliness as the high polarizability allows it to bind with its target very strongly.
4.5. Vibrational spectra of kaempferol
The experimentally obtained, theoretically calculated and scaled wavenumbers, with the as-signments for the first 65 vibrational modes (of 87) in the region 3700–400 cm–1, are presented in Table 3, together with the relative descriptions of IR and Raman intensities, PED values and the description of the largest vibrational contributions to the normal modes. The kaempferol geometry optimized in the gas phase served as the basis for calculation of the IR and Raman spectra using the B3LYP-D3/6–
311++G(d,p) model. The B3LYP-D3/6–
311++G(d,p)-calculated wavenumbers were correct-ed using a vibrational scaling factor value of 0.9873.
These calculated values are further dis-cussed. The scaling factor was determined by the least-squares method, on the basis of the experi-mental data for the IR spectrum.
T a b l e 3
Experimental and calculated positions of the bands in the IR and Raman spectra of kaempferol, with assignments and intensities of the normal modes
Mod Assignments
Exp. values B3LYP-D3/6-311++g(d,p)
IR cm–1
Raman cm–1
Unscaled freq. cm–1
Scaled freq. cm–1
IR intens.
Raman intens.
Raman scattering activities
PED (%)
87 OH stretching (A) 3832 3783 19 3 228 νOH (100)
86 OH stretching (B) 3830 3781 23 3 285 νOH(100)
85 OH stretching (C) 3619 3573 26 2 191 νOH(100)
84 OH stretching (A) 3420 vs 3383 3340 60 2 126 νOH(99)
83 CH stretching (B) 3206 s 3243 3202 1 0 30 νCH(99)
82 CH stretching (A) 3223 3182 0 1 71 νCH(100)
81 CH stretching (B) 3218 3177 0 1 57 νCH(91)
80 CH stretching (B) 3191 3151 1 2 129 νCH(91)
79 CH stretching (A) 3181 3140 1 3 192 νCH(100)
78 CH stretching (B) 3155 3115 4 3 165 νCH(99)
77
C=O stretching (C) C2=C3 stretching (C) CC stretching (A,C)
1660 vs 1685 1663 76 24 563 νCO(30) + νCC(20)
76 C=C stretching (B,C) 1642 m 1661 1640 13 8 191 νCC(63)
75
CC stretching (B,C) HCC bending (B) C=O stretching (C)
1647 1626 46 100 2276 νCC(50) + δHCC(11) + νCO(10)
74 C=O stretching (C)
CC stretching (A,C) 1612 vs 1604 vs 1631 1610 100 6 130 νCO(49) + νCC(12)
73 CC stretching (B) 1617 1596 0 0 5 νCC(63)
72
C2=C3stretching (C) CC stretching (A,C) C=O stretching (C)
1568 m 1561 m 1596 1576 26 35 762 νCC(50) + νCO(14)
71 HCC bending (B)
HOC bending (B,C) 1545 1526 20 7 137 δHCC(25) + δHOC(24)
70 CC stretching (A,C) 1509 s 1509 w 1530 1511 64 5 108
νCC(12) + δCCO(11) + δHOC(10) + δHCC(10) + δCCC(10)
69
CC stretching (A,C) HCC bending (A) HOC bending (A,C) C=O stretching (C)
1506 1487 38 5 92 νCC(40) + νCO(12)
68
CC stretching (A,C) COH bending (A) CCH bending (A) CO stretching (C)
1456 vw 1470 1452 15 15 293 νCC(28) + δHCC(20) + δHOC(17)
67
CC stretching (A,C) COH bending (A,C) CCH bending (A) CO stretching (C)
1440 vw 1422 w 1452 1434 7 13 243 νCC(10) + δHCC(10) + δHOC(10)
66
CC stretching (A) HOC bending (A,B,C) HCC bending (A,B)
1424 1405 13 9 174 νCC(40) + δHOC(14) + δHCC(10)
65
CC stretching (A,C) CO stretching (C) COH bending (A,C)
1382 s 1396 1378 28 3 49 νCO(17) + νCC(17) + δCCC(11)
64
CC stretching (A,C) CO stretching (A,C) COH bending (B) CCH bending (B)
1366 w 1376 1358 2 1 17 δHCC(48) + δHOC(12) + νCC(21)
63
CO stretching (A,C) HOC bending (A,C) HCC bending (A,B) CC stretching (A)
Table 3 continuation
62
CC stretching (A,C) CO stretching (A,C) COH bending (C,B)
1316 m 1343 1326 57 43 747 νCC(21) + δHOC(18) + νCO(10)
61
CO stretching (A,B,C) HOC bending (A,B,C) HCC bending (B) CCC bending (C,B)
1306 m 1316 w 1332 1315 10 0 7 νCC(40) + δHCC(19) + νCO(11)
60
CC stretching (B) CO stretching (A,C) HOC bending (B) HCC bending (B)
1275 vw 1277 w 1295 1278 27 4 71 νCO(35) + δHCC(17) + νCC(16)
59 CO stretching (A,C)
CC stretching (A) 1281 1264 32 1 22 νCO(25) + νCC(24)
58
CC stretching (A,C) CO stretching (A,C) HOC bending (A) HCC bending (A) COC bending (C)
1252 m 1259 1243 8 1 15
νCO(22) + δHCC(20) + δHOC(20)
57
HCC bending (A,B) CCC bending (A,B,C) HOC bending (C) CCO bending (C) COC bending (C)
1223 m 1222 w 1227 1211 32 0 3 νCO(37) + δHCC(10)
56
CO stretching (C) HOC bending (A,B,C) HCC bending (A,B)
1210 1195 18 17 263 δHCC(48) + νCO(24)
55
CCO bending (A,C) COH bending (A,C) HCC bending (A)
1185 m 1197 1182 9 2 29 νCO(25) + δHCC(14) + δHOC(13)
54 HOC bending (A,B)
HCC bending (B) 1189 1174 46 5 77 δHOC(40) + δHCC(30)
53 COH bending (A)
CCH bending (A) 1177 vs 1176 1161 74 2 24 δHCC(25) + δHOC(23)
52 CCH bending (A,B)
COH bending (C,B) 1152 1137 3 1 11
νCO(38) + δHOC(16) + δHCC(15)
51 COH bending (A,B,C)
CCH bending (A,B) 1129 vw 1117
vw 1138 1123 9 1 9
νCO(20) +
δHCC(13) + δHOC(11) + δCCC(10)
50
CCH bending (A,B) COH bending (A,C) COC bending (C) CCC bending (A,B,C)
1090 w 1090
vw 1103 1089 4 1 16
νCO(30) +
δHCC(14) + δHOC(10) + δCCC(10)
49 HCC bending (A,B)
CCC bending (B) 1030 1017 2 1 7 δHCC(43) + δCCC(42)
48 CCH bending (A)
COH bending (A,C) 1008 w
1008
vw 1023 1010 4 0 5 νCO(45) + δHCC(42)
47 CCH bending (A)
COH bending (A,C) 974 w 976 vw 991 978 6 4 50
νCO(40) + δHCC(15) + δCCC(11)
46 HCCC torsion (B) 985 972 0 0 0 HCCC(90)
45 HCCC torsion (B) 965 953 0 0 0 HCCC(90)
44
CCC bending (A,B,C) CCO bending (A,C) COH bending (A,B,C) CCH bending (A,B)
882 vw 892 881 3 0 3
δHCC(14) + δCCC(14) + δCOC(11) + δCCO(11) + δHOC(10)
43 HCCC torsion (B) 850 839 9 0 0 HCCC(90)
42
CCO bending (A,B,C) COH bending (B) CCC bending (B) CCH bending (A,B)
828 vw 834 823 3 8 77 νCO(24) + δCCC(20)
+ δCCO(18)
41 HCCC torsion (A)
HOCC torsion (A) 826 816 0 0 0 HCCC(50) + HOCC(40)
40 HCCC torsion (A,B) 820 809 0 0 0 HCCC(93)
39 HCCC torsion (A,B)
HOCC torsion (A) 818 808 7 0 0 HCCC(45) + HOCC(37)
Table 3 continuation
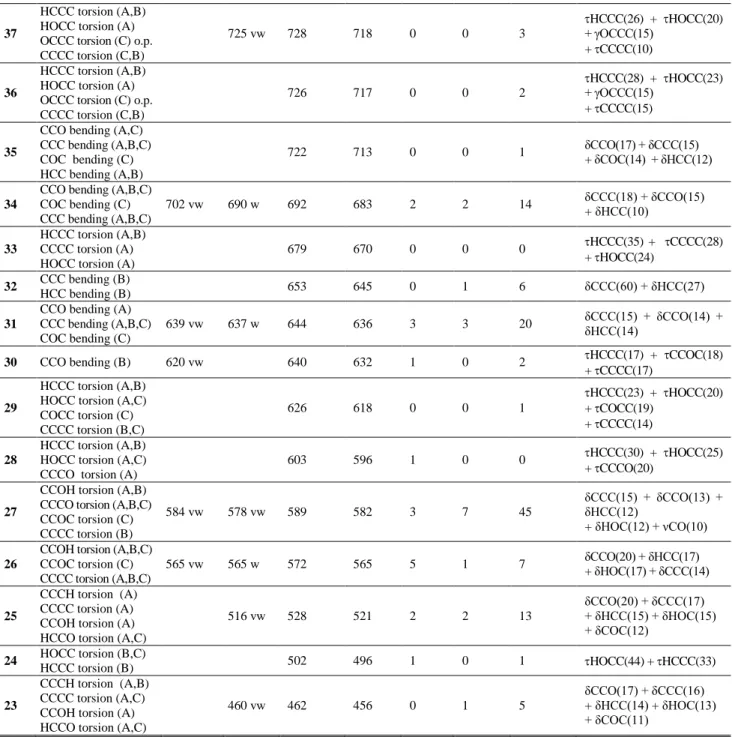
37
HCCC torsion (A,B) HOCC torsion (A) OCCC torsion (C) o.p. CCCC torsion (C,B)
725 vw 728 718 0 0 3
HCCC(26) + HOCC(20) + γOCCC(15)
+ CCCC(10)
36
HCCC torsion (A,B) HOCC torsion (A) OCCC torsion (C) o.p. CCCC torsion (C,B)
726 717 0 0 2
HCCC(28) + HOCC(23) + γOCCC(15)
+ CCCC(15)
35
CCO bending (A,C) CCC bending (A,B,C) COC bending (C) HCC bending (A,B)
722 713 0 0 1 δCCO(17) + δCCC(15)
+ δCOC(14) + δHCC(12)
34
CCO bending (A,B,C) COC bending (C) CCC bending (A,B,C)
702 vw 690 w 692 683 2 2 14 δCCC(18) + δCCO(15)
+ δHCC(10)
33
HCCC torsion (A,B) CCCC torsion (A) HOCC torsion (A)
679 670 0 0 0 HCCC(35) + CCCC(28)
+ HOCC(24)
32 CCC bending (B)
HCC bending (B) 653 645 0 1 6 δCCC(60) + δHCC(27)
31
CCO bending (A) CCC bending (A,B,C) COC bending (C)
639 vw 637 w 644 636 3 3 20 δCCC(15) + δCCO(14) + δHCC(14)
30 CCO bending (B) 620 vw 640 632 1 0 2 HCCC(17) + CCOC(18)
+ CCCC(17)
29
HCCC torsion (A,B) HOCC torsion (A,C) COCC torsion (C) CCCC torsion (B,C)
626 618 0 0 1
HCCC(23) + HOCC(20) + COCC(19)
+ CCCC(14)
28
HCCC torsion (A,B) HOCC torsion (A,C) CCCO torsion (A)
603 596 1 0 0 HCCC(30) + HOCC(25)
+ CCCO(20)
27
CCOH torsion (A,B) CCCO torsion (A,B,C) CCOC torsion (C) CCCC torsion (B)
584 vw 578 vw 589 582 3 7 45
δCCC(15) + δCCO(13) + δHCC(12)
+ δHOC(12) + νCO(10)
26
CCOH torsion (A,B,C) CCOC torsion (C) CCCC torsion (A,B,C)
565 vw 565 w 572 565 5 1 7 δCCO(20) + δHCC(17)
+ δHOC(17) + δCCC(14)
25
CCCH torsion (A) CCCC torsion (A) CCOH torsion (A) HCCO torsion (A,C)
516 vw 528 521 2 2 13
δCCO(20) + δCCC(17) + δHCC(15) + δHOC(15) + δCOC(12)
24 HOCC torsion (B,C)
HCCC torsion (B) 502 496 1 0 1 HOCC(44) + HCCC(33)
23
CCCH torsion (A,B) CCCC torsion (A,C) CCOH torsion (A) HCCO torsion (A,C)
460 vw 462 456 0 1 5
δCCO(17) + δCCC(16) + δHCC(14) + δHOC(13) + δCOC(11)
The high-frequency region is characteristic of C–H stretching modes of the A and B rings as well. In the 4000–3000 cm−1 Raman region (Figure S2) there are no bands easily assignable to the O–H and C–H stretching modes. The vibrational contri-butions to the normal modes (PED values in Table 3) in the 3780–3115 cm−1 region are assigned solely to the O–H and C–H stretching modes themselves (91–100%). The remaining modes are presented as combinations of the various contributions.
The majority of the medium-to-strong-intensity bands in both IR and Raman spectra of kaempferol are to be found in the 1800–1500 cm–1 region (Figs. 4 and 5, Table 3). This region
in-volves combinations of the C=O stretching (1660(IR), 1612(IR) and 1604(R) cm–1; modes ν77 and ν74), C2=C3 stretching (1660(IR) and 1568 (IR) cm–1 and 1561(R) cm–1; modes ν77 and ν72) and C–C stretching (1660(IR),1612(IR), 1568(IR), 1509(IR) cm–1, 1642(R), 1604(R), 561(R) and 1509(R) cm–1; modes ν77, ν74, ν72 and ν70) modes.
ν57, and ν53, respectively) (Figs. 4 and 5, Table 3). The low- (and very low-) intensity bands observed at 1456(IR), 1440(IR), 1442(R), 1366(IR), 1316(R), 1275(IR), 1277(R), 1222(R), 1129(IR), 1117(R), 1090(IR, R) and 1008(IR, R), cm–1 (modes ν68, ν67, ν64, ν 61, ν60, ν57, ν51, ν50 and ν48) are also assigned to the differ-ent stretching (C–C, O–C) and bending (C–C–H, C–O–H, C–C–O, C–C–C) modes of the rings.
Fig. 4. The 1800–400 cm−1 IR regions of the experimental and theoretical spectra of kaempferol
Fig. 5. The 1800–400 cm−1 Raman regions of the experimental and theoretical spectra of kaempferol
The linear relationship between the experi-mental and calculated wavelengths was proven from the data presented in Table 3. Three de-scriptors: the correlation coefficient (R), the aver-age absolute error (AAE), and the averaver-age relative error (ARE), were used to examine the quality of the linear correlation. The R values for the IR and Raman spectra are 0.9999 and 0.9997. The AAE and ARE values for the IR spectrum are 11 cm−1 and 1.0%, while for the Raman spectrum these val-ues are 7 cm−1 and 0.7%. According to the obtained results, the B3LYP-D3 functional can be considered
as giving very good agreement between the experi-mentally and theoretically obtained spectra.
4.6. NMR spectra of kaempferol
The 13C and 1H NMR spectra of kaempferol were measured in DMSO and used to confirm the structure of the molecule. The experimental results were compared to the theoretical values deter-mined by the GIAO method. The scaling factor of 0.932 (1H NMR) was determined by the least-squares method. The experimental and theoretical positions of the peaks in the 13C NMR and 1H NMR spectra are given in Tables 4 and 5. The cor-responding spectra are presented in Figures S3 and S4 (the atom numbering is in line with the designa-tion in Fig. 1).
T a b l e 4
Calculated and experimental 13C NMR chemical shifts of the selected carbons
13C NMR Experimental Calculated
C(2) 147.0 146.2
C(3) 135.8 135.1
C(4) 176.0 175.1
C(5) 160.9 160.0
C(6) 103.2 102.7
C(7) 164.1 163.3
C(8) 93.7 93.2
C(9) 156.4 155.6
C(10) 98.4 97.9
C(1`) 121.8 121.2
C(2`) 129.6 129.0
C(3`) 115.6 115.0
C(4`') 159.3 158.5
C(5`) 115.6 115.0
C(6`) 129.6 129.0
Average absolute
error (AAE) 0.68
R 0.999
T a b l e 5
Calculated and experimental 1H NMR chemical shifts of the protons bonded to carbons
1H NMR Experimental Calculated
C(6)H 6.19 6.21
C(8)H 6.44 6.35
C(2`)H 8.09 8.37
C(3`)H 6.92 6.80
C(5`)H 6.92 6.93
C(6`)H 8.09 7.96
Average absolute
error (AAE) 0.11
The chemical shifts obtained experimentally are in the perfect agreement with the available lit-erature data (R = 1.0000) [42, 53]. The calculated and experimental chemical shift values given in Tables 4 and 5 show good correspondence. The correlation coefficients in Tables 4 and 5 are mod-erately large, while the AAEs are relatively small. According to the values of R and AAE, B3LYP-D3 shows a reasonable ability to describe the NMR parameters of kaempferol.
4.7. Molecular docking studies
To evaluate the inhibitory nature of kaempferol against human PCT, a molecular dock-ing investigation was performed. Protein–ligand binding energy and identification of the potential ligand binding sites were also determined from this study. The ligand conformation that showed the lowest binding energy (best position) was deter-mined based on the ligand docking results. The position and orientation of ligand inside the protein receptor and the interactions with amino acids, which are bound to the ligand, were analyzed and
visualized with Discovery Studio 4.0 and Auto-DockTools.
Table S3 gives the values of the estimated free energy of binding and inhibition constants (Ki), for the investigated ligand in 10 different con-formations. Lower values of Ki indicate better in-hibition. The lowest values of ΔGbind and Ki are found for conformation 1 (Table S3). Based on analysis of the relative positions of the ligand and the active amino acids, it can be concluded that the ligand binds to the catalytic site of the substrate by weak non-covalent interactions. The most promi-nent are H-bonds and alkyl–π interactions. ASP in position 53 in the primary structure of the PCT chain has a predominant role as the active site of human PCT regarding its inhibition action. This result stands regardless of the conformation of the investigated ligand (Fig. 6). ASP53 forms one H-bond (2.27 Å length) with an O-H group of the ligand (Fig. 6). PRO55, ARG56 and LEU52 form weak alkyl–π interactions with the benzene and chromene rings of the ligand (Fig. 6).
Fig. 6. Interactions between ligand (conformation 1, the lowest Ki) and amino acids in procalcitonin
5. CONCLUSIONS
The results of the application of the B3LYP-D3/6-311++G(d,p) density functional method in determination of the spectroscopic and electronic features of kaempferol point to a planar molecule, characterized by the facilitated electron delocaliza-tion between the B and C rings. Three IR and Ra-man spectra descriptors (the correlation coefficient R, the average absolute error AAE, and the average relative error ARE) demonstrate that B3LYP-D3
procalci-tonin protein, as evidenced by the binding energy value (ΔGbind = –2.68 kcal mol–1). The most im-portant interactions are H-bonds and alkyl–π inter-actions. These preliminary results suggest that kaempferol might exhibit significant inhibitory activity against PCT.
Acknowledgements. The authors acknowledge
finan-cial support by the Ministry of Education, Science and Tech-nological Development of the Republic of Serbia (Grants No. 172015 and 172040). The authors thank Prof. Jamróz MH for the VEDA 4 software.
REFERENCES
[1] V. Cody, E. Middleton, J. B. Harborne, Plant flavonoids in biology and medicine. Biochemical, pharmacological, and structure-activity relationships. Proceedings of a symposium, Buffalo, New York, July 22–26, 1985,
Prog. Clin. Biol. Res.213, 1‒592 (1986).
[2] C. Rice-Evans, Flavonoid antioxidants, Curr. Med. Chem.8, 797‒807 (2001).
DOI:10.2174/0929867013373011
[3] J. M. Calderón-Montaño, E. Burgos-Morón, C. Pérez-Guerrero, M. López-Lázaro, A review on the dietary flavonoid kaempferol, Mini Rev. Med. Chem.11, 298‒ 344 (2011). DOI:10.2174/138955711795305335. [4] S. V. Jovanovic, S. Steenken, M. Tosic, B. Marjanovic,
M. G. Simic, Flavonoids as antioxidants, J. Am. Chem. Soc.116, 4846‒4851 (1994).
DOI:10.1021/ja00090a032.
[5] P. G. Pietta, Flavonoids as antioxidants, J. Nat. Prod.
63, 1035‒1042 (2000). DOI:10.1021/np9904509. [6] A. Marfak, P. Trouillas, D. P. Allais, Y. Champavier, C.
A. Calliste, J. L. Duroux, Radiolysis of kaempferol in water/methanol mixtures. Evaluation of antioxidant ac-tivity of kaempferol and products formed, J. Agric. Food Chem.51, 1270‒1277 (2003). DOI:10.1021/jf020836g. [7] T. Walle, Absorption and metabolism of flavonoids,
Free Rad. Biol. Med.36, 829‒837 (2004). DOI:10.1016/j.freeradbiomed.2004.01.002.
[8] R. J. Williams, J. P. E. Spencer, C. Rice-Evans, Flavo-noids: antioxidants or signalling molecules? Free Rad. Biol. Med.36, 838‒849 (2004).
DOI:10.1016/j.freeradbiomed.2004.01.001.
[9] C. G. Fraga, M. Galleano, S. V. Verstraeten, P. I. Oteiza, Basic biochemical mechanisms behind the health bene-fits of polyphenols, Mol. Aspects Med. 31, 435‒445 (2010). DOI:10.1016/j.mam.2010.09.006.
[10] R. M. Han, J. P. Zhang, L. H. Skibsted, Reaction dy-namics of flavonoids and carotenoids as antioxidants,
Molecules17, 2140‒2160 (2012). DOI:10.3390/molecules17022140.
[11] D. Pal, P. Verma, Flavonoids: a powerful and abundant source of antioxidants, Int. J. Pharm. Pharm. Sci.5, 95‒ 98 (2013).
[12] D. Procházková, I. Boušová, N. Wilhelmová, Antioxi-dant and prooxiAntioxi-dant properties of flavonoids, Fitotera-pia82, 513‒523 (2011).
DOI:10.1016/j.fitote.2011.01.018.
[13] J. B. Harborne, H. Baxter, The Handbook of Natural Fla-vonoids, John Wiley & Sons, Chichester, New York, 1999.
[14] J. Heilmann, I. Merfort, M. Weiss, Radical scavenger activity of different 3',4'-dihydroxyflavonols and 1,5-dicaffeoylquinic acid studied by inhibition of chemilu-minescence, Planta Med.61, 435‒438 (1995).
DOI:10.1055/s-2006-958131.
[15] A. Galano, G. Mazzone, R. Alvarez-Diduk, T. Marino, J. R. Alvarez-IdaboyR, N. Russo, Food antioxidants: chemical insights at the molecular level, Annu. Rev. Food Sci. Technol.7, 335‒352 (2016).
DOI:10.1146/annurev-food-041715-033206.
[16] M. Leopoldini, N. Russo, M. Toscano, The molecular basis of working mechanism of natural polyphenolic an-tioxidants, Food Chem.125, 288‒306 (2011).
DOI:10.1016/j.foodchem.2010.08.012.
[17] Ø. M. Andersen, K. R. Markham, Flavonoids: Chemis-try, Biochemistry and Applications, Taylor and Francis, Boca Raton, New York, 2006.
[18] P. Rajendran, T. Rengarajan, N. Nandakumar, R. Pal-aniswami, Y. Nishigaki, I. Nishigaki, Kaempferol, a po-tential cytostatic and cure for inflammatory disorders,
Eur. J. Med. Chem.86, 103‒112 (2014). DOI:10.1016/j.ejmech.2014.08.011.
[19] U. Çoruh, R. Ustabaş, H. Türker Akçay, E. Menteşe, E. M. Vazquez Lopez, Experimental and theoretical studies of 4-[(4-methyl-5-phenyl-4H1,2,4-triazol-3-zl)sulfanyl] benzene-1,2-dicarbonitrile, Maced. J. Chem. Chem. Eng.
35, 165–177 (2016).
DOI:10.20450/mjcce.2016.836.
[20] M. A. Al-Alshaikh, S. Muthu, E. S. Al-Abdullah, E. E. Porchelvi, S. Lahsasni, A. A. El-Emam, Structural and spectroscopic characterization of N′-[(1E )-(4-fluorophenyl)methylidene]thiophene-2-carbohydrayide,
Maced. J. Chem. Chem. Eng. 35, 63–77 (2016). DOI:10.20450/mjcce.2016.811.
[21] R. Álvarez-Diduk, M. T. Ramírez-Silva, A. Galano, A. Merkoçi, Deprotonation mechanism and acidity con-stants in aqueous solution of flavonols: a combined ex-perimental and theoretical study, J. Phys. Chem. B117, 12347‒12359 (2013). DOI:10.1021/jp4049617.
[22] W. Weglöhner, J. Struck, C. Fischer-Schulz, N. G. Mor-genthaler, A. Otto, C. Bohuon, A. Bergmann, Isolation and characterization of serum procalcitonin from pa-tients with sepsis, Peptides22, 2099‒2103 (2001). [23] E. S. Nylén, R. H. Snider Jr, K. A. Thompson, P.
Rohat-gi, K. L. Becker, Pneumonitis-associated hyperprocalci-toninemia, Am. J. Med. Sci.312, 12‒18 (1996). DOI:10.1016/S0002-9629(15)41740-9.
[24] R. Wysokiński, K. Hernik, R. Szostak, D. Michalska, Electronic structure and vibrational spectra of cis -diammine(orotato)platinum(II), a potential cisplatin ana-logue: DFT and experimental study, Chem Phys., 333:37‒48, 2007.
[25] A. D. Becke, Density-functional exchange-energy ap-proximation with correct asymptotic behavior, Phys. Rev. A38, 3098‒3100 (1988).
DOI:10.1103/PhysRevA.38.3098.
[26] A. D. Becke, Density‐functional thermochemistry. III. The role of exact exchange, J. Chem. Phys. 98, 648‒ 5652 (1993). DOI:10.1063/1.464913.
[27] A. D. Becke, E. R. Johnson, A density-functional model of the dispersion interaction, J. Chem. Phys. 123, 154101‒154103 (2005). DOI:10.1063/1.2065267. [28] M. J. Frisch, G. W. Trucks, H. B. Schlegel, G. E.
Barone, B. Mennucci, G. A. Petersson, H. Nakatsuji, M. Caricato, X. Li, H. P. Hratchian, A. F. Izmaylov, J. Bloino, G. Zheng, J. L. Sonnenberg, M. Hada, M. Ehara, K. Toyota, R. Fukuda, J. Hasegawa, M. Ishida, T. Nakajima, Y. Honda, O. Kitao, H. Nakai, T. Vreven, J. A. Montgomery, Jr., J. E. Peralta, F. Ogliaro, M. Bearpark, J. J. Heyd, E. Brothers, K. N. Kudin, V. N. Staroverov, T. Keith, R. Kobayashi, J. Normand, K. Raghavachari, A. Rendell, J. C. Burant, S. S. Iyengar, J. Tomasi, M. Cossi, N. Rega, J. M. Millam, M. Klene, J. E. Knox, J. B. Cross, V. Bakken, C. Adamo, J. Jaramil-lo, R. Gomperts, R. E. Stratmann, O. Yazyev, A. J. Aus-tin, R. Cammi, C. Pomelli, J. W. Ochterski, R. L. Mar-tin, K. Morokuma, V. G. Zakrzewski, G. A. Voth, P. Salvador, J. J. Dannenberg, S. Dapprich, A. D. Daniels, O. Farkas, J. B. Foresman, J. V. Ortiz, J. Cioslowski, and D. J. Fox, Gaussian 09, Revision D.01 Gaussian, Inc.: Wallingford, CT, 2010.
[29] M. Sardo, R. Siegel, S. M. Santos, J. Rocha, J. R. B. Gomes, L. Mafra, Combining multinuclear high-resolution solid-state MAS NMR and computational methods for resonance assignment of glutathione tripep-tide, J. Phys. Chem. A116, 6711‒6719 (2012). DOI:10.1021/jp302128r.
[30] P. Ivanov, Performance of some DFT functionals with dispersion on modeling of the translational isomers of a solvent-switchable [2]rotaxane, J. Mol. Struct.1107, 31‒ 38 (2016). DOI:10.1016/j.molstruc.2015.11.015. [31] S. Grimme, S. Ehrlich, L. Goerigk, Effect of the
damp-ing function in dispersion corrected density functional theory, J. Comp. Chem.32, 1456‒1465 (2011).
DOI:10.1002/jcc.21759.
[32] S. Grimme, J. Antony, S. Ehrlich, H. Krieg, A consistent and accurate ab initio parametrization of density func-tional dispersion correction (DFT-D) for the 94 elements H-Pu, J. Chem. Phys. 132, 154104‒154107 (2010). DOI:10.1063/1.3382344.
[33] R. A. Munos, Y. N. Panchenko, G. S. Koptev, N. F Ste-panov, Program for calculating distribution of potential energy in internal coordinates, J. Appl. Spectrosc. 12, 428‒429 (1970).
[34] M. H. Jamróz, Vibrational energy distribution analysis
VEDA 4, Warsaw, 2004.
[35] K. Wolinski, J. F. Hinton, P. Pulay, Efficient implemen-tation of the gauge-independent atomic orbital method for NMR chemical shift calculations, J. Am. Chem. Soc.
112, 8251‒8260 (1990). DOI:10.1021/ja00179a005. [36] J. E. Carpenter, F. Weinhold, Analysis of the geometry
of the hydroxymethyl radical by the “different hybrids for different spins” natural bond orbital procedure, J. Mol. Struct. THEOCHEM 169, 41‒62 (1988).
[37] A. E. Reed, L. A. Curtiss, F. Weinhold, Intermolecular interactions from a natural bond orbital, donor-acceptor viewpoint, Chem. Rev.88, 899‒926 (1988).
DOI:10.1021/cr00088a005.
[38] G. M. Morris, R. Huey, W. Lindstrom, M. F. Sanner, R. K. Belew, D. S. Goodsell, A.J. Olson, AutoDock4 and AutoDockTools4: Automated docking with selective re-ceptor flexibility, J. Comput. Chem. 30, 2785‒2791 (2009). DOI:10.1002/jcc.21256.
[39] J. M. Le Moullec, A. Jullienne, J. Chenais, F. Lasmoles, J. M. Guliana, G. Milhaud, M. S. Moukhtar, The complete
sequence of human preprocalcitonin, FEBS Lett.167, 93– 97 (1984). DOI:10.1016/0014-5793(84)80839-X. [40] BIOVIA Discovery Studio v4.0, Accelrys Software, Inc.,
San Diego, 2016.
[41] T. Yokoyama, Y. Kosaka, M. Mizuguchi, Structural insight into the interactions between death-associated protein kinase 1 and natural flavonoids, J. Med. Chem. 58, 7400‒7408 (2015).
DOI:10.1021/acs.jmedchem.5b00893.
[42] R. Zieliński, H. Szymusiak, Application of DFT B3LYP/GIAO and B3LYP/CSGT methods for interpre-tation of NMR spectra of flavonoids, Pol. J. Food Nutr. Sci.12, 157‒162 (2003).
[43] J. M. Dimitrić Marković, D. Amić, B. Lučić, Z. S. Mar-ković, Oxidation of kaempferol and its iron(III) complex by DPPH radicals: spectroscopic and theoretical study,
Monatsh. Chem.145, 557‒563 (2014). DOI:10.1007/s00706-013-1135-z.
[44] J. M. Dimitrić Marković, D. Milenković, D. Amić, A. Popović-Bijelić, M. Mojović, I. A. Pašti, Z. S. Mar-ković, Energy requirements of the reactions of kaempferol and selected radical species in different me-dia: towards the prediction of the possible radical scav-enging mechanisms, Struct. Chem. 25, 1795‒1804 (2014). DOI:10.1007/s11224-014-0453-z.
[45] J. S. Murray, K. D. Sen, Molecular Electrostatic Poten-tials : Concepts and Applications, Elsevier, Amsterdam, 1996.
[46] I. Alkorta, J. J. Perez, Molecular polarization potential maps of the nucleic acid bases, Int. J. Quantum Chem.
57, 123‒135 (1996). DOI:10.1002/(sici)1097-461x(1996)57:1<123::aid-qua14>3.0.co;2-9.
[47] E. Scrocco, J. Tomasi, Electronic molecular structure, reactivity and intermolecular forces: A heuristic inter-pretation by means of electrostatic molecular potentials,
Adv. Quantum Chem.11, 116‒193 (1978).
[48] F. J. Luque, M. Orozco, P. K. Bhadane, S. R. Gadre, SCRF calculation of the effect of water on the topology of the molecular electrostatic potential, J. Phys. Chem.
97, 9380‒9384 (1993). DOI:10.1021/j100139a021. [49] J. Šponer, P. Hobza, DNA base amino groups and their
role in molecular interactions: Ab initio and preliminary density functional theory calculations, Int. J. Quantum Chem. 57, 959‒970 (1996). DOI:10.1002/(SICI)1097-461X(1996)57:5<959::AID-QUA16>3.0.CO;2-S. [50] S. R. Gadre, I. H. Shrivastava, Shapes and sizes of
mo-lecular anions via topographical analysis of electrostatic potential, J. Chem. Phys. 94, 4384‒4390 (1991). DOI:10.1063/1.460625.
[51] D. M. Burl, R. D. Miller, C. A. Walsh, Second-order nonlinearity in poled-polymer systems, Chem. Rev.94, 31‒75 (1994). DOI:10.1021/cr00025a002.
[52] C. Adant, M. Dupuis, J. L. Bredas, Ab initio study of the nonlinear optical properties of urea: Electron correlation and dispersion effects, Int. J. Quantum Chem.56, 497‒ 507 (1995). DOI:10.1002/qua.560560853.