SIMPLE AND EFFICIENT METHOD FOR DETECTION OF TRACES OF RARE EARTH ELEMENTS IN MINERALS BY RAMAN SPECTROSCOPY
INSTRUMENTATION
Petre Makreski1, Gligor Jovanovski1,2*, Tomče Runčevski1, Radojko Jaćimović3
1Institute of Chemistry, Faculty of Science, Ss. Cyril and Methodius University,
Arhimedova 5, 1000 Skopje, Republic of Macedonia
2Macedonian Academy of Sciences and Arts, Bul. Krste Misirkov 2, P.O. Box 428,
1000 Skopje, Republic of Macedonia
3Jožef Stefan Institute, Jamova 39, P.O. Box 3000, SI-1001 Ljubljana, Slovenia
*e-mail: [email protected]
As an effort to increase the knowledge about the abundance, distribution and geochemical behavior of the rare earth elements (REEs), a simple and effective Raman spectroscopic method for detection of REEs in minerals is proposed. The proposed method based on Raman spectroscopy provides a lower detection limit for REEs compared to the modern analytical techniques. It could be practiced even in laboratories equipped only with FT-Raman instrumentation. This simple, inexpensive, rapid and straightforward Raman method for REEs detection in minerals is a convenient experiment for undergraduate and postgraduate laboratory courses.
Keywords: education; Raman spectroscopy; minerals; rare-earth elements
ЕДНОСТАВЕН И ЕФИКАСЕН МЕТОД ЗА ОПРЕДЕЛУВАЊЕ ТРАГИ НА ЕЛЕМЕНТИ ОД РЕТКИТЕ ЗЕМЈИ ВО МИНЕРАЛИ СО ПОМОШ НА РАМАНСКА СПЕКТРОСКОПИЈА
За да се збогатат знаењата за изобилството, распределбата и геохемиското однесување на елементите од ретките земји, предложен е едноставен и ефикасен метод за детекција на овие елементи во минерали со помош на раманска спектроскопија. Спореден со модерните аналитички техники, предложениот метод заснован на раманската спектроскопија овозможува пониска долна граница на детекција на елементите од ретките земји. Тој може да се применува дури и во лаборатории опремени само со FT-рамански инструмент. Овој едноставен, евтин, брз и еднозначен рамански метод за детекција на овие елементи во минерали е погоден експеримент за лабораториски вежби.
Клучни зборови: образование; раманска спектроскопија; минерали; елементи од ретки земји Received: June 24, 2011
Accepted: September 20, 2011
UDC: 549.091.5:543.424.2
1. INTRODUCTION
Due to their similar geochemical proper-ties and origin in the same deposits, the fifteen lanthanides of the periodic table, accompanied by scandium and yttrium, are classified as the rare earth elements (REEs) or rare earth metals (REMs) [1]. Although these elements play im-portant roles in inorganic and general chemistry [2, 3], no substantial progress has been noted in the teaching of their chemistry in the educational curriculum demonstrated by the small number of papers [3–13], most of them published in the first half of the 20th century.
The rare earth elements (REEs) are an im-portant group of elements poorly represented in chemical education (especially in laboratory ex-periments), mostly because of their low abundanc-es and the radioactive propertiabundanc-es of those minerals where REEs are present as major constituents. Therefore, instead to practical laboratory work with such samples, the recommended and com-mon approach is to use minerals incorporating traces of REEs. In this way, the important features of the abundance and geochemistry of the REEs could be easily demonstrated if simple laboratory experiments are designed. Although the REEs are considered as unsuitable elements for incorpora-tion into common mineral structures due to their relatively bulky charge and large ionic radii [14], they can occasionally be found in minerals consti-tuted of M3+ ions having similar ionic radii (all the REEs exist as M3+ although Eu and Ce can also be present as Eu2+ in reductive media and Ce4+ in marine oxidative surroundings). Minerals which can incorporate REEs as traces are the widespread garnets (almandine, spessartine, grossular, uvaro-vite, pyrope and andradite) and other nesosilicates (titanite, zircon) [15]. The main structural feature of nesosilicate minerals is that no oxygen anions are shared between the adjacent SiO4 tetrahedra. Therefore, the net negative charge of the isolated tetrahedra is neutralized by bonding with trivalent (Al3+, Cr3+, Fe3+) and divalent (Ca2+, Mn2+, Mg2+, Fe2+) cations. These M3+ cations are candidates for exchange with REEs.
The introduction of Fourier-transform (FT) Raman instrumentation which utilizes lasers in the near-infrared region (mostly at 1064 nm) has brought new impetus to this technique. Its major advantages over dispersive Raman instru-ments comprise: i) the almost complete absence of fluorescence at this wavelength (however, the Raman signal due to the 1/λ4 relation is weak); ii) the interferometer converts the Raman signal into an interferogram, allowing the detector to collect the entire Raman spectrum simultane-ously; iii) good x-axis (Raman shift) accuracy as a result of the internal interferometer calibration supplied by the built-in helium-neon laser [16]. Here, for educational purposes, we report that in the presence of traces of REEs in garnets [17] the first and most important benefit of FT-Raman set-up can not be applied, or can even be turned into a limitation for Raman spectroscopy analyses of the garnets. This limitation is reflected in the ap -pearance of unexpected spectral features due to the REEs laser-induced fluorescence bands. So far, such unexpected bands in FT-Raman spec-trum were also reported in non-silicates (cement minerals [18], calcium minerals [19–21], dental materials [22] and bioceramics [23]), broaden-ing the number of mineral types that students can work on to understand the geochemical behavior of the REEs and the crystal chemistry of minerals that exhibit laser-induced fluorescence bands ob -served by Raman spectroscopy instrumentation.
2. EXPERIMENTAL
Raman spectroscopy
a Leica light microscope with 50× magnification, where the Raman spectroscopy measurements was provided using the 514.5 nm excitation line of an air-cooled argon ion laser (Melles Griot). Raman spectroscopy was also obtained using the 532 nm YAG laser line from a micro-Raman spectrometer (Horiba JobinYvon LabRam Infinity) with a focal length of 100×. The computerized Dilor Z24 triple-dispersive monochromator with a Coherent Innova 400 argon ion laser operating at 488 nm was the third choice.
k0-Instrumental neutron activation analysis (k0-INAA)
Neutron activation analysis (NAA) is a nuclear analytical method that utilises the specific properties of nuclear reactions with neutrons, thereby enabling simultaneous determination of numerous elements in analytical samples from the characteristic gamma rays emitted by the induced radioactive nuclides.
Due to its sensitivity, versatility and high reliability, neutron activation analysis is the most prominent of all the activation techniques. It enables multielemental analysis of macroscopic samples (up to 10–12 g of the element in a gram of sample) and the determination of a relatively large number of elements (approximately 70% of the elements in the periodic table have suitable characteristics for NAA).
The k0-method of NAA requires a nuclear reactor as source of neutrons for production of (n,γ) reactions with the target nucleus, a multi-channel analyser (MCA) with corresponding electronic components and an absolutely calibrated high purity germanium detector (HPGe).
In this work, an aliquot of powdered mineral of about 100 mg was sealed into a pure polyethylene ampoule (SPRONK system, Lexmond, The Netherlands). Samples and standards (Al-0.1%Au IRMM-530 disc of 6 mm in diameter and 0.2 mm high) were stacked together and fixed in a polyethylene ampoule in sandwich form and irradiated for 12 hours in the carousel facility (CF) of the 250 kW TRIGA Mark II reactor of the Jožef Stefan Institute at a thermal
neutron flux of 1.1×1012 cm–2 s–1. The activities of the irradiated powdered minerals were measured after 5, 10 and 20 days cooling time on an absolutely calibrated HPGe detector with 45% relative efficiency. The detector was connected to an EG&G ORTEC Spectrum Master high-rate multichannel analyzer.
The HyperLab program [24] was used for peak area evaluation, whereas for determination of f (thermal to epithermal flux ratio) and a (a parameter which represents the epithermal flux deviation from the ideal 1/E distribution), the “Cd-ratio“ method for multi monitor was applied [25]. The values f = 28.6 and a = –0.001 were used to calculate the element concentrations. The elemental concentrations and effective solid angle calculations were carried out on a software package called Kayzero for Windows [26].
3. RESULTS AND DISCUSSION
Modern techniques for REE detection and determination in minerals require sophisticated analytical equipment, whereas the proposed method is based solely on the measurement using Raman spectroscopy instrumentation. This experimental technique is now within the reach of most undergraduate institutions. In addition, its similarity and complementarity with conventional infrared spectroscopy (both are commonly termed vibrational spectroscopy) facilitates spectral interpretation, indicating that Raman spectroscopy as a very efficient tool for educational purposes [27–30].
Firstly, the FT-Raman spectrum of the spessartine sample using laser excitation from the near-infrared (1064 nm) was obtained. Than, the dispersive Raman spectra of the sample were recorded by two visible excitations (488 and 532 nm) (Figure 1). It is evident that the collected spectra are practically identical. Next, the FT-Raman spectrum of almandine sample was collected (by 1064 nm excitation) and the sample was recorded using the laser lines of 488, 514.5 and 532 nm (Figure 2). It is obvious that the visible light excitations produced identical Raman patterns. On contrary, two additional intense and broad bands appeared in the spectrum recorded using 1064 nm excitation (Figure 2, marked by asterisks). These bands are assigned as laser-induced fluorescence bands
which suggest the significant presence of REE traces in the almandine sample. It is advisable to follow the given order of Raman spectra measurements i.e. to firstly record the FT-Raman spectra and than collect the dispersive Raman patterns on the same sample to assure that the eventual difference in the Raman spectra is not a result of partial “burning off” of the sample from FT-Raman laser excitation.
It should be pointed out that in the case of the presence of small REE contents in the garnets two different phenomena could be simultaneously observed using the Raman instrumentation – vibrational bands from the crystal as the Raman effect and laser-induced fluorescence bands due to the excitations of the electrons in the f-orbital.
Fig. 1. Raman spectra of spessartine obtained by visible (488 and 532 nm) and near-infrared (1064 nm) excitation. The lack of additional bands in the latter spectrum serves to confirm the presence of a very low content of REEs (see Table 1 for details).
The proposed method using Raman instrument is validated using some alternative modern analytical technique. The content of the REEs in the potential mineral sample should be determined either by: inductively coupled plasma mass spectroscopy (ICP-MS) [31–38], X-ray fluorescence (XRF) [39–42], neutron activation analysis (NAA) [43–45], ion-chromatography (IC) [46–48], particle induced X-ray emission (PIXE) [49,50], scanning-electron microscopy/energy dispersive X-ray spectroscopy (SEM/EDX) [51] or synchrotron radiation [52] because the concentrations of REEs needed for the experiment are often below the limit of detection of conventional analytical techniques. In this work, a k0-method of instrumental neutron activation analysis (k0 -INAA) was applied and the results for the REEs
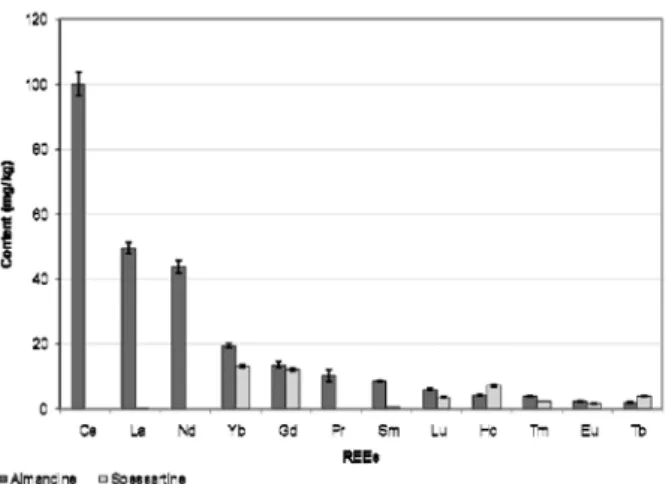
in the studied almandine and spessartine samples are given in Table 1 and Figure 3. As shown, the REE content in the spessartine sample is mostly much lower than in the almandine sample.
Both samples were also examined by X-ray powder diffraction and X-ray microprobe analysis [17]. The results obtained confirmed the authenticity of the minerals studied.
The proposed method for detection of traces of REEs in minerals can be practiced in two ways.
Firstly, the most convenient procedure for laboratories equipped by both FT-Raman and dispersive Raman instrumentation is to record the FT-Raman mineral spectra using near-IR excitation (1064 nm laser) and than use various visible laser lines for the dispersive Raman spectra. Then, the eventual presence
T a b l e 1
The content of REEs and other trace elements determined by k0-INAA.
The REEs are marked in bold. All results are given in mg/kg.
aTotal estimated uncertainty of the method used with a coverage factor k=1. < Limit of detection of the method used.
Elements
Almandine Spessartine Content ± Unc.a Content ± Unc.a
Ag 10.0 ± 0.4 15.6 ± 0.6
As 5.70 ± 0.23 693 ± 24
Au < 0.003 0.039 ± 0.001
Ba < 31 886 ± 32
Br 18.5 ± 0.7 187 ± 7
Cd < 5 218 ± 8
Ce 100 ± 4 < 0.5
Co 28.0 ± 1.0 6.87 ± 0.25
Cr 110 ± 4 40.9 ± 1.5
Cs < 0.33 5.33 ± 0.19
Eu 2.24 ± 0.11 1.60 ± 0.07
Ga < 8.3 14.3 ± 1.2
Gd 13.5 ± 0.9 12.1 ± 0.6
Hf 4.00 ± 0.15 0.33 ± 0.02
Hg < 0.7 1.41 ± 0.07
Ho 4.37 ± 0.18 7.15 ± 0.28
K < 519 645 ± 91
La 49.5 ± 1.7 0.27 ± 0.02
Lu 6.07 ± 0.30 3.50 ± 0.18
Elements
Almandine Spessartine Content ± Unc.a Content ± Unc.a
Mo < 2.2 7.88 ± 0.34
Na 306 ± 11 486 ± 17
Nd 43.9 ± 2.0 < 1.9 Pr 10.1 ± 1.8 < 12.5
Rb < 6.5 6.25 ± 0.63
Sb 0.37 ± 0.03 5.71 ± 0.21
Sc 58.1 ± 2.1 16.7 ± 0.6
Se < 1.3 < 0.9
Sm 8.55 ± 0.30 0.80 ± 0.03
Sr <116 < 80
Ta 2.57 ± 0.09 < 0.04
Tb 1.92 ± 0.07 3.93 ± 0.14
Th 18.7 ± 0.7 0.42 ± 0.02
Tm 3.79 ± 0.16 2.47 ± 0.09
U 3.22 ± 0.12 0.42 ± 0.04
W 3.68 ± 0.20 < 1.3
Yb 19.4 ± 0.7 13.2 ± 0.5
Zn 32.0 ± 2.4 3068 ± 107
of REEs could be established if additional FT-Raman band(s) appear at certain wavelength(s) [in our almandine experiment at 16474 nm (607 cm–1) and 22421 nm (446 cm–1)]. Moreover, if possible, it is recommendable to confirm and quantitatively validate the results by some other modern analytical technique.
Secondly, for laboratories equipped solely with FT-Raman instrumentation, the alternative approach is to collect the mineral spectrum using 1064 nm excitation and compare the collected pattern with the corresponding FT-Raman spectra available in the literature [53] and/or on-line internet databases of Raman spectra [54]. Afterwards (possibly as homework assignment) the student should examine which mineral contains traces of REEs and identify the mineral type by comparison of the recorded spectra with the ones given in the literature [53–57] and/or on-line internet databases of Raman spectra [58].
4. THEORETICAL BACKGROUND
The additional bands in the Raman spectrum of almandine excited by the near-infrared laser are assigned as laser-induced fluorescence bands, related to the presence of REEs in the sample. Existence of luminescence
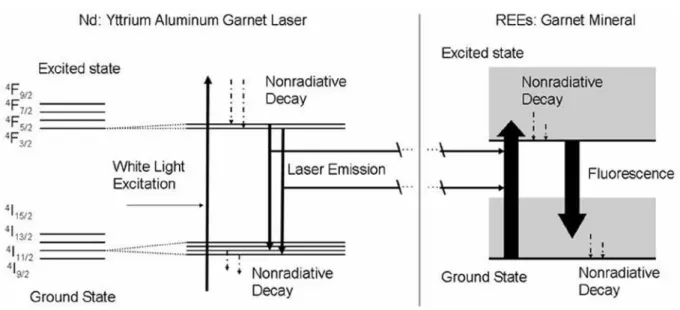
in the spectra indicate the presence of the REE ions in the crystal lattice even if the declared purity of the samples is high [59]. It is well-known that fluorescence is significantly reduced as the wavelength of the excitation laser line increases [60]. However, occasionally due to the relatively small energy gap between the electron levels, fluorescence could be observed in sample excitation from the near-infrared region [60]. The energy level splitting can be explained in terms of crystal field theory (CFT). Namely, luminescence in minerals (mostly silicates, oxides, carbonates and halides) is due to the transitions between quantized energy states of the electrons in either metal cations or polyatomic molecular ions [61]. According to the CFT, the degenerate energy levels of the REE metal cations are split due to interaction with the crystal field, mostly originating from the array of point charges arising from the ligands. As a ligand approaches the metal ion, the electrons from the ligand are positioned closer to some of the orbitals and further away from others, causing a loss of degeneracy. The electrons in the orbitals and those in the ligand fend each other off due to repulsion of charges. Thus, the electrons closer to the ligands have a higher energy than those positioned further away, resulting in orbital energy splitting. Beside the nature of the metal ion, the ion charge, and the ligands surrounding the metal, orbital energy splitting in the crystal field model also depends on the structural site occupied by the REEs present. The REEs are known to have very low orbital splitting energy which is comparable with the energy in the near-infrared region. This feature of the REEs is very important and is effectively used for construction of near-infrared lasers, for instance the Nd:YAG laser (neodymium incorporated in the yttrium aluminum garnet crystal, Y3Al5O12). Nd energy levels involved in the laser action (which are naturally degenerate in the free state) are split by interaction with the crystal field [60]. The orbital splitting is schematically illustrated in the left panel of Figure 4. As a result, transitions between the 4F
3/2 and 4I11/2 states, which are forbidden in the free state, become allowed and give rise to laser emission from the near-infrared region (for
Fig. 3. The content of REEs in the studied almandine and spessartine sample determined by k0-instrumental neutron activation analysis (error bars are given for
example, 1064 nm).
It can be postulated that other garnets exhibit the same influence on the host REEs as YAG does on the Nd ions. Therefore, the gap between the energy levels corresponds to the energy of the near-infrared wavelengths. Accordingly, the 1064 nm laser line can be used to excite the ions to a higher electronic state, subsequently giving rise to emission as fluorescence (schematically exemplified in Figure 4, right panel). In our experiment these bands observed are positioned at 16474 nm (607 cm–1) and 22421 nm (446 cm–1).
Acknowledgments: Financial support from the Ministry of Education and Science of Republic of Macedonia (PM) and the Mace-donian Academy of Sciences and Arts (GJ) is greatly appreciated. The authors would like to thank Dr. Anthony R. Byrne for English proof-reading of the manuscript.
REFERENCES
[1] N.G. Connelly, T. Damhus, R.M. Hartshorn, A.T. Hutton, (Ed’s) Nomenclature of Inorganic
Chemistry: IUPAC Recommendations 2005, RSC Publishing, Cambridge, 2005.
[2] N. E. Topp, The Chemistry of the rare earth elements, In Topics in Inorganic and General Chemistry, Monograph 4; Elsevier, New York, 1965.
[3] T. Moeller, Periodicity and the lanthanides and actinides, J. Chem. Educ. 47, 417 (1970).
[4] S. Peterson, The rare elements in freshman chemistry, J. Chem. Educ. 26, 378−379 (1949). [5] R.K. McAlpine, A.A. Noyes, W.C. William,
A System of Qualitative Analysis for the Rare Elements, J. Chem. Educ. 5, 109–110 (1928). [6] M.E. Weeks, The discovery of the elements.
XVI. The rare earth elements, J. Chem. Educ. 9, 1751−1774 (1932).
[7] A.R. Clark, Test-tube flame test applied to the rarer elements, J. Chem. Educ. 13, 338−339 (1936). [8] L.S. Foster, Structure of the rare earth elements, J.
Chem. Educ. 17, 448 (1940).
[9] T. Chao, J. Yang, Rarer elements I. Tungsten, J. Chem. Educ. 25, 388−389 (1948).
[10] T. Chao, S. Chen, Rarer elements II. Uranium, J. Chem. Educ. 25, 686−387 (1948).
[11] M.O. Workman, Preparation of a fluorescent rare earth complex. A general chemistry experiment, J. Chem. Educ. 48, 303 (1971).
[12] E.D. Cater, High temperature chemistry of rare earth compounds: Dramatic examples of periodicity, J. Chem. Educ. 55, 697–701 (1978).
[13] G.L. Silver, Reactions of Rare Earth Metals, J. Chem. Educ. 72, 956 (1995).
[14] A.P. Jones, F. Wall, C.T. Williams (Ed’s), Rare earth minerals: chemistry, origin and ore deposits, Mineralogical Society Series 7; Chapman and Hall, London, 1996.
[15] M. Gaspar, C. Knaack, L.D. Neinert, R. Moretti, Micro-Raman spectra of ugrandite garnet, Geochim. Cosmochim. Acta 72, 185−205 (2008).
[16] B. Chase, in Fourier Transform Near-infrared
Raman Spectroscopy. In: Handbook of
Vibrational Spectroscopy, Volume I, Theory and Instrumentation, J. Chalmers, P. Griffiths, Eds., Wiley-VCH, New York, 2001.
[17] P. Makreski, G. Jovanovski, Minerals from Macedonia. XXII. Laser-induced fluorescence bands in the FT-Raman spectrum of almandine mineral, J. Raman Spectrosc. 39, 1210−1213 (2008).
[18] C.D. Dyer, P.J. Hendra, The Raman spectroscopy of cement minerals under 1064 nm excitation,
Spectrochim. Acta 49A, 715–722 (1993).
[19] E.L. Varetti, E.J. Baran, Raman or fluorescence spectra? About the use of FT-Raman techniques on inorganic compounds, Appl. Spectrosc. 48, 1028– 1029 (1994).
[20] A. Aminzadeh, Fluorescence bands in the FT-Raman spectra of some calcium minerals, Spectrochim. Acta 53A, 693–697 (1997).
[21] H. Tsuda, J. Arias, B. Leon, A. Arends, Necessary Precautions in the Raman Analysis of Calcium Phosphate Minerals Using 1.06 Mu M Yag Laser Excitation, J. Appl. Spectrosc. 52, 1122–1126 (1998).
[22] A. Aminzadeh, S. Shahabi, L.J. Walsh, Raman spectroscopic studies of CO2 laser-irradiated human dental enamel, Spectrochim. Acta 55A, 1303–1308 (1999).
[23] A. Aminzadeh, M. Meskinfarm, S.F. Tayyary, Laser induced fluorescence bands in the FT-Raman spectra of bioceramics, Spectrochim. Acta 66A, 199–205 (2007).
[24] HyperLab 2002 System, Installation and Quick Start Guide, HyperLabs Software, Budapest, Hungary (2002).
[25] R. Jaćimović, B. Smodiš, T. Bučar, P. Stegnar, K-0-NAA quality assessment by analysis of different certified reference materials using the KAYZERO/
SOLCOI software, J. Radioanal. Nucl. Chem. 257, 659–663 (2003).
[26] User’s Manual Kayzero for Windows V2.23
Software Package, for Reactor Neutron Activation Analysis (NAA) Using the k0 Standardization Method, supported and distributed by k0-ware, Heerlen, The Netherlands, 2009.
[27] D.B. Galloway, E.L. Ciolkowski, R.F. Dallinger, Raman spectroscopy for the undergraduate physical and analytical laboratories, J. Chem. Educ. 69, 79– 83 (1992).
[28] A. Aponick, E. Marchozzi, C. Johnston, C.T. Wigal, Determining the Authenticity of Gemstones Using Raman Spectroscopy, J. Chem. Educ. 75, 465–466 (1998).
[29] L.C.O. O’Brien, R.L. Kubicek, J.J. O’Brien, Laser Raman Spectroscopy of Diamond, J. Chem. Educ. 71, 759–760 (1994).
[30] F.P. DeHaan, J.C. Thibeault, D.K. Ottesen, Raman spectra of ZXY3 compounds: A dry-lab spectral analysis experiment, J. Chem. Educ. 51, 263–265 (1974).
[31] M.R. Mudiam, S.A. Kumar, S. Mahadevan, P. Ghosh, R.K. Sarin, S.R. Beedu, Quantitative evaluation of 28 mineral elements by inductively coupled plasma/mass spectrometry and its application in source identification of Indian opium,
J. AOAC Int. 88, 1469–1484 (2005).
[32] M.N. Rimskaya-Korsakova, A.V. Dubinin, V.M. Ivanov, Determination of rare-earth elements in sulfide minerals by inductively coupled plasma mass spectrometry with ion-exchange preconcentration,
J. Anal. Chem. 58, 870–874 (2003).
[33] Y. Hu, F. Vanhaecke, L. Moens, R. Dams, P. Del Castilho, J. Japenga, Determination of the aqua regia soluble content of rare earth elements in fertilizer, animal fodder phosphate and manure samples using inductively coupled plasma mass spectrometry, Anal. Chim. Acta 373, 95–105 (1998).
[34] M. Barbaro, B. Passariello, S. Quaresima, A. Casciello, A. Marabini, Analysis of Rare-Earth Elements in Rock Samples by Inductively-Coupled Plasma-Mass Spectrometry (Icp-Ms), Microchem. J., 51, 312–318 (1995).
[36] A.M. Marabini, B. Passariello, M. Barbaro, Determination of Rare-Earth Elements in Minerals and Ores by Inductively Coupled Plasma-Mass Spectrometry (Icp-Ms), Mater. Chem. Phys. 31, 101– 106 (1992).
[37] U. Siewers, Inductively coupled plasma/mass spectrometry in geochemistry, Mikrochim. Acta 99, 365–372 (1989).
[38] F.E. Lichte, A.L. Meier, J.G. Crock, Determination of the rare-earth elements in geological materials by inductively coupled plasma mass spectrometry, Anal. Chem. 59, 1150–1157 (1987).
[39] L. Muia, R. Van Grieken, Determination of rare earth elements in geological materials by total reflection X-ray fluorescence, Anal. Chim. Acta 251, 177–181 (1991).
[40] I. Roelandts, Determination of light rare earth elements in apatite by X-ray fluorescence spectrometry after anion exchange extraction, Anal. Chem. 53, 676–680 (1981).
[41] G. N. Eby, Determination of rare-earth, yttrium, and scandium abundances in rocks and minerals by an ion exchange-X-ray fluorescence procedure, Anal. Chem. 44, 2137–2143 (1972).
[42] H. Kunzendorf, H. A. Wollenberg, Determination of Rare-Earth Elements in Rocks by Isotope-Excited X-Ray Fluorescence Spectrometry, Nucl. Instrum.
Methods 87, 197–203 (1970).
[43] C.S. Tsai, S.J. Yeh, Determination of rare earth elements in Taiwan monazite by chemical neutron activation analysis, J. Radioanal. Nucl. Chem. 216, 241–245 (1997).
[44] P. Makreski, R. Jaćimović, V. Stibilj, T. Stafilov, G. Jovanovski, Determination of trace elements in iron minerals by instrumental and radiochemical neutron activation analysis, Radiochim. Acta 96, 855–862 (2008).
[45] P. Makreski, R. Jaćimović, V. Stibilj, T. Stafilov, Determination of major and trace elements in iron-nickel-copper-cobalt ore reference materials using
k0-NAA, Radiochim. Acta 97, 643–649 (2009). [46] E.H. Borai, A.S. Mady, Separation and quantification
of 238U, 232Th and rare earths in monazite samples by ion chromatography coupled with on-line flow scintillation detector, Appl. Radiat. Isot. 57, 463–469 (2002).
[47] S.J.B. Reed, Ion microprobe determination of rare earth elements in accessory minerals, Mineral. Mag. 50, 3–15 (1986).
[48] E.H. Borai, M.A. Eid, H.F. Aly, Determination of REEs distribution in monazite and xenotime minerals by ion chromatography and ICP-AES, Anal. Bioanal. Chem. 372, 537–541 (2002).
[49] N.P.O. Homman, C. Yang, K.G. Malmqvist, A highly sensitive method for rare-earth element analysis using ionoluminescence combined with PIXE, Nucl.
Inst. Methods Phys. Res. A 353, 610–614 (1994). [50] J.J.G. Durocher, N.M. Halden, F.C. Hawthorne,
J.S.C. McKee, PIXE and Micro-Pixe Analysis of Minerals at Ep=40 Mev, Nucl. Inst. Methods Phys.
Res. B 30, 470–473 (1988).
[51] S.K. Sengupta, N.P. Nathan, V. Ganesan, S. Shome, Detection of rare-earth-mineral phases by scanning electron microscopy/energy dispersive X-rays (SEM/ EDX) in the alkaline complexes of Tamil Nadu,
Indian Miner. 59, 99–114 (2005).
[52] V.B. Baryshev, A.E. Gilbert, O.A. Kozmenko, G.N. Kulipanov, K.V. Zolotarev, Determination of the Concentrations and Distributions of Rare-Earth Elements in Mineral and Rock Specimens using the Vepp-4 Synchrotron Radiation, Nucl. Inst. Methods
Phys. Res. A 261, 272–278 (1987).
[53] P. Vandenabeele, H.G.M. Edwards, L. Moens, A decade of Raman spectroscopy in art and archaeology,
Chem. Rev. 107, 675–686 (2007).
[54] L. Burgio, R.J. Clark, Library of FT-Raman spectra of pigments, minerals, pigment media and varnishes, and supplement to existing library of Raman spectra of pigments with visible excitation, Spectrochim. Acta A57, 1491–1521 (2001).
[55] A. Wang, J.Y. Han, L.H. Guo, J.Y. Yu, P. Zeng, Database of Standard Raman-Spectra of Minerals and Related Inorganic Crystals, Appl. Spectrosc. 48, 959–968 (1994).
[56] M. Bouchard, D.C. Smith, Catalogue of 45 reference Raman spectra of minerals concerning research in art history or archaeology, especially on corroded metals and coloured glass, Spectrochim. Acta A59, 2247–2266 (2003).
[57] K. Castro, M. Perez-Alonso, M.D. Rodriguez-Laso, L.A. Fernandez, J. M. Madariaga, On-line FT-Raman and dispersive Raman spectra database of artists’ materials (e-VISART database), Anal. Bioanal. Chem. 382, 248–258 (2005).
[58] http://rruff.info/,
http://www.chem.ucl.ac.uk/resources/raman/index. html
http://www.ens-lyon.fr/LST/Raman/index.php, http://www.fis.unipr.it/phevix/ramandb.php, http://oldweb.ct.infn.it/~archeo/,
http://www.ehu.es/udps/database/database.html, http://riodb.ibase.aist.go.jp/db092/E_index_list.
html,
http://www.ijvs.com/spectra/spectra.html,
http://www.geocities.ws/ostroum/FTRAMAN.htm (all accessed June 2011)
[59] A. Gajović, N. Tomašić, I. Djerdj, D.S. Su, K. Furić, Influence of mechanochemical processing to luminescence properties in Y2O3 powder, J. Alloys Compd. 456, 313–319 (1997).
[60] D.L. Andrews, Lasers in Chemistry; Sprigner, Berlin, 1997.