OPTIMAL RESOLUTION FOR AUTOMATIC QUANTIFICATION OF
BLOOD VESSELS ON DIGITIZED IMAGES OF THE WHOLE CANCER
SECTION
R
ONAN FRANÇOISE1, J
EAN-J
ACQUESM
ICHELS2, B
ENOÎTP
LANCOULAINE3 ANDP
AULETTEH
ERLIN1,21Groupe Régional d’Etudes sur le Cancer (EA 1772 de l’Université de Caen), Centre de Lutte Contre le Cancer
François Baclesse, avenue du général Harris, 14076 CAEN, Cedex 5, France, 2Département de Pathologie, Centre de
Lutte Contre le Cancer François Baclesse, avenue du général Harris, 14076 CAEN, Cedex 5, France, 3Institut
Universitaire de Technologie de l’Université de Caen, Boulevard Maréchal Juin, 14032 CAEN, Cedex, France e-mail: [email protected]
(Accepted October 25, 2004)
ABSTRACT
Discrepancies concerning the prognostic significance of cancer vascularization can be partly explained by biases due to quantification protocols. We recently recommended a swift, inexpensive and automatic analysis of 2,700 dpi slide scanner images of the whole immunostained sections. Another team, proposed, quite at the same time, to work at 4,000 dpi. The aim of the present paper is to check if information contained in images scanned at 2,700 and 4,000 dpi are relevant and equivalent, when compared to the low magnification of the microscope, in order to propose the best compromise between precision and time expense. To evaluate precisely the amount of information gained or lost according to the resolution used, we compared the number and size of blood vessel profiles, manually detected, on twenty one Hodgkin lymphoma acquired with a scanner (2,700 and 4,000 dpi) and with a microscope (16,000 dpi). Results obtained at 4,000 dpi were equivalent to the estimation performed at microscopical level either by a biologist or a pathologist, while tiny vessels were lost at 2,700 dpi. Scanning whole histological sections at 4,000 dpi provides a relevant method for evaluating tumour vascularization, which can be easily automated and standardized.
Keywords: image analysis, immunolabeling, optimal resolution, slide scanner, vessels.
INTRODUCTION
Nowadays no consensus has been reached concerning the prognostic significance of intratumoral neoangiogenesis (Meert et al., 2002), even if numerous papers have been published and several trials have been launched. While vascularization seems to have a prognostic impact on non-small cell lung cancer (Volm
et al., 1996; Fontanini et al., 1997; Shijubo et al., 2003), or endocrine tumours (Goth et al., 2003) for example, conflicting results were reported concerning breast tumours (Hall et al., 1992; Bevilacqua et al., 1995; Marinho et al., 1997; Sauer and Deissler, 2003), colorectal cancers (Mooteri et al., 1996; Banner et al., 1998), or ovarian carcinomas (Bamberger
et al., 1998; Orre et al., 1998). For other tumours, like pancreatic adenocarcinomas, vascular parameters did not exhibit any prognostic significance (Ellis et al., 1998).
Conflicting results obtained for many locations are probably partially owed to the difficulty of assessing reliably and reproducibly intratumoral vascular density, due to the variability of the staining protocols and quantification methods used (Vermeulen
et al., 1997; Hansen et al., 2000; Vermeulen et al., 2002) as well as to the major problem of intratumoral heterogeneity (Schor et al., 1998; Scoazec, 2000; Meert et al., 2002). These technical disagreements dramatically limit the comparison of the results obtained from one team to another and restrain the introduction of blood vessel counting in daily practice.
often restricted to few visually selected highly vascularized tiny areas (so called “hot spots”) and do not take into account the heterogeneity frequently observed, inside tumour sections. Systematic sampling is sometimes performed, but the size of the sample to be used is strictly correlated to the "a priori" unknown degree of heterogeneity (for review see Kim et al., 2003). Moreover, even if restricting counting to highly vascularized foci seems to provide relevant information, the poor reproducibility of “hot spot” visual identification is a major drawback (Vermeulen
et al., 1997).
Analysis of the whole tumour section can provide the best answer to this problem, as “hot spots” can be found automatically (Belien et al., 1999) and as mean and maximum vascularization can be assessed as a reflection of tumour tissue heterogeneity. Nevertheless analysis of high resolution images is nowadays still difficult to implement, because of the huge size in memory of the images, the actual performances of computers and cost of acquisition equipment required.
Digitisation of the whole histological slide can be performed easily and rapidly at a lower resolution, using a flatbed scanner (Schmitt and Eggers, 1999; Krout et al., 2002) or a professional photographic slide scanner (Chantrain et al., 2003; Elie et al., 2003; Kim
et al., 2003). Computer assisted analysis of the
resulting 30 to 70 Megabytes color images is feasible. We recently developed a protocol of fully automatic quantification of immunostained blood vessels, on images of paraffin embedded tumour section, scanned at 2,700 dpi (Kim et al., 2003). This method proved its usefulness for prognostication of ovarian carcinomas (Elie et al., 2003b). Chantrain et al. (2003) proposed quite at the same time to work on frozen cancer sections, at 4,000 dpi.
The aim of this study is to check if information contained in images of paraffin embedded tumours scanned at 2,700 and 4,000 dpi are relevant and strictly equivalent, when compared to the low magnification of the microscope, in order to propose the best compromise between precision and time expense.
MATERIAL AND METHODS
MATERIAL
We used a selection of 21 slides of Hodgkin’s disease lymph nodes among a panel of 468 cases of a therapeutic trial (H7 trial of the " European Organization for Research and Treatment of Cancer"). The chosen paraffin slides were representative of the panel with respect to the diversity of the histological
subtypes and positivity of blood vessel immuno-histochemical labelling.
IMMUNOHISTOCHEMISTRY
Labelling was performed on 4 µm thick paraffin sections of formalin fixed tissues, dried overnight at 56°C. Slides were then deparaffined and rehydrated. Heat enhanced retrieval of antigen was then performed at 95°C, in a microwave oven, using 10 mM pH6 citrate buffer (ChemMate TM Dako), for 30 min.
Sections were immunolabeled at room temperature, with a polyclonal anti-Von Willebrand Factor antibody
(Dako, France), using the Optimax automatic machine
(Biogenex) to guarantee staining reproducibility. After inhibition of endogeneous peroxydase activity, Amino Ethyl Carbazole labeling of Antigen-Antibody binding sites was obtained, following signal amplification (En VisionTM kit, Dako), as described previously in full
details (Kim et al., 2003). Light counterstaining was then performed during 10 sec with Mayer’s haemato-xylin (Biogenex).
IMAGE ACQUISITION
Scanner images
The 21 images of the whole immunostained lymph node sections were captured using a Super CoolScan 8000 ED slide scanner (Nikon), connected to a personal computer (Pentium III, 450 MHz, 128 Mo). The large images obtained (up to 70 Megabytes, for tumour sections up to 11 cm2) were stored as uncompressed Tagged Image File Format (tiff) files. Three slides were scanned per passage, at two different resolutions (2,700 and 4,000 dpi), using a dedicated colour acquisition profile. Image capture took about 3 min per slide.
Mosaic microscopical images
mm2) were collected from each previously scanned
lymph node histological section, at a direct magni-fication of ×4, which leads to a final resolution of 16,000dpi and an average weight of 1.8 Mb.
IMAGE PREPARATION
In order to evaluate the amount of information gained or lost according to the resolution used, we
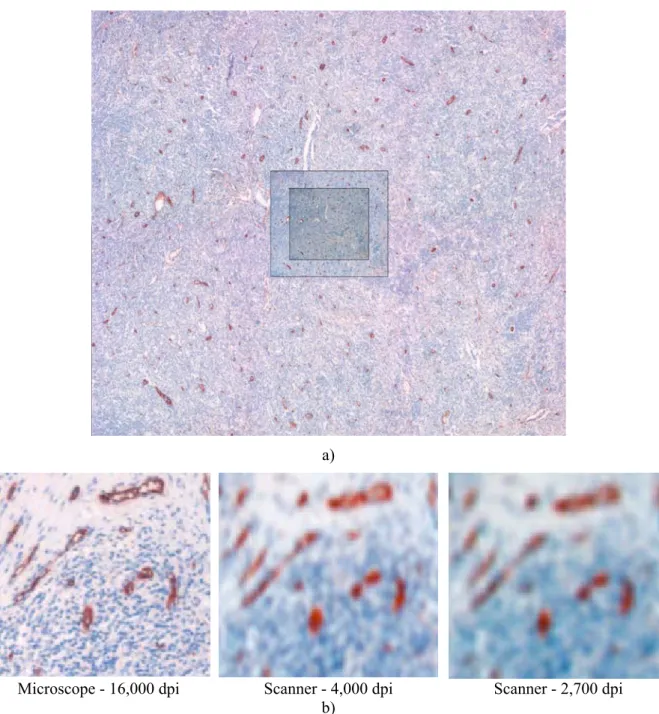
compared strictly the same territories (full size 16,000 dpi mosaic microscopical image and corresponding areas cropped from the whole section scanner images obtained at 2,700 and 4,000 dpi) (Fig. 1a). To increase the objectivity of the study, scanner images were resized up to 16,000 dpi, using the bicubic zoom function of Paint Shop Pro 5 software (Jasc Software USA) as shown on a detail Fig. 1b.
a)
Microscope - 16,000 dpi Scanner - 4,000 dpi Scanner - 2,700 dpi b)
BLOOD VESSEL IDENTIFICATION AND
QUANTIFICATION
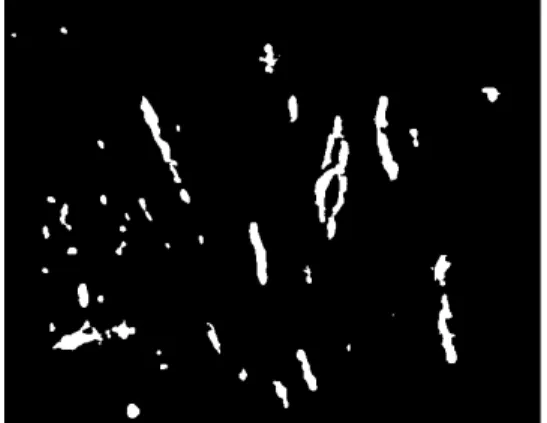
In order to save time, blood vessels were at first automatically segmented, on each triplet of images, using a dedicated automatic routine developed in Aphelion software® and which combines a top hat transformation and an “excess red” colour detection, followed by a geodesic reconstruction. The resulting binary image of AEC stained structures was then superimposed, as an invisible overlay on the original colour image, thanks to Paint Shop Pro 5 software tools. Images were displayed, at full resolution, on a 17 inch 1024×768 pix colour. In these conditions, the final magnification of structures for an observer was around 200. Finally, one of us (RF) identified visually and pointed out all sections of blood vessels on each triplet of images, activating the invisible selection, surrounded undetected structures if needed, and generating the final binary image of blood vessels (Fig. 2).
We tried also to appraise the inter-observer concordance concerning the chosen “gold standard”, by comparing the results of blood vessel visual identification performed by two different observers (a biologist RF and a pathologist JJM) on the reference 16,000 dpi mosaic microscopical images.
The method used by the two observers differed, as the biologist tried to select all labelled structures, even tiny, whereas the pathologist often outlined broader structures, by extrapolating large vascular sections.
Aphelion image analysis software was then used to quantify the blood vessels on the final 21 quadruplets of binary images (two binary images from the two scanner resolutions and two binary images from the reference microscope level). The number and morphometric characteristics of blood vessels (area and diameter) were computed and then collected and analyzed in an Excel file format. The results obtained by the biologist (RF) at microscopical level were taken as a reference for the comparison done at various resolutions and for evaluating inter-observer discrepancies.
Automatic detection of vascular structures Resulting binary image
Transformation of the binary image into an overlay. Pointing out of "truly positive" vessels (red) and adding of vessels undetected by software (arrow). False positive structures are omitted (white).
The final result is the reference binary image.
STATISTICAL ANALYSIS
We used "xlstat" software (Addinsoft France) inside Excel software (Microsoft corporation USA) for statistical analysis. Because the Kolmogorov-Smirnov test showed a “non-normal” distribution of the measures obtained, non-parametric row correlation Spearman test was used for comparing the number and total area of vascular structures, found on each image, at the three resolutions used.
RESULTS
CRUDE ESTIMATION OF THE TOTAL
NUMBER OF VESSELS
The number of vessel profiles identified by the biologist varies from 88 to 1131 for the images scanned at 2,700 dpi, from 148 to 1415 for the images scanned at 4,000 dpi and from 158 to 1798 for the microscopic images recorded at 16,000 dpi.
The resulting global percentage of loss of vascular structures from one resolution to another and for the whole set of images thus reached 16% from 16,000 dpi to 4,000 dpi, 29% from 4,000 dpi to 2,700 dpi and 40% from 16,000 dpi to 2,700 dpi.
So, there was an increasing loss of detected vessels according to the resolution used, but this loss was not equivalent from one image to the other. As evidenced on Fig. 3, in 7 cases out of 21, the number of vessels found at scanner level (4,000 dpi) and at
the low magnification of the microscope (16,000 dpi) was the same.
Concerning inter-observer variability, the patho-logist found 25% less vessels than the biopatho-logist, on the whole set of microscopic images recorded at 16,000 dpi.
As a result, the number of vessels identified on images recorded at 4,000 dpi fell in the interval defined by the biologist and pathologist references. One must notice that the number of vessels visually identified at 2,700 dpi remained the lowest for 17 images out of 21 (Fig. 3).
STUDY OF THE GLOBAL
CORRELATION BETWEEN THE
NUMBER OF VESSELS IDENTIFIED
AT THE THREE RESOLUTIONS
A strong correlation was found between the results obtained by the biologist at the three resolutions used (0.91 between 16,000 dpi and 2,700 dpi, 0.97 between 4,000 dpi and 2,700 dpi, and 0.95 between 16,000 dpi and 4,000 dpi).
The correlation between vessel counts of both observers at microscopical level was 0,93.
The number of vessels detected by the pathologist was also closely correlated with the number found by the biologist at scanner level (0.94 between 16,000 dpi and 2,700 dpi, 0.96 between 16,000 dpi and 4,000 dpi).
0 200 400 600 800 1000 1200 1400 1600 1800 2000
0 1 2 3 4 5 6 7 8 9 10 11 12 13 14 15 16 17 18 19 20 21
image number
number
of vessel
s
2700 dpi
4000 dpi
16000 dpi- RF
16000 dpi-JJM
ESTIMATION OF THE TOTAL AREA OF
VESSELS PER IMAGE
The total area of vessels identified by the biologist varies from 0.02 mm2 to 0.46 mm2 for the
images scanned at 2,700 dpi, from 0.02 mm2 to 0.50
mm2 for the images scanned at 4,000 dpi and from
0.02 mm2 to 0.38 mm2 for the microscopic images
recorded at 16,000 dpi.
So, we concluded, for this observer, to a slight global overestimation of the vascular area at scanner level, when compared to microscopical level (mean area: 0.16 mm2 at 2,700 dpi and 0.19 mm2 at 4,000
dpi versus 0.13 mm2 at 16,000 dpi).
STUDY OF THE GLOBAL
CORRELATION BETWEEN THE AREA
OF VESSEL PROFILES IDENTIFIED AT
THE THREE RESOLUTIONS
We found better correlations (R = 0.98) between the total vascular surfaces, than between the number of vascular structures, estimated on images recorded at different resolutions (Fig. 4).
The agreement between the two observers was 0,81 at microscopical level, despite differences in methodology. One must notice that the mean total area of vessels appraised by the pathologist was the same as at 4,000 dpi (0.19 mm²).
DISTRIBUTION OF THE INDIVIDUAL
SIZE OF VESSELS COLLECTED AT
THE THREE RESOLUTIONS
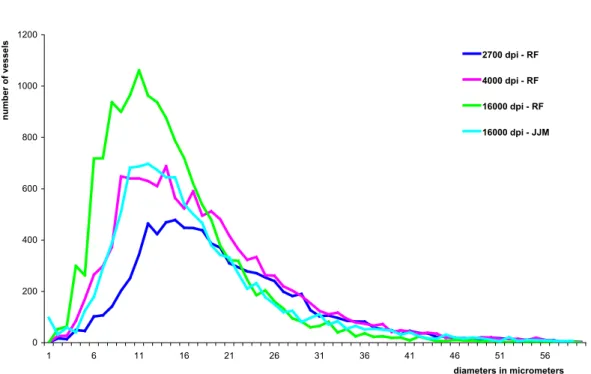
Very tiny vessel profiles can be collected at scanner level as evidenced on Fig. 5. The loss of information at 2700 dpi relates to small vascular structures with a diameter less than 20 micrometers.
RANGE OF DIFFERENCES OBTAINED
FROM ONE IMAGE TO THE OTHER
Whatever may be the discrepancies obtained in the precise total number and total area of blood vessel profiles for the same image recorded at an initial resolution of 2,700 4,000 or 16,000 dpi, one must notice that, when normalizing the results by the mean values of the series, the range of differences observed from one image to the other remains equivalent for the three resolution used.0 0.1 0.2 0.3 0.4 0.5 0.6
0 1 2 3 4 5 6 7 8 9 10 11 12 13 14 15 16 17 18 19 20 21
image number
to
tal
area o
f vessel
s i
n
mm²
2700 dpi
4000 dpi
16000 dpi-RF
16000 dpi-JJM
0 200 400 600 800 1000 1200
1 6 11 16 21 26 31 36 41 46 51 56
diameters in micrometers
number of
vessels
2700 dpi - RF
4000 dpi - RF
16000 dpi - RF
16000 dpi - JJM
Fig. 5. Comparison of the size distribution of blood vessel profiles visually identified on numerical images, recorded at scanner and microscopical level, from paraffin sections of 21 Hodgkin disease lymph nodes.
DISCUSSION
The present study evidenced a more precise estimation of tumour vascularization at 4,000 dpi than 2,700 dpi, when compared to the microscope. This result can be easily explained by the fractal structure of the blood vessel tree. Nevertheless, one can notice that the range of differences observed between tumours is still preserved at low resolution.
At 2,700 dpi the pixel size of the digitised image is 9.3 × 9.3 µm. Even if bicubic zooming is able to artificially reduce the size of the structures which can be identified, up to 1,6 µm in diameter, neighbouring tiny vessel sections can not be discriminated under the initial resolution used, and individual profiles or vessel clumps, with a diameter less than 9.3 µm, will be visible only if exhibiting a strong immunostaining and a light surrounding. The mixture of deep blue and light red neighbouring colours is probably responsible of the main part of the loss of small vessel profile (under 20 µm in diameter). This information is better preserved at a resolution of 4,000 dpi, for which the pixel size of the digitised image reaches 6.3 × 6.3 µm.
Even working on zoomed scanner images, we noticed an overestimation of the area of detected vessel profiles, which will be probably slightly more pronounced when analysing 2,700 dpi than 4,000 dpi native images.
These various remarks and conclusions lead us to recommend the use of the upper scanner resolution (4,000 dpi).
Using 2,700 or 4,000 dpi scanner images offers many advantages when compared to upper resolutions obtained classically at microscopical level. One must record in one time and very rapidly an image of the whole histological section, which can be used for automatic identification of hot spots as well as computation of mean and maximum intra-tumoral vascularization. Automatic identification of “hot spots” is required for avoiding the major problem of intra and interobserver disagreements (Belien et al., 1999; Hansen et al., 2000; Vermeulen et al., 2002). A simple solution is at hand with the scanner. Even if the assessment of maximum values is recommended by several authors and the last consensus review of Vermeulen (2002), we recently showed that the mean numerical density of blood vessels is definitely of prognostic significance for ovarian tumours (Elie et al., 2003b). Working on images of the whole section will provide pathologist with both results.
dpi scanner images offers actually the best compromise between precision, time expense, cost of the acquisition device and actual automatic image processing performances.
Recent technical advances in sensors, computers, storage capability, and image management allow to digitise entire microscope slides at diagnostic (i.e., microscopical) resolutions. This can be obtained classically through microscopical image tiling, a time consuming and expensive solution, or more recently thanks to slide scanning devices working at high resolution (50,000 or 100,000 dpi) (Dee et al., 2003).
These techniques permit a pathologist to give a diagnosis from a computer monitor, instead of looking through a microscope, but they are mainly used for teaching purposes (Marchevsky et al., 2003). Digitising a whole microscopical slide at diagnostic resolution remains a technical challenge, because of the need to capture and store huge amounts of data in the shortest time, furthermore the resulting 600 to 800 megabytes image can not be easily and automatically processed today. So, acquiring perfect quality high resolution images and then using high rate compression to allow image processing, makes no sense, as the precision gained first at high resolution is then lost. Furthermore we experienced that image processing and especially colored image segmentation is much more difficult and irrelevant on compressed images than on lower resolution uncompressed native ones.
Whatever the resolution used, the scanner acquisition shows numerous advantages when compared to the microscopic image tiling, which remains the conventional method for capturing large images. We emphasize the simplicity and speed of the acquisition. The time necessary for capturing and stitching thousands of image tiles may reach several hours per slide, whereas recording an image of a whole histological section will be achieved in 2 to 3 min with a 4,000 dpi slide scanner, using a triple CCD barrette and keeping an image averaged from three successive recording, in order to enhance signal to noise ratio.
Moreover, image-by-image background correction is avoided at scanner level and the illumination delivered by the device is homogeneous, which greatly simplify image processing. One must notice also that the Nikon scanner pilot used offers the opportunity to record a dedicated acquisition profile. The reproduction of acquisition conditions guarantees the efficiency of automatic colour processing and standardization of the proposed method. One can easily, rapidly and efficiently analyse vascularization
of large tumour series in these conditions, a work in progress in our laboratory (Elie et al., 2003).
ACKNOWLEDGMENTS
This work was funded by grants from the “Comité départemental de la Manche de la Ligue Nationale de Lutte contre le Cancer”, from the “Agence Nationale de Valorisation de la Recherche”, from the “Fonds Européens de Développement Régional”and from the “Conseil Régional de Basse Normandie”. The authors thank Dr Michel Henry-Amar, Mrs Catherine Moricet and the pathologists of the Lymphoma group of the European Organization for Research and Treatment of Cancer.
REFERENCES
Bamberger E S, Perrett CW (2002). Angiogenesis in epithelian ovarian cancer. Mol Pathol 55(6):348-59. Banner BF, Whitehouse R, Baker SP, Swanson RS (1998).
Tumor angiogenesis in stage II colorectal carcinoma: association with survival. Am J Clin Pathol 109(6): 733-7.
Belien JA, Somi S, de Jong JS, van Diest PJ, Baak JP (1999). Fully automated microvessel counting and hot spot selection by image processing of whole tumour sections in invasive breast cancer. J Clin Pathol 52(3): 184-92.
Bevilacqua P, Barbareschi M, Verderio P, Boracchi P, Caffo O, Dalla Palma P et al. (1995). Prognostic value of intratumoral microvessel density, a measure of tumor angiogenesis, in node-negative breast carcinoma-results of a multiparametric study. Breast Cancer Res Treat 36(2):205-17.
Chantrain CF, DeClerck YA, Groshen S, McNamara G (2003). Computerized quantification of tissue vascu-larization using high-resolution slide scanning of whole tumor sections. J Histochem Cytochem 51(2): 151-8. Dee FR, Lehman JM, Consoer D, Leaven T, Cohen MB
(2003). Implementation of virtual microscope slides in the annual pathobiology of cancer workshop laboratory. Hum Pathol 34(5):430-6.
Elie N, Plancoulaine B, Signolle JP, Herlin P (2003a). A simple way of quantifying immunostained cell nuclei on the whole histologic section. Cytometry 56A(1):37-45. Elie N, Tran KN, Herlin P, Joly F, Denoux Y, Crouet H, Heron JF et al. (2003b). Prognostic significance of tumor vascularization on survival of patients with ovarian carcinoma. Proceedings of the 2003 meeting of the American Society of Clinical Oncology (22):462, abstract 1857.
Fontanini G, Lucchi M, Vignati S, Mussi A, Ciardiello F, De Laurentiis M et al. (1997). Angiogenesis as a prognostic indicator of survival in non-small-cell lung carcinoma: a prospective study. J Natl Cancer Inst 89(12):881-6.
Goth MI, Hubina E, Raptis S, Nagy GM, Toth BE (2003). Physiological and pathological angiogenesis in the endocrine system. Microsc Res Tech 60(1):98-106. Hall NR, Fish DE, Hunt N, Goldin RD, Guillou PJ,
Monson JR (1992). Is the relationship between angiogenesis and metastasis in breast cancer real? Surg Oncol 1(3):223-9.
Hansen S, Grabau DA, Sorensen FB, Bak M, Vach W, Rose C (2000). The prognostic value of angiogenesis by Chalkley counting in a confirmatory study design on 836 breast cancer patients. Clin Cancer Res 6(1): 139-46.
Kim NT, Elie N, Plancoulaine B, Herlin P, Coster M (2003). An original approach for quantification of blood vessels on the whole tumour section. Anal Cell Pathol 25(2): 63-75.
Krout KE, Jenkins JM, Loewy AD (2002). High-resolution scanner for neuroanatomical analysis. J Neurosci Methods 113(1):37-40.
Marchevsky AM, Relan A, Baillie S (2003). Self-instructional "virtual pathology" laboratories using web-based technology enhance medical school teaching of pathology. Hum Pathol 34(5):423-9.
Marinho A, Soares R, Ferro J, Lacerda M, Schmitt FC (1997). Angiogenesis in breast cancer is related to age but not to other prognostic parameters. Pathol Res Pract 193(4):267-73.
Meert AP, Paesmans M, Martin B, Delmotte P, Berghmans T, Verdebout JM et al. (2002). The role of microvessel density on the survival of patients with lung cancer: a systematic review of the literature with meta-analysis. Br J Cancer 87(7):694-701.
Mooteri S, Rubin D, Leurgans S, Jakate S, Drab E, Saclarides T (1996). Tumor angiogenesis in primary
and metastatic colorectal cancers. Dis Colon Rectum 39(10):1073-80.
Orre M, Lotfi-Miri M, Mamers P, Rogers PA (1998). Increased microvessel density in mucinous compared with malignant serous and benign tumours of the ovary. Br J Cancer 77(12):2204-9.
Sauer G, Deissler H (2003). Angiogenesis: prognostic and therapeutic implications in gynecologic and breast malignancies. Curr Opin Obstet Gynecol 15(1):45-9. Schmitt O, Eggers R (1999). Flat-bed scanning as a tool for
quantitative neuroimaging. J Microsc 196(3):337-46. Schor AM, Pendleton N, Pazouki S, Smither RL, Morris J,
Lessan K et al. (1998). Assessment of vascularity in histological sections: effects of methodology and value as an index of angiogenesis in breast tumours. Histochem J 30(12):849-56.
Scoazec J (2000). Tumor angiogenesis. Ann Pathol 20(1): 25-37.
Shijubo N, Kojima H, Nagata M, Ohchi T, Suzuki A, Abe S et al. (2003). Tumor angiogenesis of non-small cell lung cancer. Microsc Res Tech 60(2):186-98.
Thuillier J (2001). The 7th ESACP (European Society for
Analytical Cellular Pathology) Congress. Caen, France. April 1-5, 2001. Abstracts. Anal Cell Pathol 22(1-2): abstract S004.
Vermeulen PB, Gasparini G, Fox SB, Colpaert C, Marson LP, Gion M et al. (2002). Second international consensus on the methodology and criteria of evaluation of angiogenesis quantification in solid human tumours. Eur J Cancer 38(12):1564-79.
Vermeulen PB, Libura M, Libura J, O'Neill PJ, van Dam P, Van Marck E et al. (1997). Influence of investigator experience and microscopic field size on microvessel density in node-negative breast carcinoma. Breast Cancer Res Treat 42(2):165-72.