MJCCA9 – 638 ISSN 1857-5552
Received: November 20, 2013 UDC: 543.545.2:[606:616.831.9-008.83
Accepted: February 5, 2014 Original scientific paper
OPTIMIZATION OF SUPERVISED SELF-ORGANIZING MAPS WITH GENETIC
ALGORITHMS FOR CLASSIFICATION ELECTROPHORETIC PROFILES
Natalija Tomovska, Igor Kuzmanovski, Kiro Stojanoski*
Institute of Chemistry, Faculty of Natural Sciences and Mathematics, Ss. Cyril and Methodius University, Skopje, Republic of Macedonia
Standard electrophoresis methods were used to classify analyzed proteins in cerebrospinal fluid from patients with multiple sclerosis. Disc electrophoresis was carried out on polyacrylamide gels for the detection of oligoclonal IgG bands in cerebrospinal fluid, mainly from patients with multiple sclerosis and other central nervous system dysfunctions. ImageMaster 1D Elite and Gel-Pro specialized software pack-ages were used for fast accurate image and gel analysis. The classification model was based on supervised self-organizing maps. In order to perform modeling in an automated manner, genetic algorithms were used. Using this approach and a data set composed of 69 samples, we developed models based on super-vised self-organizing maps which were able to correctly classify 83% of the samples in the data set used for external validation.
Keywords: disc electrophoresis; cerebrospinal fluid; protein analysis; supervised self-organizing maps
ОПТИМИЗАЦИЈА НА САМООРГАНИЗИРАНИ МАПИ ТРЕНИРАНИ СО НАДГЛЕДУВАНО УЧЕЊЕ СО ГЕНЕТСКИ АЛГОРИТМИ ЗА КЛАСИФИКАЦИЈА НА ЕЛЕКТРОФОРЕТСКИ ПРОФИЛИ
Стандардна електрофоретска метода беше користена за анализа на протеините во церебро-спиналниот ликвор кај пациенти претежно со мултипла склероза, но и со други заболувања на централниот нервен систем, со намера да се изврши класификација на експерименталните резул-тати. За оваа намена беше користена диск-електрофорезата за детекција на олигоклонални IgG ленти во електрофореграмите добиени со гел-електрофореза. Анализата на електрофореграмите беше направена со специјализираниот софтвер ImageMaster 1D Elite и софтверскиот пакет GelPro. За класификација на добиените експериментални резултати беа користени самоорганизирани мапи тренирани со надгледувано учење. За да се автоматизира моделирањето, беше користен генет-скиот алгоритам. Користејќи го овој пристап и податоците од 69 примероци за анализа, добивме модели базирани на самоорганизирани мапи, со кои може коректно да се класифицираат 83 % од податоците користени за екстерна валидација.
Клучни зборови: диск-електрофореза; церебрален флуид; анализа на протеини;
самоорганизирани мапи тренирани со надгледувано учење
1. INTRODUCTION
Quantitative and qualitative analysis and the determination of different types of proteins, other biomolecules and their profiles play an increasing role in medical diagnosis. Standard electrophoresis methods and many emerging approaches such as lab-on-a-chip methods are well known for protein detection and analysis of cerebrospinal fluid (CSF)
related to neurodegeneration and psychiatric dis-orders [6]. However, cerebrospinal fluid analysis, coupled with other methods, remains the basis of the diagnosis of various neurological disorders, including multiple sclerosis and infectious diseases of the central nervous system (CNS) [3, 7].
In the routine procedure, electropherograms are classified into different groups according to the qualitative and quantitative composition of cere-brospinal fluid with regard to major protein frac-tions and the CSF/serum albumin quotient, coupled with McDonald diagnostic criteria [3]. In addition, for the detection of oligoclonal IgG bands in serum and in unconcentrated spinal fluid, some tech-niques have been used, such as the isoelectric fo-cusing combined with polyethylene-enhanced gel immunofixation and silver staining, CSF/serum quotient diagrams, different body indices, etc. [7–9].
In addition, the automation and development of software has enabled the fast collection of huge amounts of electrophoretic data [10]. Image analy-sis software is used to extract much more informa-tion from the electropherogram for comparative analysis between gels generated in-house or avail-able in web-based databases. Data acquisition, ma-nipulation and computation for electrophoretic pro-tein pattern recognition are performed using stan-dard statistical signal analysis. Cluster analysis, along with other statistical methods such as prin-cipal component analysis (PCA), artificial neural networks (ANN) and fuzzy logic [10, 11] have been used in various areas of medicine.
Our previous results obtained using hierar-chical cluster analysis, despite considerable simi-larities between electropherograms, have shown that different clustering approaches produced dif-ferent dendrograms, and it was concluded that cluster analysis should be used cautiously [5]. Hav-ing the disadvantages of these methods in mind, here we decided to use self-organizing maps (SOM). This algorithm has become a valuable tool for data analysis purposes [12–22]. The most commonly used SOM algorithm is for clustering multidimen-sional data [12–19] and for process/reaction moni-toring [22, 23], but also as a tool for variable selec-tion [24]. The theoretical background of self-orga-nizing maps [24] and their applications in chemi-stry are described in detail in the literature [25–26]. A variant of the SOM algorithm, called supervised self-organizing maps [24], has not been widely used in chemometrics. However, keeping in mind the fact that this version of the algorithm is suitable for clas-sification purposes, we have used it for successfully developing classification models for different pur-poses [27, 28].
In this paper, we describe our efforts to de-velop classification models based on supervised self-organizing maps [24] in order to determine (1) whether the patients have multiple sclerosis or (2) other central nervous system dysfunctions (like po-lyradiculoneuritis, known as Guillain-Barré syn-drome, encephalitis and paraproteinemia) or (3) whether the findings belong to patients without any disorder of the central nervous system.
2. EXPERIMENTAL
The electrophoregrams used here were ana-lyzed in our previous work and the experimental details are described there [4, 5]. In addition to the results from 32 patients diagnosed with multiple sclerosis, we used the data from an additional 23 patients. The majority of these patients had a histo-ry of psychiatric disorders (polyradiculoneuritis, paraproteinemia and encephalitis) and no symp-toms or signs of neurological disease, as shown by magnetic resonance imaging and electrophysiolog-ical investigations and routine biochemelectrophysiolog-ical analys-es. Also, electrophoregrams were obtained from a control group of 14 healthy patients. Clinical in-vestigations were performed according to the Reg-ulations of the Macedonian Ethical Committee and the Ministry of Health of the Republic of Macedonia.
2.1. Disc electrophoresis
Disc electrophoresis was carried out on 7% polyacrylamide gels, using the Canalco (USA) elec-trophoresis system. CSF was used without precon-centration. Proteins were separated on polyacryla-mide gels polymerized in glass tubes, approximately 5 mm in diameter and 15 cm in length. The experi-mental details are described by Spiroski et al. [5].
3. DATA PREPARATION AND MODELING
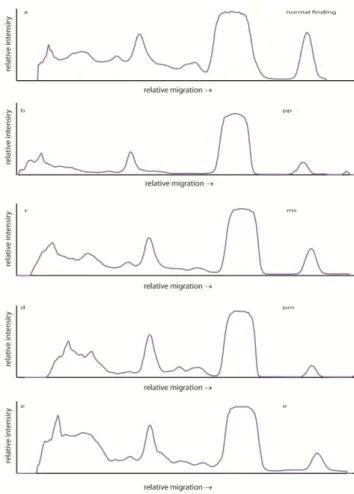
Fig. 1. Electrophoregrams of CSF from: a) N – control subject, b) PRN – polyradiculoneuritis,
c) MS – multiple sclerosis, d) PP – paraproteinemia, and e) E – encephalitis
3.1. Supervised self-organizing maps
Self-organizing maps have been developed as an algorithm for unsupervised learning. Howev-er, in cases where poor class separation is obtained, a modified version for supervised classification can be used. A slight modification of the algorithm can transform SOMs into a tool for supervised classifi-cation [24]. Namely, SOMs can be transformed into an algorithm for supervised classification if the input vectors for the training samples (ds) are
augmented by a unit vector du (Figure 2a) with its
components assigned into one of the four classes present in the training set. During the phase of pre-diction, the part of the weight vectors of SOM that correspond to the unit vector is excluded (Figure 2b). In other words, for each sample in the training set ds, the corresponding du must be used during
training while during the recognition of an un-known sample x, only the xs part is compared with
the corresponding part of the weight vectors of the trained SOM.
It is also important to mention that, in this work, instead of using autoscaled
electrophero-grams for training the supervised SOMs, we used principal components extracted from the norma-lized and autoscaled electropherograms. The ad-vantage of this approach is that PCA is able to ex-tract most of the information (stored in the prepro-cessed data matrix composed of 270 data points) into a vector (principal component) composed of only a few data points.
Fig. 2. Supervised SOM setup for classification of data set with four different classes. a) The training set vectors are augmented with the unit vector. The unit vector in this case has a length of three. Correspondingly, the number of additional weight levels of the supervised SOM which correspond to the unit vector is also four. b) After the training of the supervised SOM has fin-ished, the developed model can be used (without the weight levels that correspond to the unit vector) for the classification of
additional samples (test vectors)
3.2. Genetic algorithm
In order to perform optimization of the su-pervised SOMs in an automated manner, but also to minimize the role of the analyst, the GA was used [31–33]. It has been shown that this algorithm is an effective tool for solving different optimiza-tion problems in chemistry [27, 28, 34–38]. GA is capable of performing relatively fast convergence toward a global minimum of the optimized func-tion without the need to run every possible permu-tation of the optimized parameters [31–33].
Most commonly, GA is used for variable se-lection [31–33], but in our laboratory we use it not only for this purpose, but also for the determina-tion of other important parameters which could influence the performance of the developed model [27, 28].
4. RESULTS AND DISCUSSION
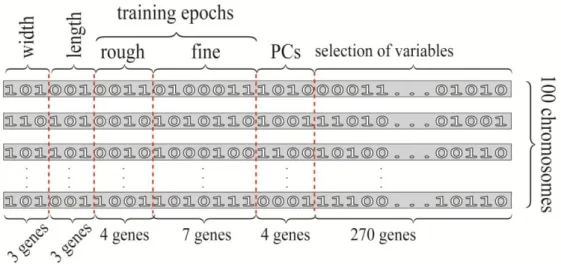
As previously stated, in order to perform the optimization of the supervised SOMs in an auto-mated manner, we used the GA. For these purpos-es, the search for the best possible model was per-formed on a population consisting of 100 chromo-somes. The chromosomes were encoded, as pre-sented in Figure 3. To find the width of the super-vised SOM, three genes were used (in the interval 4–11 neurons). An additional three genes were used to adjust the length of the supervised SOM (in the interval 4–11 neurons); four genes were used to find the most suitable number of epochs in the rough training phase (in the interval: 10–25 neu-rons). Seven genes were used to adjust the number
of training epochs in the fine training phase (the obtained number in the interval between 1 and 128 was increased by double the number of epochs in the rough training phase, in order to ensure that the number of epochs in this phase is larger than the one in the previous training phase). An additional 270 genes were used to select variables from elec-tropherograms (normalized and autoscaled) and, at the end, four more genes were used to select the number of principal components, which was calcu-lated from the preselected data points.
Initialization of the weights of the super-vised SOMs was performed along the first two principal components obtained from the training data set. During training, we used the Gaussian neighborhood function and a linearly decreasing learning rate. The entire optimization using GA lasted 450 generations and, as previously stated, we used a population composed of 100 somes. During optimization 20% of the chromo-somes with the best performance were used as par-ents for the creation of the offspring chromosomes (80% of the population) for the following genera-tion. Mating pairs were formed from the best (20%) chromosomes for formation of the new population using the roulette wheel selection rule [34].
In order to avoid fast convergence in a small area of the search, a mutation was applied during the optimization. Until generation 50, the probabil-ity of the occurrence of a mutation in the offspring chromosome was kept at 0.10. After that, until generation 150, the probability for the occurrence of a mutation linearly decreased down to 0.05. From there on, until the end of GA optimization, mutation was kept at the same level.
The developed classification models were validated using both internal and external valida-tion. Internal validation was performed during GA optimization using the cross-validation-leave-10%-out procedure with the training data set (composed of 52 samples). After the search for the best model ended, we used the test set for external validation of the best model. The test set was composed of 17
samples from the original data set. Prior to starting optimization (using GA), the data set was divided into the training set and the test set using the Ken-nard-Stone algorithm [39]. Some of the best mod-els, the size of the SOM, the training epochs as well as the number of misclassified samples for these models are presented in Table 1.
T a b l e 1
Parameters for some of the best models obtained using genetic algorithms
Model No. of PCs
Training set errors
Cross-validation
error
Test set errors
Size of the SOM Training epochs Width Length Rough
phase
Fine phase
1 8 1 1 3 7 8 19 54
2 8 0 2 4 7 8 19 59
3 8 0 2 5 7 8 10 42
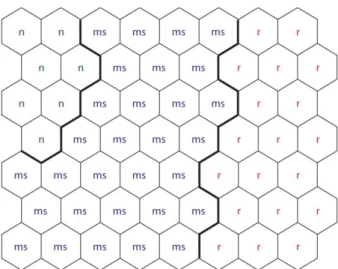
In the remaining part of this discussion, we will analyze model number 1 in more detail (Table 1). The trained supervised SOM for this model (in which different areas are properly labeled) is pre-sented on Figure 4. One can notice here that the upper left corner of the supervised SOM is capable of recognizing samples from the healthy patients with normal protein status in the CSF. The central part of the supervised SOM is capable of recogniz-ing the samples collected from patients with mul-tiple sclerosis, while in the right part of the map, the samples from the remaining patients are grouped. Figure 5 also corresponds to model 1 (from Table 1). In this case (in Figure 5), SOM was labeled according to the results obtained using the training set. Here, we noticed that the only misclassified sample belongs to the broad class of samples, which were added to the data set in order to develop a more robust model. Without these additional 23 samples, our models would have been able to classify into only two classes (healthy individuals and patients with multiple sclerosis). If the model was developed using only these two types of samples, and if it had been used for the classification of additional samples (which do not belong to these two classes), it could have been “forced” to be mapped into a part which is capable of recognizing two classes of samples (in this hy-potetical case, samples from healty patients and samples from patients with multiple sclerosis). So, having this explanation in mind, together with the fact that we had a relatively small number of sam-ples in our data set, the additional 23 samsam-ples from the patients with three additional diagnoses were
considered as a third class. So, we assume that the samples from this third class are misclassified be-cause of the small number of samples with differ-ent diagnoses (polyradiculoneuritis, paraproteine-mia and encephalitis) in it.
In Figure 6, we show the map that corres-ponds to the discussed model, but this time it is labeled with the labels from the samples which are part of the test set (used for external validation). In total, three samples from the test set were misclas-sified by this model. None of the misclasmisclas-sified samples belongs to a patient who was diagnosed with multiple sclerosis. (This is also the case with the other two models presented in Table 1.) In our oppinion, this is due to the fact that almost half of the samples belong to patients with multiple scle-rosis, so the discussed model is capable of correct-ly classifying all samples of this type, not oncorrect-ly the samples from the training set, i.e. the samples which are part of the test set. Two of the three mis-classified samples for this model belong to healty patients, while the third sample is a sample from a patient with another psychological disorder.
Fig. 4. Trained supervised SOM for model 1 (Table 1) labeled with the different types of classes
(n – healthy patients, ms – patients with multiple sclerosis, r – patients with other psychiatric disorders)
Fig. 5. Training samples with their labels mapped on the supervised SOM
Fig. 6. Test samples with their labels mapped on the supervised SOM
5. CONCLUSIONS
We have shown that models based on super-vised self-organizing maps coupled with genetic algorithms for the classification electrophoretic profiles is an attractive approach for automated diagnostics on samples from patients with multiple sclerosis. The results of our modeling show that it is possible to develop a model which can success-fully classify samples from patients with multiple sclerosis. However, during the phase of external validation, for all three models examined in this work, we observed misclassifications of samples taken from healthy patients and from patients with other psychological disorders (not multiple sclero-sis). We believe that, in future, the research on this subject in our laboratory will continue. With a larger number of samples, we will be able to present more detailed results from models which will be able to successfully recognize not only samples from pa-tients with multiple sclerosis, but also samples from patients with other psychological disorders.
REFERENCES
[1] O. Trenchevska, V. Aleksovski, D. Nedelkov and K. Stojanoski, Developing Novel Methods for Protein Analysis and Their Potential, Implementation in Di-agnosing Neurological Diseases, in: Advanced Topics in Neurological Disorder, chapter 7, pp. 129–158 (2012). [2] H. Link, Y. Huang, Oligoclonal bands in multiple
scle-rosis cerebrospinal fluid: An update on methodology and clinical usefulness, J. of Neuroimmunol., 180, 17–28 (2006).
[3] McDonald diagnostic criteria: C. H. Polman, S. C. Rein-gold, B. Banwell, M. Clanet, J. A. Cohen, M. Filippi, K. Fujihara, E. Havrdova, M. Hutchinson, L. Kappos, F. D. Lublin, X. Montalban, P. O'Connor, M. Sandberg-Wollheim, A. J. Thompson, E. Waubant, B. Weinshen-ker, J. S. Wolinsky, Annals of Neurology, Diagnostic criteria for multiple sclerosis: 2010 Revisions to the McDonald criteria. 69, 292–302 (2011).
[4] A. Mitrevski, K. Stojanoski and P. Korneti, Detection of oligoclonal IgG bands in cerebrospinal fluid on poly-acrylamide support media: Comparison of isoelectric fo-cusing and disc electrophoresis, Acta Pharm., 3, 163– 171, (2001).
[5] F. Spiroski, K. Stojanoski, A. Mitrevski, Comparison of statistical cluster methods in electrophoretic protein pat-tern analysis, Acta Pharm.,55, 215–221 (2005). [6] L. Liao, D. Cheng, J. Wang, T. Losik, D. Duong, M.
Gearing, H. Rees, J.-J. Lah, AI Levey, J. Peng, Proteo-mic characterization of postmortem amyloid plaques iso-lated by laser capture microdissection, J. Biol. Chem., 279, 37061–37068 (2004).
[8] W. W. Tourtellotte, A. R. Potvin, J. O. Fleming, K. N. Murthy, J. Levy, K. Syndulko, J. H. Potvin, Multiple sclerosis: measurement and validation of central nervous system IgG synthesis rate, Neurology, 30, 240–244 (1980).
[9] C. J. M. Sandic, P. Monteyne, G. Bigaignon and E. C. Laterre, Polyclonal and oligoclonal IgA synthesis in the cerebrospinal fluid of neurological patients. An immu-noaffinity-mediated capillary blot study, J. Neuroimmu-nol. 94 103–111(1994).
[10] J. Vohradsky, Adaptive classification of two-dimensional gel electrophoretic spot patterns by neural networks and cluster analysis, Electrophoresis, 18, 2749–2754 (1997).
[11] M. Kratzer, B. Ivandic, A. Fateh-Moghadam, Neuronal network analysis of serum electrophoresis, J. Clin. Pathol., 45, 612–615 (1992).
[12] P. K. Hopke, X. H. Song, Classification of single parti-cles by neural networks based on the computer-controlled scanning electron microscopy data, Anal. Chim. Acta, 348, 375–388 (1997).
[13] D. Wienke, Y. Xie, P. K. Hopke, Classification of air-borne particles by analytical scanning electron micro-scopy imaging and a modified Kohonen neural network (3MAP), Anal. Chim. Acta, 310, 1–14 (1995).
[14] R. Goodacre, J. Pygall, D. B. Kell, Plant seed classifica-tion using pyrolysis mass spectrometry with unsuper-vised learning: The application of auto-associative and Kohonen artificial neural networks, Chemometr. Intell. Lab. Syst., 38, 69–83 (1997).
[15] J. Zupan, M. Novič, Classification of multicomponent analytical data of olive oils using different neural net-works, Anal. Chim. Acta, 192, 219–234 (1994). [16] H. Yang, I. R. Lewis, P. R. Griffiths, Raman
spectrome-try and neural networks for the classification of wood types. 2. Kohonen self-organizing maps, Spectrochim. Acta, 55, 2783–2791 (1999).
[17] Y. V. Heyden, P. Vankeerberghen, M. Novic, J. Zupan, D. L. Massart, The application of Kohonen neural net-works to diagnose calibration problems in atomic ab-sorption spectrometry, Talanta, 51, 455–466 (2000). [18] I. V. Pletnev, V. V. Zernov, Classification of metal ions
according to their complexing properties: A data-driven approach, Anal. Chim. Acta, 455, 131–142 (2002). [19] F. Vandeerestraeten, C. Wojciechowski, N. Dupuy, J. P.
Huvenne, Recognition of starch origin and modifications by chemometrics spectral data processing, Analysis, 26, 57–62 (1998).
[20] V. Tanevska, I. Kuzmanovski, O. Grupče, Provenance determination of Vinica terra cotta icons using self-organising maps, Annali di Chimica, 97, 541–552 (2007). [21] M. Kolehmainen, P. Rönkkö, O. Raatikainen,
Monitor-ing of yeast fermentation by ion mobility spectrometry measurement and data visualisation with Self-Organizing Maps, Anal. Chim. Acta, 484, 93–100 (2003).
[22] C. Ruckebusch, L. Duponechel, J.-P. Huvenne, Degree of hydrolysis from mid-infrared spectra, Anal. Chim. Acta, 446, 255–266 (2001).
[23] R. Todeschini, D. Galvagni, J. L. Vílchez, M. del Olmo, N. Navas, Kohonen artificial neural networks as a tool for wavelength selection in multicomponent spectro-fluorimetric PLS modelling: Application to phenol, o -cresol, m-cresol and p-cresol mixtures, Trends Anal. Chem., 18, 93–98 (1999).
[24] T. Kohonen, Self-Organizing Maps, 3rd Edition, Springer, Berlin, 2001.
[25] J. Zupan, M. Novič, I. Raisánchez, Kohonen and coun-terpropagation artificial neural networks in analytical chemistry, Chemometr. Intell. Lab. Syst., 38, 1–23 (1997).
[26] J. Zupan, J. Gasteiger, Neural Networks in Chemistry and Drug Design, WCH, Weinheim, 1999.
[27] I. Kuzmanovski, M. Trpkovska, B. Šoptrajanov, Deter-mination of the composition of human urinary calculi composed of whewellite, weddellite and carbonate apa-tite using artificial neural networks, J. Mol. Struct., 744– 747, 833–838 (2005).
[28] I. Kuzmanovski, S. Dimitrovska-Lazova, S. Aleksovska, Classification of perovskites with supervised self-organizing maps, Anal. Chim. Acta, 595, 182–189 (2007).
[29] http://gel-pro-analyzer.software.informer.com/
[30] M. Otto, Chemometrics, 2nd Edition, Wiley, Weinheim, 2007.
[31] J. Holland, Outline for a Logical Theory of Adaptive Systems, J. Comput. Machinery3, 297-314 (1962). [32] B. Kermani, S. Schiffman, H. T. Nagle, IEEE Trans.
Biomed. Eng., 46, 429–439 (1999).
[33] C. Henderson, W. Potter, R. McClendon, G. Hoogen-boom, Predicting Aflatoxin Contamination in Peanuts: A Genetic Algorithm/Neural Network Approach, Appl. In-tell., 12, 183–192 (2000).
[34] K. Hasegawa, Y. Miyashita, K. Funatsu, GA Strategy for Variable Selection in QSAR Studies: GA-Based PLS Analysis of Calcium Channel Antagonists, J. Chem. Inf. Comput. Sci., 37, 306–310 (1997).
[35] B. M. Smith, P. J. Gemperline, Wavelength selection and optimization of pattern recognition methods using the genetic algorithm, Anal. Chim. Acta, 423, 167–177 (2000).
[36] S. S. So, M. Karplus, Genetic Neural Networks for Quantitative Structure−Activity Relationships: Im-provements and Application of Benzodiazepine Affinity for Benzodiazepine/GABAA Receptors, J. Med. Chem.,
39, 5246–5256 (1996).
[37] R. Leardi, A. Lupiáñez González, Genetic algorithms applied to feature selection in PLS regression: How and when to use them, Chemom. Intell. Lab. Syst., 41, 195– 207 (1998).
[38] H. Yoshida, R. Leardi, K. Funatsu, K. Varmuza, Feature selection by genetic algorithms for mass spectral classi-fiers, Anal. Chim. Acta, 446, 485–494 (2001).