Longitudinal and Life Course Studies 2018 Volume 9 Issue 2 Pp 188–211 ISSN 1757-9597
Disability and the transition to early adulthood: A life
course contingency perspective
Gina Allen Erickson
Hamline University, USARoss Macmillan
Università Bocconi, Italy(Received June 2015 Revised January 2018) http://dx.doi.org/10.14301/llcs.v9i2.335
Abstract
Building on research on the social nature of health, we view disability as a life course contingency wherein effects are differentially consequential during the transition to adulthood based on interactions between disability type and institutional characteristics of life course pathways. Using data from the United States National Longitudinal Study of Adolescent Health (n=2299 females and 2197 males, respectively), we utilise logit-link latent class analyses to model pathways to early adulthood and assess the effects of disability on these pathways. Results show that disability is variably connected to the transition to adulthood. Specifically, cognitive rather than physical disability is strongly connected to disadvantaged pathways, largely because it disrupts educational attainments that are the fundamental building blocks of the more advantageous pathways into adulthood and has effects consistently larger than several key sociodemographic indicators. Results are discussed with reference to life course capitalisation processes and a conceptualisation of disability in relation to the institutional logics and contexts that are the backdrop to contemporary role transitions.
Keywords
Disability; life course; methodology; transition to adulthood
Introduction
Sociologists have long-standing interests in factors that shape life chances and inequality over the life course. While issues of economic stratification and family traditionally dominated discussions, recent work has considered the roles of childhood health in structuring the life course (Palloni, 2006; Willson, Shuey, & Elder, 2007). Such work shifts the focus to health as a determinant, rather than consequence, of life fortunes and thus advances general theories of the life course and stratification (Carter, Austin, & Trainor, 2012; Palloni, 2006; Ross & Mirowsky, 2001;
examining the role of disability in shaping pathways to adulthood, focusing on the interplay between different types of disability and role expectations of the various social institutions that frame the transition to adulthood.
Erickson, Macmillan Disability and the Transition to Early Adulthood…
wellbeing (Barker, Power, & Roberts, 1996; Vles et al., 2005). Disability has also become institutionalised, wherein legislation requires particular standards and practices to accommodate those with disabilities in certain institutions (e.g. the Americans with Disabilities Act (ADA)), though we know little about the efficacy of such laws and their implications for social life (Percy, 2001). Fourth, research increasingly recognises disability as a structuring factor in the transition to adulthood (Carter et al., 2012; Janus, 2009; Lindstrom, Harwick, Poppen & Doren, 2012; Osgood, Foster, Flanagan, & Ruth, 2005; Priestley, 2003; Sanford et al., 2011; Shandra, 2011; Stewart et al., 2014; Van Naarden Braun, Yeargin-Allsopp, & Lollar, 2006; Wagner, Newman, Cameto, Garza & Levine, 2005; Wells, Sandefur & Hogan, 2003), yet such work is largely descriptive.
Against this backdrop, this paper articulates a life course perspective on disability during the early transition to adulthood that emphasises how disability connects to institutional contexts in the life course. We assess the efficacy of this perspective using longitudinal data to empirically map pathways into adulthood and then examine adolescent disability as a structuring factor of these pathways. We focus on the early portion of the transition to adulthood, given the multiple and complex arrays for institutional contexts that are especially salient as youths age out of childhood roles and institutions and into adult settings. Finally, we compare the effects of disability type – physical, cognitive, and learning – against several well-recognised determinants of life chances.
Conceptualising disability and its effects
in the transition to adulthood
We view disability as a sociomedical condition dependent on personal and environmental factors that influence the experience or expression of physical and cognitive embodied disablement. Consistent with this, the U.S. National Institute on Disability and Rehabilitation Research defines disability as the “interaction between characteristics (e.g. conditions or impairments, functional status, or personal and social qualities) of an individual and characteristics of the natural, built, cultural, and social environments” (U.S. Department of Education, 2015). While physical and cognitive capabilities vary
greatly, disability is designated when functioning falls below socially recognised and institutionally defined thresholds (Zola, 1993). In the current research, we measure three primary types of disability: physical (bodily impairments including visual and hearing difficulties), learning disabilities (diagnosis and enrolment in special education programming), and cognitive disabilities (low cognitive functioning)’ these are described in detail below.
Life course pathways
It is generally accepted that the life course unfolds in institutionally and culturally prescribed ways (Hogan & Astone, 1986; Shanahan, 2000) with the transition to adulthood comprised of completion of schooling, entry into full-time, career-type work, marriage or cohabitation, and parenthood (Furstenberg et al., 2004). Key questions for demographers and life course researchers surround the inter-connection of transitions, their order and timing, and how these reveal distinct pathways through the life course (Furstenberg, 2010; Macmillan, 2005). Given this, disability may be particularly significant if it undermines one’s ability to make particular transitions that then have implications for subsequent transitions (Tisdall, 2001).
Erickson, Macmillan Disability and the Transition to Early Adulthood…
balancing of multiple roles sequentially and simultaneously. Ultimately, how roles are combined, timed, and sequenced defines specific and differentiated pathways over the life course.
The institutionalised nature of social life makes some pathways more or less difficult to navigate and thus more or less common in the population. Prior empirical work suggests several common pathways in the contemporary transition to adulthood, including a school-to-work pathway (with or without post-secondary education), a school-to-family
pathway, a multidimensional school-to-work-to-family pathway (with or without
post-secondary education), a drop out-to-work/family pathway, a prolonged pathway involving extended education but slower school completion and movement into other roles, and finally a limited transition pathway with low probabilities of any role or role transition (Macmillan & Copher, 2005; Macmillan & Eliason, 2003; Osgood et. al., 2008; Ross, Schoon, Martin, & Sacker, 2009). We use these below as a heuristic for formulating hypotheses.
Disability as life course contingency
Given the socially structured yet variable pathways into adulthood, disability should be seen as a life course contingency, the consequences of which depend on the nature of impairment and the institutional structure of different pathways into adulthood. As such, disability is likely to affect life course pathways when it intersects with institutional logics and role requirements/expectations. Indeed, work by Janus (2009) shows evidence of the varied effects of disability types on young adult outcomes but does not empirically explain why such variation exists. Below, we extend such work by offering several hypotheses on the nature of the contingency between disability and life course pathways.
Consider first a school-to-work pathway, involving completion of secondary or post-secondary education followed by movement into the labour force. While both schools and workplaces are subject to disability-related legislation, we focus on the primacy of disability in educational settings given that schooling typically precedes work and that educational success is a key determinant of labour market achievements (Kerckhoff, 2000). Here, we anticipate different effects by disability type. As most
disability legislation (e.g. ADA) mandates architectural and technological accommodations, it likely mitigates detriments associated with physical disabilities. Also, disability-related law in K-12 (primary and secondary) public education (e.g. American Individuals with Disabilities Education Act - IDEA) emphasises the provision of “free appropriate public education” (FAPE) to each child with a disability. In contrast, post-secondary schools (and employers) are held to a lower standard of ensuring non-discrimination on the basis of disability (under the ADA) and thus do not modify essential requirements or fundamentally alter the nature of a service, program, or activity (U.S. Department of Education, 2010). Given this, we expect cognitive disabilities to be particularly detrimental for transitions into higher education. This yields two related hypotheses. First, H1:
Learning disability and cognitive impairment, rather than physical disability, should decrease the likelihood of school-to-work pathways, particularly those involving post-secondary education.
Still, if institutional supports in K-12 schools are not realised, we would expect those with cognitive impairments to have a high risk of dropping out of school altogether. Thus, H2:
Cognitive impairments should increase the likelihood of dropout pathways.
A prolonged transition involves education past the teenage years but slower transitions out of school and into full-time work and family roles (Furstenberg et al., 2004). Because prolonged pathways typically involve some post-secondary schooling, we expect that physical and learning disability would increase the likelihood of this pathway (vis-à-vis an on-time college-to-work transition) due to the lower institutionalisation of disability services in post-secondary settings. Further, we expect that cognitive impairment should decrease the likelihood of this pathway given that it limits entry into post-secondary education and hence eliminates the possibility of delayed exits. Specifically, H3:
Physical impairment and learning disability should increase, while cognitive impairment should decrease, the likelihood of a prolonged pathway.
Erickson, Macmillan Disability and the Transition to Early Adulthood…
without intervening work. As these pathways are likely more prevalent among females, we only hypothesise about the effects for women. Because marriage markets for women are more diverse and less dependent on occupational fortunes than for males (Oppenheimer, 1988), we expect physical disability to be more consequential for this pathway given its effects on perceived physical attractiveness and the salience of attractiveness in the evaluation of female partners (Feingold, 1990; Rojahn, Komelasky & Man, 2008; Stevens, Owens, & Schaffer, 1990). Moreover, family institutions are not regulated with respect to discrimination; there are no legal constraints to mitigate discrimination in family contexts. Thus, H4:
Physical impairment should decrease the likelihood of school-to-family pathways among women.
Finally, the principle of cumulative advantage and disadvantage suggests that disabilities that undermine the fundamental building blocks of the life course would undermine subsequent life course transitions (Willson et al., 2007). Life course pathways are more efficacious when they involve roles that are sequenced in a particular order: school (particularly college completion) followed by work followed by family, especially marriage followed by parenthood (Hogan, 1978; Marini, 1984). We expect impairments that undermine educational attainment would also undermine multifaceted pathways such as a school-to-work-to-family pathway. Thus, H5:
Cognitive impairments should decrease the likelihood of a school-to-work-to-family pathway, particularly
college-to-work-to-family.
We also expect disability may undermine any and all role enactments and ultimately produce a limited transition pathway, indicating multifaceted problems making institutional role-based transitions over time. We expect this pathway to be particularly prevalent for those with cognitive impairments. Thus, H6:
Cognitive impairment should increase the likelihood of a limited transition pathway.
Assessment of these hypotheses requires both data and an analytic strategy that allows for the consideration of roles over time in a multidimensional manner and associates them with impairment types to understand the nature of disability, as well as other
potential determinants, in understanding pathways into adulthood. We describe such data and strategy below.
Data and measures
The National Longitudinal Study of Adolescent Health (Add Health) is a nationally representative, longitudinal study of American adolescents in grades 7–12 during the 1994–1995 school year. Drawing from school rosters, 20,745 students completed in-home interviews at wave 1. Interviews were conducted in-person, generally in respondents’ homes. In most cases, a parent completed a separate interview at this time. Follow-up interviews were completed one year later and a third follow-up (wave 3) included 15,197 young adults roughly 18 to 26 years old in 2001–2002. Our sample consists of those who are in waves 1 and 3. In order to maximise both the number of respondents and the duration of observation over the early transition to adulthood, we include those age 16 or older in wave 1 with the consequence that the average age at wave 3 is 23. Our age range parallels the samples used by others in similar analyses of disability in the transition to adulthood (Janus, 2009; Sanford et al., 2011; Wells et al., 2003) and includes the period during which the most complex transitions across multiple institutional contexts occurs, particularly the ageing-out of adolescent-limited institutions (generally by age 18 or 21).1 We stratify by sex to allow differences in pathways and the effects of disability on such pathways. After accounting for sample attrition and missing data, our analytic samples include 2299 females and 2197 males.
Erickson, Macmillan Disability and the Transition to Early Adulthood…
Association’s DSM-IV. As such, it should be regarded a indicator of general cognitive disability. Learning disability is based on parent reports of their child’s diagnosis with a learning disability and enrolment in special education programs (Svetaz, Ireland, & Blum, 2000). By requiring both diagnosis and enrolment, this measure capitalises on the institutionalisation of learning disabilities as a way of increasing validity. Only a handful of respondents reported more than one type of disability and in almost all cases, cognitive disabilities co-occurred with physical or learning disabilities. Because we expect cognitive disabilities to be more restrictive in the transition to adulthood, those with multiple disabilities are coded as cognitively disabled. While not exhaustive, three broad and widely recognised categories of disability are reasonably captured in our measures.2
We consider several background variables as both controls and as a means of comparing the magnitude of disability effects with other fundamental indicators of social stratification. For purposes of consistency, we scale each of our independent measures as dummy variables to standardise metrics. Race/ethnicity indexes non-Hispanic blacks and Hispanics and compares them with all other (predominantly white) respondents. We measure family structure by contrasting single-parent and step-parent households with households including both parents (reference). Poverty is indicated if family income (given household size) falls below the 1995 federal poverty threshold, while parental education is measured as either parent’s highest level of education, entered as less than high school, high school graduate (reference), some college, and college graduate. Finally, ecological context is measured as urban residence and neighborhood quality. Measured in census block groups, the latter indexes the proportion of households that are female-headed, receiving public assistance, living below the poverty line, and the local unemployment rate (α= 0.89). We differentiate living in a poor neighborhood (the highest 30% on our index) or living
in a good neighborhood (the lowest 10% on our index). Like the disability measures, all sociodemographic variables are drawn from wave 1. We capture the multidimensional and dynamic character of the transition to adulthood based on well-recognised markers of the transition to adulthood (Shanahan, 2000). Based on retrospective accounts at wave 3, this includes age-specific measures of employment status (full time, part time or unemployed), degree completion (none, high school degree or GED, and associates, bachelors or higher), marriage (never married, married, formerly married), and parenthood (not a parent, parent). All analyses use sampling weights and survey analysis techniques to adjust for the complex sample design (Chantala & Tabor, 1999). Percentages for all variables are shown in table 1.
Analytic strategy: a latent class approach
To model heterogeneous pathways in the transition to adulthood, we use latent class analysis in the program Latent Gold 4.5 (Vermunt & Magidson, 2005). Latent class analysis is a cluster-based approach to measurement models with categorical observed and unobserved variables. Latent classes are defined by the criterion of conditional independence where each observed variable is statistically independent of every other variable within each latent class. Via maximum likelihood estimation, observed data is used to estimate parameters of a measurement model including the number of latent classes, the estimated probability of a latent class, and the conditional probability of the observed variables given latent class. Using a criterion of parsimony, the general objective is to identify the smallest number of classes necessary to adequately characterise the observed data. Additional covariates can be added to the model as predictors of class membership. For the case of three observed categorical variables with two covariates, the model takes the form:
𝑃𝑃(𝑦𝑦𝑖𝑖11 =𝑚𝑚11, … ,𝑦𝑦𝑖𝑖𝑖𝑖𝑖𝑖 =𝑚𝑚𝑖𝑖𝑖𝑖|𝑧𝑧𝑖𝑖1𝑐𝑐𝑐𝑐𝑐𝑐,𝑧𝑧𝑖𝑖2𝑐𝑐𝑐𝑐𝑐𝑐) =� 𝑃𝑃(𝑥𝑥𝑘𝑘|𝑧𝑧𝑖𝑖1𝑐𝑐𝑐𝑐𝑐𝑐,𝑧𝑧𝑖𝑖2𝑐𝑐𝑐𝑐𝑐𝑐) 𝐾𝐾
𝑥𝑥=1
∙ � �(𝑦𝑦𝑖𝑖𝑖𝑖𝑖𝑖 =𝑚𝑚𝑖𝑖𝑖𝑖|𝑥𝑥𝑘𝑘) 𝑇𝑇
𝑖𝑖=1 𝑆𝑆
Erickson, Macmillan Disability and the Transition to Early Adulthood…
Where yistequals a response variable for case i for
a particular role or state s (e.g. employment) at age t (e.g. 17) and mstindexes a particular category of state s at age t (e.g. full-time employment at age 21) conditional on the specific class k of latent variable x (see Hagenaars and McCutcheon (2002)). As can be seen from the probability structure, the observed ys are assumed to be mutually independent given membership in a particular category of the latent variable x, known as the assumption of local independence. With observed data measuring roles at different ages, the number of latent classes indicates the number of (latent) pathways into adulthood, the latent class probabilities indicate the estimated population probability of each pathway, and the conditional probabilities for the observed variables given latent pathway reveal the relationship among roles within and across ages for different pathways. The multinomial logit-link specification allows for the incorporation of covariates that specify how such factors influence the distribution of x, membership in categories of the latent variable. With longitudinal data, we explicitly capture the interlock of roles that together constitute pathways over the life course and formally model how disability and
other covariates influence membership in each pathway.
Results
Empirical models of the transition to adulthood
Erickson, Macmillan Disability and the Transition to Early Adulthood…
Table 1. Frequency distribution for markers of the transition to adulthood and selected covariates, National Longitudinal Study of Adolescent Health.
Females (N=2299) Males (N=2197)
A. Markers of the transition to adulthood
Age Age
17 18 19 20 21 22 23 17 18 19 20 21 22 23
Degree attainment
None 78.9% 35.9% 16.6% 11.4% 9.8% 8.3% 7.5% 83.2% 46.1% 22.5% 15.3% 13.2% 11.6% 10.6%
High school 20.9% 63.5% 81.8% 83.6% 76.7% 66.0% 58.9% 16.8% 53.9% 77.0% 81.5% 79.0% 70.9% 64.6%
College 0.2% 0.6% 1.7% 5.0% 13.5% 25.8% 33.7% 0.2% 0.0% 0.0% 3.1% 7.9% 17.5% 24.8%
Married
No 99.7% 95.7% 90.5% 86.3% 81.3% 75.1% 69.3% 99.8% 98.0% 95.7% 92.8% 88.8% 83.4% 79.4%
Yes 0.3% 4.3% 9.5% 13.7% 18.7% 24.9% 30.7% 0.2% 2.0% 4.3% 7.2% 11.2% 16.6% 20.6%
Parent
No 95.9% 92.7% 88.6% 83.8% 78.9% 76.2% 71.8% 97.5% 96.6% 94.3% 91.0% 88.1% 85.7% 82.2%
Yes 4.1% 7.3% 11.4% 16.3% 21.1% 23.9% 28.3% 2.5% 3.4% 5.7% 9.0% 11.9% 14.3% 17.8%
Employment status
Not in labour force 24.7% 18.9% 16.6% 15.0% 13.7% 13.6% 12.9% 20.6% 14.7% 13.5% 11.5% 9.4% 9.8% 7.9% Part-time work 57.6% 52.0% 43.9% 40.7% 35.3% 29.3% 31.7% 56.9% 48.4% 36.3% 32.0% 28.9% 24.8% 23.2%
Erickson, Macmillan Disability and the Transition to Early Adulthood…
Table 1. (Cont.)
B. Covariates
Age Age
17 18 19 20 21 22 23 17 18 19 20 21 22 23
Age at Wave 1
16 19.3% 18.4%
17 49.3% 49.8%
18 31.0% 31.0%
19 0.4% 0.9%
Disability
None 89.7% 85.2%
Physical 4.3% 3.5%
Learning 3.9% 9.0%
Mental 2.1% 2.3%
Race/Ethnicity
Black 17.4% 15.7%
Hispanic 11.0% 12.1%
Family structure
Single parent 26.0% 22.7%
Step parent 12.2% 11.6%
Poverty 21.6% 17.8%
Parental education
Less than high school 10.9% 11.3%
Some college 30.0% 30.6%
College graduate 32.0% 32.5%
Community context
Urban 33.2% 29.7%
Rural 26.5% 31.1%
Good neighbourhood 14.1% 12.8%
Erickson, Macmillan Disability and the Transition to Early Adulthood…
Table 2. Bayesian Information Criterion (BIC) statistics for model fit, National Longitudinal Survey of Adolescent Health.
Females Males
Number of pathways BIC # parameters BIC # parameters
I 19939 41 16653 40
II 17883 101 15287 99
III 16945 161 14309 158
IV 16305 221 13774 217
V 16079 281 13532 276
VI 16031 341 13398 335
VII 16010 401 13369 394
VIII 16100 461 13444 453
IX 16170 521 13577 512
Note: Preferred models are in bold.
Contrary to many claims in the contemporary literature (Arnett, 2004 Buchmann, 1989), extent of heterogeneity is not particularly large – seven pathways – and there remains a high degree of institutionalisation of the life course. For both females and males, a first pathway characterises a school-to-work transition (see figures 1A and 2A) where the likelihood of high school graduation is very high by 19 (near 1.0), accompanied by a steady increase in the likelihood of full-time work (> .75) through the early 20s. Equally important, likelihoods of marriage and parenthood remain low (< .10). This pathway is the most prevalent pathway for both sexes, yet characterises a somewhat larger proportion of males (.30) than females (.25).
A second, college-to-work pathway (see figures 1B and 2B) involves college graduation by age 23 with a high likelihood of part-time work (> .75 for females
and > .50 for males) during the interim years. As the likelihood of college graduation increases, the likelihood of part-time work declines and full-time work increases. By 23, the probability of full-time
work is high (≈ .75), while movement into family roles
is marginal (< .25). This pathway is somewhat more prevalent among females (.19 versus .15). The third pathway shows a prolonged transition to adulthood (figures 1C and 2C). While the likelihood of high
school graduation is reasonably on time (≈ 1.0 by age
19), there is little movement (< .05) into full-time work, marriage, or parenthood by the early twenties. Instead, there is a high and extended likelihood of part-time work (> .50) followed by sharp increases in the likelihoods of college graduation, full-time employment (from 0.0 at age 21 to ≈ .50 at age 23).
Erickson, Macmillan Disability and the Transition to Early Adulthood…
Figure 1. Role probabilities conditional on latent pathway into adulthood, females, National Longitudinal Study of Adolescent Health.
0 0.25 0.5 0.75 1
17 18 19 20 21 22 23
E st im a te d R o le P ro b a b ilit y Age
A. School-to-Work Pathway (.25) 0 0.25 0.5 0.75 1
17 18 19 20 21 22 23
E st im a te d R o le P ro b a b ilit y Age
B. College-to-Work Pathway (.19) 0 0.25 0.5 0.75 1
17 18 19 20 21 22 23
E st im a te d R o le P ro b a b ilit y Age
G. School-to-Family Pathway (.10) 0 0.25 0.5 0.75 1
17 18 19 20 21 22 23
E st im a te d R o le P ro b a b ilit y Age
C. Prolonged Pathway (.16) 0 0.25 0.5 0.75 1
17 18 19 20 21 22 23
E st im a te d R o le P ro b a b ilit y Age
D. School-to-Single Parenthood Pathway (.12) 0 0.25 0.5 0.75 1
17 18 19 20 21 22 23
E st im a te d R o le P ro b a b ilit y Age
E. School-to-Work-to-Family Pathway (.12) 0 0.25 0.5 0.75 1
17 18 19 20 21 22 23
E st im a te d R o le P ro b a b ilit y Age
F. Limited Transition Pathway (.10)
0 0.250.5 0.751
17 18 19 20 21 22 23
Erickson, Macmillan Disability and the Transition to Early Adulthood…
Figure 2. Role probabilities conditional on latent pathway into adulthood, males, National Longitudinal Study of Adolescent Health.
0 0.25 0.5 0.75 1
17 18 19 20 21 22 23
E st im a te d R o le P ro b a b ilit y Age
A. School-to-Work Pathway (.30) 0 0.25 0.5 0.75 1
17 18 19 20 21 22 23
E st im a te d R o le P ro b a b ilit y Age
B. Prolonged Pathway (.20) 0 0.25 0.5 0.75 1
17 18 19 20 21 22 23
E st im a te d R o le P ro b a b ilit y Age
C. College-to-Work Pathway (.15) 0 0.25 0.5 0.75 1
17 18 19 20 21 22 23
E st im a te d R o le P ro b a b ilit y Age
D. Dropout-to-Work Pathway (.11) 0 0.25 0.5 0.75 1
17 18 19 20 21 22 23
E st im a te d R o le P ro b a b ilit y Age
E. School-to-Single Parenthood Pathway (.09) 0 0.25 0.5 0.75 1
17 18 19 20 21 22 23
E st im a te d R o le P ro b a b ilit y Age
F. School-to-Work-to-Family Pathway (.09) 0 0.25 0.5 0.75 1
17 18 19 20 21 22 23
E st im a te d R o le P ro b a b ilit y Age
G. Limited Transition Pathway (.06)
0 0.250.5 0.751
17 18 19 20 21 22 23
Erickson, Macmillan Disability and the Transition to Early Adulthood…
A fourth pathway shows limited transitions (see figures 1E and 2G). Here, all role probabilities are low (< .50) and trajectories flat indicating little degree attainment, low probabilities of labour force participation, and little movement into family roles. While women show limited role acquisition across the board, this pathway for males shows slow but steady increases in the likelihood of high school graduation
(≈ .60 by age 23). Overall, the prevalence of this
pathway is low (.09 for females and.06 for males). A fifth pathway involves school-to-single parenthood (see figures 1D and 2E). Here, high school completion is on time (≈1.0 by age 19) and accompanied by
steady movement into full-time work (> .75 and >.50 by age 19 for males and females, respectively). In subsequent years, there is a rapid increase (nearing 1.0) in the likelihood of parenthood. Importantly, the likelihood of marriage is considerably lower, less than .50 and .25 for females and males, respectively. This pathway is somewhat more prevalent among females (.12 versus .09).
The sixth pathway is more multidimensional and shows a school-to-work-to-family pathway that is quite different between sexes. For females (see Figure 1E), this pathway involves on-time high school completion (≈ 1.0 by age 19) followed by steady
increases in the likelihood of full-time work (≈.50 by age 23). Movement into family roles is also strong through the mid 20s with the likelihood of marriage increasing from .25 at age 19 to 1.0 at age 23 and parenthood increasing over the same ages. A similar pattern is seen for males, although prevalence is somewhat lower (.09 versus .12).
The final pathways are gender specific. Females show a school-to-family pathway (figure 1G) where a high likelihood of high school graduation in the late
teens (≈ 1.0) is coupled with steady increases in the
likelihoods of both marriage and parenthood. Almost all females in this pathway are married and have children by age 21. At the same time, labour force participation is more marginal and relatively flat through the early 20s (< .40 for full-time work). This pathway characterises approximately 7% of females.
For males, a final pathway involves dropout-to-work (figure 2D). Here, the likelihood of any degree completion is effectively zero, yet the likelihood of full-time work increases steadily through the late
teens and is substantial by the early 20s (≈ .75).
Additionally, movement into family roles is marginal
(≈ .25 or lower). This pathway represents 11% of males.
Disability and the transition to adulthood
We next estimate multinomial logistic regression models to predict (latent) pathway membership based on disability and other sociodemographic factors. These results are shown in tables 3 and 4 and show effects relative to the school-to-work pathway. For females (table 3), there are several notable findings. First, there are no significant effects for physical disability. Those with physical disabilities are not substantively different from those with no disability in the pathways they take into adulthood. In contrast, learning disability dramatically decreases the odds of a college-to-work pathway by 84% (e-1.86 = .16) and almost quadruples the odds of a limited transition pathway (e1.31 = 3.71). The consequences of cognitive disability effects are equally profound; odds of this pathway increase almost 11 times (e2.38 = 10.80).
Erickson, Macmillan Disability and the Transition to Early Adulthood…
Table 3: Unstandardised logit coefficient, females, National Longitudinal Study of Adolescent Health.
Pathway (Reference: School-to-work)
College-to-work Prolonged transition Limited School-to- single
parenthood School-to-work-to-family School-to-family Wald
Age 152.45**
17a 0.81* -0.22 -0.13 0.10 0.61 -0.24
(0.34) (0.25) (0.32) (0.28) (0.33) (0.39)
18a 1.37*** -0.66* -0.66 -0.07 0.71 0.21
(0.31) (0.31) (0.39) (0.32) (0.37) (0.43)
19a -5.45*** -0.21 0.11 -7.07*** 1.76 -6.01***
(1.63) (1.48) (1.91) (1.59) (1.56) (1.36)
Disability 40.06**
Physicalb -0.44 0.00 0.55 0.58 0.67 0.43
(0.55) (0.49) (0.54) (0.43) (0.49) (0.59)
Learningb -1.86* 0.12 1.31* -0.12 -1.12 0.39
(0.95) (0.51) (0.63) (0.50) (0.70) (0.82)
Mentalb 0.19 1.10 2.38** -0.44 0.31 0.48
(1.07) (0.78) (0.75) (0.90) (0.82) (1.16)
Race/Ethnicity
Blackc 0.08 0.71* 0.34 0.52 -1.70** -1.08*
33.98**
(0.31) (0.34) (0.38) (0.30) (0.54) (0.44)
Hispanicc -0.15 0.30 0.18 0.25 0.19 -0.74* 6.59
(0.31) (0.35) (0.40) (0.37) (0.34) (0.38)
Household and family
Single parentd -0.30 0.02 0.00 0.73* -0.32 -0.27 9.64
(0.28) (0.25) (0.31) (0.34) (0.42) (0.37)
Step parentd -1.07*** -0.60 -0.57 0.33 -0.44 -0.16
24.08**
(0.31) (0.36) (0.44) (0.25) (0.28) (0.33)
Povertye -0.12 -0.03 0.45 -0.12 0.23 0.04 5.08
Erickson, Macmillan Disability and the Transition to Early Adulthood…
Table 3: (Cont.)
Parent education
Less than high schoolf -1.24* -0.24 -0.12 -0.24 -0.25 -0.11 7.94
(0.50) (0.44) (0.45) (0.49) (0.33) (0.44)
Some collegef 0.12 -0.15 -0.77* -0.56* -0.25 -0.20 9.68
(0.24) (0.23) (0.32) (0.27) (0.25) (0.32)
College graduatef 1.12*** 0.72* -0.56 -0.32 -0.23 -1.31**
39.07**
(0.28) (0.23) (0.39) (0.35) (0.30) (0.58)
Neighbourhood characteristics
Urbang -0.61* 0.05 -0.18 -0.45 -0.27 -0.08 12.25
(0.21) (0.24) (0.26) (0.28) (0.29) (0.35)
Ruralg -0.17 -0.11 -0.69* -0.26 -0.07 0.16 5.09
(0.24) (0.26) (0.35) (0.28) (0.26) (0.31)
Good neighbourhoodh 0.25 0.25 -0.16 -0.70 -0.41 -0.51 6.56
(0.28) (0.23) (0.44) (0.49) (0.32) (0.43)
Poor neighbourhoodh -0.31 0.22 -0.04 0.45* 0.21 0.29 10.26
(0.26) (0.31) (0.32) (0.21) (0.34) (0.33)
Constant -1.16 -0.56 -0.52 -0.76 -0.85 -0.81 23.26
(0.35) (0.33) (0.35) (0.38) (0.34) (0.42)
* p < 0.05 ** p < 0.01
areference: age 16 breference: no disability creference: white dreference: not in poverty ereference: intact/other
Erickson, Macmillan Disability and the Transition to Early Adulthood…
Table 4: Unstandardised logit coefficients, males, National Longitudinal Study of Adolescent Health.
Pathway (Reference: School-to-work)
College-to-work Prolonged transition Limited School-to-single parenthood School-to-work-to- family Dropout-to- Work Wald
Age 272.51**
17a 0.36 -0.31 -0.45 0.79* 0.83* 0.02
(0.36) (0.23) (0.37) (0.38) (0.38) (0.27)
18a 0.73* -0.96** -0.66 1.16** 1.01* -0.10
(0.31) (0.32) (0.41) (0.41) (0.37) (0.34)
19a -5.70*** 0.44 -6.39*** 3.27** 2.46* -6.11***
(1.08) (1.12) (1.16) (1.01) (1.21) (1.09)
Disability 222.89**
Physicalb -0.31 -0.36 0.02 -0.77 -0.53 0.23
(0.50) (0.41) (0.51) (0.67) (0.50) (0.41)
Learningb -1.05 0.67 1.14 0.14 0.33 1.49**
(0.61) (0.55) (0.63) (0.55) (0.50) (0.39)
Mentalb -5.36*** 1.00 2.48*** 1.02 0.91 1.34*
(0.68) (0.87) (0.75) (0.65) (0.82) (0.57)
Race/Ethnicity
Blackc -0.45 0.54 0.70 0.12 -0.32 0.54 16.49*
(0.42) (0.31) (0.47) (0.32) (0.35) (0.32)
Hispanicc
-0.01 0.01 0.00 -0.28 0.16 0.29 2.69
(0.35) (0.34) (0.44) (0.35) (0.34) (0.29)
Household and family
Single parentd -0.65* -0.17 -0.31 -0.69* -0.61* -0.24 11.52
(0.27) (0.28) (0.37) (0.31) (0.27) (0.27)
Step parentd -0.67* -0.46 -0.47 -0.14 -0.06 -0.12 5.35
(0.34) (0.36) (0.48) (0.32) (0.40) (0.26)
Povertye -0.48 0.13 0.63* 0.59* 0.13 0.68* 17.29*
Erickson, Macmillan Disability and the Transition to Early Adulthood…
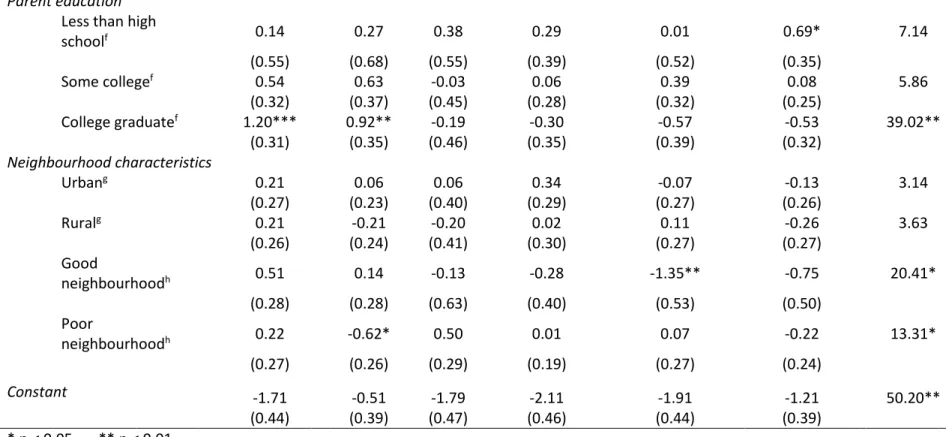
Table 4: (Cont.)
Parent education Less than high
schoolf 0.14 0.27 0.38 0.29 0.01 0.69* 7.14
(0.55) (0.68) (0.55) (0.39) (0.52) (0.35)
Some collegef 0.54 0.63 -0.03 0.06 0.39 0.08 5.86
(0.32) (0.37) (0.45) (0.28) (0.32) (0.25)
College graduatef 1.20*** 0.92** -0.19 -0.30 -0.57 -0.53 39.02**
(0.31) (0.35) (0.46) (0.35) (0.39) (0.32)
Neighbourhood characteristics
Urbang 0.21 0.06 0.06 0.34 -0.07 -0.13 3.14
(0.27) (0.23) (0.40) (0.29) (0.27) (0.26)
Ruralg 0.21 -0.21 -0.20 0.02 0.11 -0.26 3.63
(0.26) (0.24) (0.41) (0.30) (0.27) (0.27)
Good
neighbourhoodh 0.51 0.14 -0.13 -0.28 -1.35** -0.75 20.41*
(0.28) (0.28) (0.63) (0.40) (0.53) (0.50)
Poor
neighbourhoodh 0.22 -0.62* 0.50 0.01 0.07 -0.22 13.31*
(0.27) (0.26) (0.29) (0.19) (0.27) (0.24)
Constant -1.71 -0.51 -1.79 -2.11 -1.91 -1.21 50.20**
(0.44) (0.39) (0.47) (0.46) (0.44) (0.39)
* p < 0.05 ** p < 0.01
areference: age 16 breference: no disability creference: white dreference: not in poverty ereference: intact/other
Erickson, Macmillan Disability and the Transition to Early Adulthood…
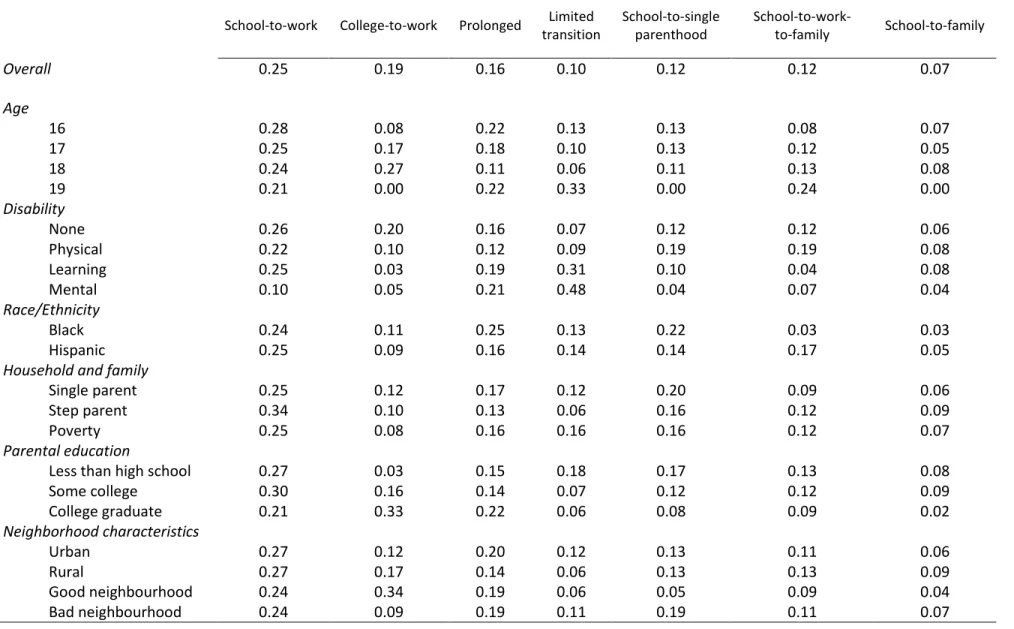
As coefficients from multinomial models are often difficult to interpret given the need to simultaneously incorporate two dimensions of comparison (i.e. reference categories for both the dependent and independent variables), we calculated estimated class probabilities conditional on selected covariates and make comparisons to well-recognised sociodemographic correlates. Beginning with females (see table 5), we first see the variable effects of disability in general for a school-to-work pathway. While the sample average is .25, those with no disability, a physical disability or a learning disability have a similar probability (.26, .22 and .25, respectively). In contrast, those with a cognitive disability have a substantially lower likelihood (.10). If we conclude that cognitive disability lowers the likelihood of a school-to-work pathway by .15 (.25-.10), it is instructive that none of the other covariates have this level of difference. For the college-to-work pathway, the overall probability is .19, yet only 10% of women with a physical disability, 3% of women with a learning disability, and 5% of women with a cognitive disability are found in this pathway. If cognitive disability reduces the probability of a college-to-work pathway by .14, it is again instructive that the effects of factors such as race and ethnicity, family structure, and poverty are much smaller (≅ ± .10) and the only differences that are
comparable in magnitude are those for parent’s education and neighbourhood quality. Even more striking than the ‘pull’ that disability exerts from advantageous pathways is the ‘push’ into the very disadvantaged limited transition pathway. Here, the overall probability is .10, yet .31 for those with a learning disability and .48 for those with a cognitive disability. In substantive terms, this implies that almost a third of those with a learning disability and almost half of those with a cognitive disability have the most disadvantageous pathway into adulthood.
None of the differences in likelihood associated with any of the other factors even come close in magnitude (≅ ± .08).
Estimated class probabilities for males also show the important intersection of pathway and disability type (see table 6). For the school-to-work pathway, the average likelihood of following this pathway into adulthood is .30. The comparable probability for those with a cognitive disability is only .11, almost two-thirds lower. This difference of .19 is several orders of magnitude greater than differences for any of the other factors considered (≅ ± 0.06). Differences
are even starker for the college-to-work pathway. While the overall likelihood of this pathway is .15, similar probabilities for those with learning and cognitive disabilities are .03 and .00. Such differences are considerably larger than those for race, family structure, socioeconomic origins, and neighbourhood characteristics.
Erickson, Macmillan Disability and the Transition to Early Adulthood…
Table 5. Estimated probabilities for latent pathways by covariate, females, National Longitudinal Study of Adolescent Health.
School-to-work College-to-work Prolonged transition Limited School-to-single parenthood School-to-work- to-family School-to-family
Overall 0.25 0.19 0.16 0.10 0.12 0.12 0.07
Age
16 0.28 0.08 0.22 0.13 0.13 0.08 0.07
17 0.25 0.17 0.18 0.10 0.13 0.12 0.05
18 0.24 0.27 0.11 0.06 0.11 0.13 0.08
19 0.21 0.00 0.22 0.33 0.00 0.24 0.00
Disability
None 0.26 0.20 0.16 0.07 0.12 0.12 0.06
Physical 0.22 0.10 0.12 0.09 0.19 0.19 0.08
Learning 0.25 0.03 0.19 0.31 0.10 0.04 0.08
Mental 0.10 0.05 0.21 0.48 0.04 0.07 0.04
Race/Ethnicity
Black 0.24 0.11 0.25 0.13 0.22 0.03 0.03
Hispanic 0.25 0.09 0.16 0.14 0.14 0.17 0.05
Household and family
Single parent 0.25 0.12 0.17 0.12 0.20 0.09 0.06
Step parent 0.34 0.10 0.13 0.06 0.16 0.12 0.09
Poverty 0.25 0.08 0.16 0.16 0.16 0.12 0.07
Parental education
Less than high school 0.27 0.03 0.15 0.18 0.17 0.13 0.08
Some college 0.30 0.16 0.14 0.07 0.12 0.12 0.09
College graduate 0.21 0.33 0.22 0.06 0.08 0.09 0.02
Neighborhood characteristics
Urban 0.27 0.12 0.20 0.12 0.13 0.11 0.06
Rural 0.27 0.17 0.14 0.06 0.13 0.13 0.09
Good neighbourhood 0.24 0.34 0.19 0.06 0.05 0.09 0.04
Erickson, Macmillan Disability and the Transition to Early Adulthood…
Table 6. Estimated probabilities for latent pathways by covariate, males, National Longitudinal Study of Adolescent Health.
School-
to-work College-to- work Prolonged transition Limited
School-to- single parenthood
School-to-work-to-
family out-to-work Drop
Overall 0.30 0.15 0.20 0.06 0.09 0.09 0.11
Age
16 0.31 0.10 0.30 0.09 0.04 0.04 0.12
17 0.30 0.15 0.22 0.05 0.08 0.08 0.11
18 0.31 0.19 0.11 0.05 0.12 0.11 0.11
19 0.13 0.00 0.23 0.00 0.45 0.19 0.00
Disability
None 0.32 0.17 0.20 0.05 0.09 0.09 0.09
Physical 0.39 0.14 0.14 0.06 0.06 0.07 0.15
Learning 0.20 0.03 0.21 0.10 0.07 0.08 0.31
Mental 0.11 0.00 0.14 0.33 0.12 0.08 0.21
Race/Ethnicity
Black 0.27 0.09 0.22 0.12 0.10 0.06 0.15
Hispanic 0.28 0.12 0.15 0.08 0.09 0.11 0.18
Household and family
Single parent 0.34 0.09 0.22 0.08 0.07 0.06 0.14
Step parent 0.36 0.11 0.17 0.04 0.10 0.10 0.11
Poverty 0.27 0.05 0.15 0.11 0.12 0.08 0.21
Parental education
Less than high school 0.24 0.06 0.12 0.13 0.11 0.08 0.26
Some college 0.30 0.13 0.21 0.05 0.09 0.11 0.10
College graduate 0.29 0.25 0.28 0.03 0.06 0.04 0.05
Neighborhood characteristics
Urban 0.29 0.13 0.20 0.08 0.11 0.08 0.12
Rural 0.32 0.16 0.16 0.05 0.09 0.11 0.11
Good neighbourhood 0.30 0.25 0.29 0.03 0.06 0.02 0.04
Erickson, Macmillan Disability and the Transition to Early Adulthood…
Conclusions
As a stratifying condition, sociologists have paid markedly less attention to disability as determinant of life chances than other social factors (notable exceptions include Janus, 2009; Wells et al. 2003). Our research advances understanding of disability and its life course implications in two key ways. We extend previous work by considering the interconnections of multiple roles over time with different disabilities and by comparing the relative effects of disability in the transition to adulthood against multiple agents of stratification (race, family status, and geography). At the outset, we offered several hypotheses that directly assessed different views on whether and how disability influences the transition to adulthood.
A first hypothesis (H1) focused on school-to-work pathways and suggested that cognitive disability rather than physical disability should matter, particularly for pathways involving post-secondary education. Our results provide considerable support. Those with a physical disability were no more or no less likely to have these pathways into adulthood. Our second hypothesis (H2) suggested that those with a cognitive disability should be more likely to drop out of school. Though we did not find this pathway among females, both learning and cognitive disability significantly increased the likelihood of this pathway among men. While hypothesis H3 suggested that learning and physical disability should increase and cognitive disability should decrease the likelihood of a prolonged transition, no form of disability influenced the likelihood of this pathway. A fourth (H4) hypothesis focused on pathways that include movement into family. Here, we focused on the school-to-family pathway among females and suggested that physical disability should be particularly significant. Again, we find no support for this expectation. One possible explanation for this may be that the relationship between disability and attractiveness is much looser than we anticipated (cf. Rojahn et al., 2008) or that changing roles for women that increasingly involve education, particularly higher education, and employment attenuate the importance of attractiveness in relationships (Oppenheimer, 1988).
Finally, we drew upon the life course principle of cumulative disadvantage to suggest that disability can undermine the processes by which individuals make successive role transitions and formulate multifaceted pathways into adulthood. As such, we hypothesised that disability decreases the likelihood of a school-to-work-to-family pathway (H5) and increases the likelihood of a limited transition pathway (H6) and that such effects should be more substantial for cognitive disabilities. While cognitive disability did not influence the likelihood of a school-to-work-to-family pathway, the probability of a limited transition pathway is much greater for those with learning and cognitive disabilities for both women and men and the magnitudes of the predicted probabilities are greater for cognitive disability than learning disability. Indeed, roughly half of men and women with cognitive disabilities have limited transitions. Consistent with life course principles of cumulative advantage and disadvantage, both learning and cognitive disabilities appear uniquely detrimental to one’s ability to actualise multidimensional pathways in the transition to adulthood.
Erickson, Macmillan Disability and the Transition to Early Adulthood…
attainment, slower movement into work, and marginal movement into family roles.
Our emphasis on the interconnection of pathways, institutions and disability also indicates that physical disabilities are comparatively less consequential in the structuring of life course pathways. While we recognise limitations of statistical power, there is simply less differentiation across pathways in early adulthood based on physical disability relative to cognitive disabilities. From an institutional standpoint, the marginal effects for physical disability may indicate that institutional and cultural accommodations have been more successful with respect to physical disability. Such accommodations are largely technical or engineering matters and may be more easily realised with respect to physical rather than cognitive disabilities. Also possible, the life course consequences of physical disability are mitigated by rehabilitation and physical therapy through adolescence and early adulthood, although this is largely speculative. This is not inconsistent with our emphasis on institutional accommodations that facilitate educational and occupational accomplishment among those with physical disabilities.
Our work is not without limitations. For one, our focus on the multidimensional, dynamic character of the transition to adulthood trades scope for depth. As such, we focus on the early and most complex period of life course transitions. Extending analyses may reveal additional pathways (e.g.
college-to-work-to-family). Further, our empirical models do not investigate the qualities of schooling, jobs and relationships; this is an important avenue of future work in understanding of the links between disability and the life course and between health and attainment more generally. This will provide an important extension of inquiry into life course capitalisation processes (Hagan, 1998) and mechanisms of cumulative advantage and disadvantage (Willson, Shuey, & Elder, 2007).
Erickson, Macmillan Disability and the Transition to Early Adulthood…
References
Arnett, J. J. (2004). Emerging adulthood: The winding road from the late teens through the twenties. New York: Oxford University Press.
Barker, M., Power, C., & Roberts, I. (1996). Injuries and risk of disability in teenagers and young adults. Archives of Diseases in Childhood, 75, 156–158. https://doi.org/10.1136/adc.75.2.156
Buchmann, M. (1989). The script of life in modern society: Entry into adulthood in a changing world. Chicago: University of Chicago Press.
Carter, E. W., Austin, D., & Trainor, A. A. (2012). Predictors of postschool employment outcomes for young adults with severe disabilities. Journal of Disability Policy Studies, 23, 50–63.
https://doi.org/10.1177/1044207311414680
Chantala, K., & Tabor, J. (1999). Strategies to perform a design-based analysis using the Add Health Data. Chapel Hill: Carolina Population Center, University of North Carolina at Chapel Hill. Retrieved from
http://www.cpc.unc.edu/projects/addhealth/files/weight1.pdf
Elder Jr, G. H. (1985). Life course dynamics: Trajectories and transitions, 1968–1980. Ithaca, NY: Cornell University Press.
Feingold, A. (1990). Gender differences in effects of physical attractiveness on romantic attraction: A
Comparison across five research paradigms. Journal of Personality and Social Psychology, 59, 981–993. https://doi.org/10.1037/0022-3514.59.5.981
Furstenberg Jr, F.F. (2010). On a new schedule: Transitions to adulthood and family change. The Future of Children, 20, 67–87. https://doi.org/10.1353/foc.0.0038
Furstenberg Jr, F. F., Kennedy, S., Mcloyd, V. V., Rumbaut, R. G., & Settersten Jr, R. A. (2004). Growing up is harder to do. Contexts, 3, 33–42. https://doi.org/10.1525/ctx.2004.3.3.33
Hagan, J. (1998). Life course capitalization and adolescent behavioral development. In R. Jessor (Ed.), New perspectives on adolescent risk behavior (pp. 499–517). New York: Cambridge University Press. https://doi.org/10.1017/CBO9780511571138.015
Hagenaars, J. A. (1988). Latent structure models with direct effects between indicators: local dependence models. Sociological Methods & Research, 16(3), 379–405.
https://doi.org/10.1177/0049124188016003002
Hagernaars, J. A., & McCutcheon, A. L. (2002). Applied latent class analysis. Cambridge: Cambridge University Press. https://doi.org/10.1017/CBO9780511499531
Hogan, D. P. (1978). The variable order of events in the life course. American Sociological Review, 43, 573–586. https://doi.org/10.2307/2094780
Hogan, D. P., & Astone, N. M. (1986). The transition to adulthood. Annual Review of Sociology, 12, 109–130. https://doi.org/10.1146/annurev.so.12.080186.000545
Janus, A. L. (2009). Disability and the transition to adulthood. Social Forces, 88, 99–120. https://doi.org/10.1353/sof.0.0248
Kerckhoff, A. (2000). Transition from school to work in comparative perspective. In M. Hallinan (Ed.), Handbook of the sociology of education (pp. 453–474). New York: Kluwer Academic/Plenum.
Lindstrom, L., Harwick, R. M., Poppen, M., & Doren, B. (2012). Gender gaps: Career development for young women with disabilities. Career Development and Transition for Exceptional Individuals, 35 (2), 108–117. https://doi.org/10.1177/0885728812437737
Macmillan, R. (2005). The structure of the life course: Standardized? Individualized? Differentiated? Advances in Life Course Research, Volume 9. New York: Elsevier.
Macmillan, R., & Copher, R. (2005). Families in the Life Course: Interdependency of roles, role configurations, and pathways. Journal of Marriage and Family, 67, 858–879.
Erickson, Macmillan Disability and the Transition to Early Adulthood…
Macmillan, R., & Eliason, S. (2003). Characterizing the life course as role configurations and pathways: A latent structure approach. In J. T. Mortimer & M. J. Shanahan (Eds.), Handbook of the Life Course (pp. 529– 554). New York: Kluwer Academic/Plenum. https://doi.org/10.1007/978-0-306-48247-2_24
Marini, M. M., (1984). The order of events in the transition to adulthood. Sociology of Education, 57, 63–84
Oppenheimer, V. K. (1988). A theory of marriage timing. American Journal of Sociology, 94, 563–591. https://doi.org/10.1086/229030
Osgood, D. W., Ruth, G., Eccles, J. S., Jacobs, J. E., & Barker, B. L. (2008). Six paths to adulthood: Fast starters, parents without careers, educated partners, educated singles, working singles, and slow starters. In R. Settersten Jr, F. Furstenberg Jr, & R. G. Rumbaut (Eds.), On the frontier of adulthood: Theory, research, and public policy (pp. 356–395). Chicago: University of Chicago Press.
Osgood, D. W., Foster, M. E., Flanagan, C., & Ruth, G. R. (Eds.). (2005). On your own without a net: The transition to adulthood for vulnerable populations. Chicago: University of Chicago Press.
https://doi.org/10.7208/chicago/9780226637853.001.0001
Palloni, A. (2006). Reproducing inequalities: Luck, wallets, and the enduring effects of childhood health. Demography, 43, 587–615. https://doi.org/10.1353/dem.2006.0036
Percy, S. L. (2001). Challenges and dilemmas in implementing the Americans with Disabilities Act: Lessons from the first decade. Policy Studies Journal, 29(4), 633–640.
https://doi.org/10.1111/j.1541-0072.2001.tb02115.x
Priestley, M. (2003). Disability: A life course approach. Cambridge: Polity.
Raftery, A. E. (1995). Bayesian Model Selection in social research. Sociological Methodology, 25, 111–163. https://doi.org/10.2307/271063
Rindfuss, R. R., Swicegood, C. G., & Rosenfeld, R. A. (1987). Disorder in the life course: How common and does it matter?. American sociological review, 785–801. https://doi.org/10.2307/2095835
Rojahn, J., Komelasky, K., & Man, M. (2008). Implicit attitudes and explicit ratings of romantic attraction of college students toward opposite-sex peers with physical disabilities. Journal of Developmental and Physical Disabilities, 20, 389–397. https://doi.org/10.1007/s10882-008-9108-6
Ross, A., Schoon, I., Martin, P., & Sacker, A. (2009). Family and non-family role configurations in two British cohorts. Journal of Marriage and Family, 71, 1–14. https://doi.org/10.1111/j.1741-3737.2008.00576.x Ross, C.E., & Mirowsky, J. (2001). Neighborhood disadvantage, disorder, and health. Journal of Health and Social
Behavior, 42, 258–276
Sanford, C., Newman, L., Wagner, M., Cameto, R., Knokey, A. M., & Shaver, D. (2011). The post high school outcomes of young adults with disabilities up to 6 years after high school. Key findings from the National Longitudinal Transition Study-2 (NLTS2). Menlo Park, CA: SRI.
Shanahan, M. (2000). Pathways to adulthood in changing societies: Variability and mechanisms in Life Course Perspective. Annual Review of Sociology, 26, 667–692. https://doi.org/10.1146/annurev.soc.26.1.667 Shandra, C. L. (2011). Life-course transitions among adolescents with and without disabilities: A longitudinal
examination of expectations and outcomes. International Journal of Sociology, 41 (1), 67–86. https://doi.org/10.2753/IJS0020-7659410104
Stevens, G., Owens, D., & Schaefer, E. C. (1990). Education and attractiveness in marriage choices. Social Psychology Quarterly, 53, 62–70. https://doi.org/10.2307/2786870
Stewart, D., Law, M., Young, N. L., Forhan, M., Healy, H., Burke-Gaffney, J., & Freeman, M. (2014). Complexities during transitions to adulthood for youth with disabilities: Person-environment interactions. Disability and Rehabilitation, 36(23), 1998–2004. https://doi.org/10.3109/09638288.2014.885994
Svetaz, M. V., Ireland, M., & Blum, R. (2000). Adolescents with learning disabilities: Risk and protective factors associated with emotional well-being. Journal of Adolescent Health, 27, 340–348.
Erickson, Macmillan Disability and the Transition to Early Adulthood…
Tisdall, K. (2001). Failing to make the transition? Theorising the ‘Transition to Adulthood’ for young disabled people. In M. Priestley (Ed.), Disability and the Life Course: Global perspectives (pp. 167–178). Cambridge: Cambridge University Press. https://doi.org/10.1017/CBO9780511520914.016 U.S. Department of Education. (2015). National Institute on Disability and Rehabilitation Research.
U.S. Department of Education. (2010). https://www2.ed.gov/about/offices/list/ocr/docs/edlite-FAPE504.html. Van Naarden Braun, K., Yeargin-Allsopp, M., & Lollar, D. (2006). A multi-dimensional approach to the transition
of children with developmental disabilities into young adulthood: The acquisition of adult social roles. Disability and Rehabilitation, 28(15), 915–928. https://doi.org/10.1080/09638280500304919
Vermunt, J. & Magidson, J. (2005). Latent gold 4.0: User’s Guide. Belmont, Massachusetts: Statistical Innovations Inc.
Vles, W. J., Steyerbeg, E. W., Essink-Bot, M. L., Van Beeck, E. F., Meeuwis, J. D., & Leenen, L. P. (2005).
Prevalence and determinants of disabilities and return to work after major trauma. Journal of Trauma and Acute Care and Surgery, 58(1), 126–135. https://doi.org/10.1097/01.TA.0000112342.40296.1F Wagner, M., Newman, L., Cameto, R., Garza, N., & Levine, P. (2005). After high school: A first look at the
postschool experiences of youth with disabilities. Menlo Park, CA: SRI.
Wells, T., Sandefur, G., & Hogan, D. (2003). What happens after the high school years among young persons with disabilities? Social Forces, 82, 803–832. https://doi.org/10.1353/sof.2004.0029
Williams, D. R., & Collins, C. (1995). US socioeconomic and racial differences in health: patterns and explanations. Annual Review of Sociology, 21, 349–386.
https://doi.org/10.1146/annurev.so.21.080195.002025
Willson, A. E., Shuey, K. M., & Elder Jr, G. H. (2007). Cumulative advantage processes as mechanisms of inequality in life course health. American Journal of Sociology, 112, 1886–1924.
https://doi.org/10.1086/512712
WHO: World Health Organization. (2016). Disability and health. Retrieved from http://www.who.int/mediacentre/factsheets/fs352/en/
Zola, I. K. (1993). Disability statistics, what we count and what it tells us. Journal of Disability Policy Studies, 4, 9– 39. https://doi.org/10.1177/104420739300400202
Endnotes
1. Notably, to the best of our knowledge, we are the first to use the Add Health data to study disability in the transition to adulthood in this way; past research utilised the National Educational Longitudinal Surveys (NELS:88) and the National Longitudinal Transition Studies (1 and 2).