BMI over the life course and hearing ability at age 45
years: a population-based cohort study
Russell Ecob
MRC Hearing and Communication Group, UCL Ear Institute, London
Shirley Russ
UCLA Center for Healthier Children, Families and Communities, Los Angeles
Adrian Davis
MRC Hearing and Communication Group, UCL Ear Institute, London
(Received January 2011 Revised July 2011)
Abstract
Previous research on anthropometric factors and adult hearing loss has found relationships, in separate studies, to birthweight and contemporary BMI. However no study has examined data on BMI over the life course. This paper uses data from the 1958 British Birth Cohort to examine relationships between BMI (both in childhood and adulthood), changes in BMI between adjacent age waves, and hearing thresholds at 1 kHz and 4 kHz obtained by audiometric examination at age 45 yrs. Body Mass Index (BMI) in adulthood, but not in childhood, was associated with increased hearing threshold levels at both 1 kHz and 4 kHz at age 45yrs. Two further models examine the effect of changes in BMI between successive waves and adult hearing thresholds, firstly adjusting for childhood hearing loss and a range of further childhood factors (including birthweight, family history of hearing loss, mother’s weight, childhood social class) and secondly adjusting in addition for noise, current social class, current systolic blood pressure and diabetes, current smoking and drinking. In the first model, increases in BMI at age intervals throughout the life course, over both childhood and adulthood, were independently associated with increased hearing threshold levels at both frequencies in mid-life, largest relationships being shown at both frequencies to increasing BMI in adolescence and in early adulthood. These relationships generally persisted in the second model, though were reduced more at earlier ages (pre 23 yrs). Noise at work attenuates the relationship between BMI change and mid-life hearing threshold, more so at 4 kHz than at 1 kHz and for BMI change at older ages. The relationship between 1 standard deviation of BMI change between 11 and 16 years, and mid-life hearing threshold was close to one-third that of noise at work (>5yrs vs. none). Future studies should be carried out to determine the mechanisms underlying these relationships and whether these relationships strengthen as the cohort ages further.
Introduction
Hearing impairment is the most common sensory deficit in developed countries (Steel 2000). The prevalence of hearing impairment rises throughout the life course, affecting approximately 1-2 per thousand newborns (Russ et al 2003; Fortnum et al 2001; Van Naarden et al 1999), 30% of adults over the age of 65yrs (Gates et al 1990) and 50% of adults over the age of 75 yrs (Davis 1995). Age-related hearing impairment undoubtedly has a genetic component, but environmental factors are also important. Occupational noise exposure is a well documented risk (Kurmis 2007) but there is growing evidence also for recreational noise exposure (Clark 1991). Social class at birth and in adulthood also contribute (Power et al 2007). Smoking has been associated in several studies (Nomura et al 2005), with the notable exception of the Framingham cohort (Gates et al 1993). Although chronic alcohol abuse has also been implicated as a risk (Rosenhall et al 1993), moderate alcohol intake may actually be protective (Fransen, et al 2008). These findings taken together indicate that hearing impairment in mid-life and old age may not be an “inevitable” consequence of ageing, but is associated with a range of lifestyle factors, many of which are amenable to change with potential hearing health benefits.
Recent studies have suggested a relationship between anthropometric factors and hearing ability. Fransen et al, using pooled data from nine European centres, demonstrated an association between high body mass index (BMI) and hearing threshold levels at both low and high frequencies in adults between the ages of 53 and 67yrs (Fransen et al 2008). High body weight was associated with hearing threshold levels at low frequencies only. Fransen also found that taller people had, on average, better hearing, replicating a previous finding by Barrenas (Barrenas et al 2003, 2005a). In a separate study, Barrenas found an association between being born short or light for gestational age and higher hearing threshold levels at age 17-24yrs among Swedish male conscripts (Barrenas et al 2005b). Barrenas also demonstrated an association between overweight and obesity and sensori-neural hearing impairment (SNHI) especially if born light for gestational age. These results were broadly consistent with SNHI resulting from mechanisms suggested by the thrifty phenotype
hypothesis, with SNHI as a possible clinical feature of the metabolic syndrome (Barrenas et al 2005b).
Even a modest association between BMI and hearing ability has potentially important clinical implications. The prevalence of overweight and obesity in adults, as measured by BMI, is high, affecting 65% of the US population (Hedley et al 2004). These individuals are not currently recognized as being at increased risk of poorer hearing, so do not receive targeted hearing surveillance or screening. At the population level, an association between BMI and hearing has implications for the likely prevalence of age-related hearing impairment among the “baby boomer” generation. The association also raises the question of whether weight reduction could decrease the risk of hearing impairment in middle and old age. Consequently, it is important to determine whether this association can be confirmed. In addition neither Fransen’s study, limited to cross-sectional data, nor Barrenas’ study, which analyzed birthweight together with height and weight at the time of conscription, could address the important question of whether changes in BMI at key ages in the life course predict later hearing thresholds sufficiently well to warrant targeted preventive interventions at individual or population level.
Montgomery et al (2010) have examined possible associations between hearing impairment and BMI from a different perspective. They demonstrated that hearing impairment in childhood was associated with BMI in both childhood and adulthood in female, but not male members of the 1970 British Cohort Study (BCS70). Osika and Montgomery (2008) also found that greater clumsiness at age 7 and 11 years was associated with later obesity. They suggested that childhood hearing loss could be a marker of impaired neurologic function, and a possible component of a “pre-obesity syndrome.”
wide range of associated risk factors including social class, smoking, alcohol, occupational noise exposure, family history of hearing impairment and full audiometric examination in childhood at ages 7, 11, 16yrs, as well as a proxy measure for conductive hearing impairment (impairment resulting from disorders in the external or middle ear) in childhood. We aimed to examine the relationship between (a) BMIs throughout the life course and (b) changes in BMI at age intervals throughout the life course, and hearing threshold at age 45yrs both in a marginal model and after adjusting for a range of risk factors in this large population sample. We hypothesized that increasing BMI would be associated with worse hearing at low and high frequencies in mid-life, and that increases in BMI particularly earlier in the life course would be independently associated with worse hearing in mid life.
Methods
Study sample
Participants were originally enrolled in the Perinatal Mortality Survey (PMS) of all those born in England, Scotland and Wales during one week in March 1958 (Power 1992) and followed up throughout childhood and adulthood by interview, at ages 7, 11, 16, 23, 33yrs and most recently at 44-45yrs (Biomedical Wave). A total of 17,415 individuals participated in the PMS from an eligible sample of 17,638. Immigrants with the same birth dates were recruited up to age 16yrs (n = 920), giving 18,558 eligible study participants (Total Cohort Sample). At 44 - 45yrs, 12,069 participants, still in contact with the study, and who at 42yrs had not required a proxy interview (of family member or carer due to learning disability for example), were invited to a clinical examination undertaken in their home by a trained nurse. Of these, 9,377 participants were seen between September 2002 and March 2004, 8894 of these having a valid hearing measure at both 1 and 4 kHz. The 45yr sample remains broadly representative of the surviving cohort (Power et al 2006).
Variables used in the analysis
Dependent variable: pure tone audiometry at age 44-45yrs
Pure tone audiometry was performed by air conduction in each ear, at frequencies of 1 kHz and 4 kHz according to the British Society of Audiology recommended procedure (British Society of
Audiology 1981).In the analysis, Hearing Threshold Level (HTL) in the better ear at age 45yrs is used throughout. Log scores (logged after addition of a term chosen to minimise skewness in the logged distribution) were used, both for the dependent variable and for childhood hearing threshold measures. For adult hearing the transformation was log (y+16.6) for 1 kHz and log (y+20.6) for 4 kHz.
Using this transformation the residuals were found to be reasonably normally distributed in contrast to a pronounced skewness using raw scores (Ecob 2008b).
Exposures
1. Anthropometric variables
Heights and weights were measured by trained medical personnel at ages of 7, 11, 16, and 45yrs and at age 33 by trained interviewer, but were self-reported at 23 and 42yrs.
At 7, 11, and 16yrs, the heights were measured by stadiometer to the nearest inch, and subjects were weighed in their underclothes to the nearest pound. At age 33yrs, height was measured without shoes, using a stadiometer reading to the nearest centimetre, and weight was measured in their underclothes to the nearest pound, using Salter portable scales. These agreed with measured heights in a contemporary national sample (Power et al 1997). Standing height at age 45yr was measured to the nearest millimetre, using a Leicester portable stadiometer placed on a hard floor. Weight was measured to the nearest 0.1 kg in light clothing with shoes removed. Height at 45yrs, when coded as being deemed unreliable by rater, was treated as missing.
Data at all waves on both height and weight, were examined for outlying observations which may be indicative of errors of measurement or transcription. In practice, few obvious errors were found. However, the self-reported heights at age 42yrs, when compared with height measures from adjacent waves, contained a number of errors. For this reason and because the measure was close in time to that at 45 yrs, the study team elected not to include measures derived from heights and weights at age 42 yrs in further analyses.
2. Noise exposure
Duration of occupational noise was assessed at age 45yrs by the following, self-completed, retrospective question “Have you ever worked in a place that was so noisy that you had to shout to be heard?” This was classified as (i) no, never, (ii) yes, for less than 1 yr, (iii) yes, for 1-5yrs, (iv) yes, for over 5yrs. Level (iv) was associated with about 90 dBA (Lutman et al 2008). NCDS has no data on exposure to non-occupational noise in adulthood or childhood.
3. Tobacco and alcohol exposure
The drinking measure used is the number of standard units of alcohol consumed in a typical day at age 45yrs (“how many standard drinks do you have on a typical day”), coded into 4 categories (‘>= 7 drinks per day’, ’3 to 6 drinks per day’, ‘<3 drinks per day’, ‘non-/ex-drinker/non response’). These categories are based on the distribution of alcohol consumption in the cohort. Non- and ex drinkers were not coded separately due the small numbers in these categories. Smoking (‘current’ in contrast to ‘ex-smoker’, ‘never smoked’) is measured at age 42yrs. For current smokers the following categorisation is used; number of cigarettes smoked per day in three categories (1-9, 10-20, 20+) and for ex-smokers, a combination of years since quitting and number smoked (<1 cigarette/day, >1 cigarette/day - last > 5yrs ago, >1 cigarette/day - last <= 5yrs ago).
4. Adult socio-economic position
Adult socio-economic position (referred to as current social class) is based on the participant’s current or most recent occupation at 42yrs (or at 33yrs if data were unavailable at 42yrs; n = 1558). Six Registrar General’s occupational groups were used: professional (I), managerial/technical (II), other non-manual (IIInm), skilled manual (IIIm), partly skilled (IV) and unskilled manual (V).
Further control variables
1. Childhood HTL and conductive hearing impairment in childhood
Childhood HTL (Hearing Threshold Level) was assessed by Pure Tone audiometry (performed by air conduction) in each ear, at frequencies 0.25, 0.5, 1, 2, 4, 8 kHz, at three ages (7, 11, 16yrs).These were combined into an optimal measure for prediction of adult hearing threshold levels at 1 and 4 kHz separately. This constituted a weighted combination of hearing ability at each age and frequency, comprising the polynomial relation to an
independently determined ‘base’ frequency (2 kHz for 1 kHz outcome, 4 kHz for 4 kHz outcome, being that frequency with the highest correlation with outcome) and the contrasts with other frequencies at a given age. The final model includes 10 terms over the 3 yrs in childhood HTL for each outcome (Ecob 2008a,b). The consistent relationships between adult HTL and childhood HTL at corresponding frequencies at each age (adjusted), provide some reassurance as to the reliability and validity of the childhood measures.
Two variables, at ages 7 and 11yrs, provided proxy measures of present or past middle ear dysfunction. At 7yrs the variable used was “signs of past, present otitis media” from nurse observation at school (‘yes’ versus ‘no’ and ‘don’t know’) and, at 11yrs, otoscopic examination of each ear, (‘inflamed’, ‘scarred’, ‘abnormal-other’ versus ‘normal’, ‘obscured by wax’ and ‘not examined’). On this basis, prevalence of middle ear dysfunction was 7.2% and 6.6% at ages 7 and 11yrs respectively. The retrospective element of the 7 yr measure allows some adjustment for conductive hearing impairment up to this age.
3. Socio-economic position in childhood
Socio-economic position in childhood (referred to as social class of origin) is based on father’s occupation at birth in 1958, (or at age 7yrs if data were unavailable at birth; n = 422). The same coding is used as for adult social class (above) but here, those with no male head of household in childhood were grouped with class V.
4. Family history of hearing impairment
This is measured by a question on the biomedical wave (age 45yrs). “Did any of your parents, children, brothers or sisters have great difficulty in hearing before age 55?” (‘yes’ versus ‘no’ or ‘don’t know’).
5. Birthweight
Birth weight was recorded in pounds and ounces by the midwife in charge of the delivery, and has been converted to kilograms. Birthweight was adjusted for gestational age by sex and expressed in percentiles (<10, 10-24, 25-50, 51-75, 76-90, >90%). Where this information was incomplete (13.1% given valid adult hearing measures) this was treated as missing and so imputed.
6. Further variables
response (self-assessment) as to whether ever had diabetes (yes/no) at age 42yrs. Noise at test was a binary variable with the following values; ‘Background noise at acceptable level for test’,’ Background noise distracting’. Systolic blood pressure was the mean taken over three readings at age 45yrs. Details of all measurement processes for the current biomedical wave are given in the Technical Report for this wave (Fuller et al 2006).
Further possible explanatory variables not included in the models
We examined, in relation to adult HTL, childhood illnesses, accidents, and hospital admissions, but found no relation after adjustment for childhood HTL. We therefore excluded these variables from the final model. We also examined possible confounding effects of pregnancy on mother’s weight and found only marginal effects.
Statistical Analyses
We assessed the relationship between (a)
BMI and (b) rates of change (per year) in BMI at
age intervals throughout the life course (7yrs,
7-11yrs, 11-16yrs, 16-23yrs, 23-33yrs, 33-45yrs)
and log hearing threshold at age 45yrs by
multiple regression.
Two regression models were constructed to
estimate effects of changes in BMI on log
hearing threshold at age 45yrs.
The main model (1) adjusted for early life
variables that were potential confounders i.e.
gender, family history of hearing impairment,
mother’s weight at birth, social class at birth,
childhood hearing impairment, middle ear
dysfunction in childhood, as well as noise at
time of adult test (binary). Additional
adjustment was made for birthweight in order
to allow for possible ‘thrifty phenotype’ effects
(Barrenas et al 2003, 2005a).
An additional, and subsidiary, model (2)
adjusted in addition for factors, measured in
adulthood, which may play a mediating role:
current social class, noise exposure at work,
current smoking, drinking, diabetes and systolic
blood pressure. All models were implemented
in Stata 9.2 (StataCorp 2005).
In each of the models, simple BMI at age
7yrs was included, together with terms for
differences in BMI between subsequent ages.
This approach to the treatment of repeated
measures has been used widely in life course
research, to cope primarily with the
multi-collinearity of repeated measures giving easily
interpretable estimates (de Stavola et al 2006).
Another application to BMI over age is found in
Schienkowitz et al (2006).
A substantial amount of missing data
occurs both for audiometric data in childhood
and for BMI throughout the life course:
where there were valid hearing data at 4 kHz
at age 45yrs, data were missing for hearing
threshold for 4 kHz in childhood for 30%,
22%, and 28% of cases at 7, 11 and 16yrs
respectively, and for data on BMI for 8%,
18%, 20%, 37%, 15%, and 3% of cases at ages
7, 11, 16, 23, 33, 45yrs respectively.
All analyses were run on a dataset with
missing data on all variables multiply imputed
having 20 cycles (Sterne et al 2009; Kenward
and Carpenter 2007). This is implemented in
Stata 9.2 by the procedures
ice
and
Micombine
(Royston 2005).
The imputation scheme used was as
follows:
For each of the childhood ages, the HTL at
each frequency (2, 4 kHz) was imputed using
the HTL at other childhood ages, together
with other hearing related variables
(conductive hearing loss etc) at that age. All
polynomial terms in the base frequency at
any age were imputed using polynomial
terms of lower degree at that age. All
polynomial contrasts at a given age were
imputed using lower degree polynomial
contrasts at that age and all terms in base
frequency in that age.
imputed using sex, social class of origin,
current social class, noise and current
drinking. Height and weight at each age were
imputed separately, and BMI constructed
from the imputed values: variables used were
birthweight, current height, heights and
weights at all other ages and the current age
(height for weight, weight for height), current
drinking and smoking and other current
variables (fibrinogen, blood pressure,
diabetes etc). These variables, and in addition
height and weight at all ages, were used to
impute adult hearing loss. Only those data
with a productive assessment of hearing at
age 45yrs at both frequencies were used.
Mother’s weight at birth was imputed using
sex and social class at birth. Birthweight was
imputed using heights and weights at each
age, family history of hearing loss, sex, social
class at birth, and adult hearing loss at both
frequencies (1, 4 kHz). By the nature of the
construction of the current drinking measure,
this has full data so no imputation was
necessary.
Analyses were weighted for estimated
probability of response, defined as productive
interview for those issued and eligible, as
predicted by sex, childhood hearing loss, social
class at birth and heights and weights at both 7
and 33 yrs.
Before imputation only 46% of the sample
with valid data at 45yrs for 4 kHz had complete
HTL data at all childhood ages, and 33% had full
anthropometric data. Sensitivity examination to
a range of multiply imputed models with
varying model complexity and number of
replications was examined, and found very
similar results in all models. Nominal sample
size, which includes imputed values, is 8,894.
Results
Figure 1a. Relation of mean BMI (kg/metres2 ) to age, separately by sex
15
20
25
30
me
a
n
BMI
7 yrs 11 yrs 16 yrs 23 yrs 33 yrs 45 yrs
age
male female
1b. Relation of standard deviation BMI (kg/metres2) to age, separately by sex
2
3
4
5
6
st
. d
e
v.
BMI
7 yrs 11 yrs 16 yrs 23 yrs 33 yrs 45 yrs
age
male female
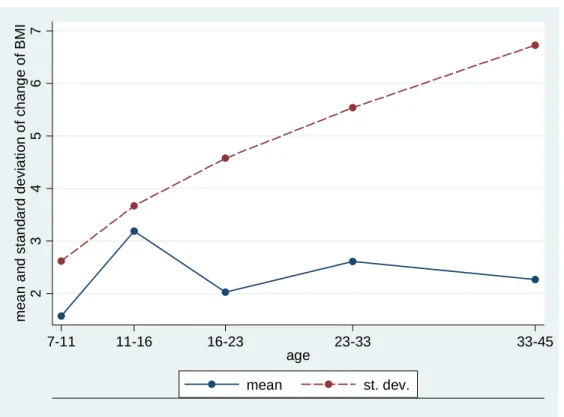
Figure 2 shows changes in BMI (mean, sd) at different ages. Age intervals are centred at the mid-range for interpretability. The change of BMI is positive at all ages, with some tendency to decrease at all ages after puberty (Figure 2a). The standard
Figure 2. Relation of mean and standard deviation of change of BMI (kg/metres2) to age
2
3
4
5
6
7
m
ea
n a
nd s
tan
da
rd de
v
ia
ti
on o
f c
h
ang
e o
f B
M
I
7-11 11-16 16-23 23-33 33-45
age
mean st. dev.
Table 1 shows the relationship between BMI separately at each age and hearing threshold at 1 kHz and 4 kHz. This preliminary model adjusts for noise at test and gender only. Coefficients are back-transformed, for ease of interpretability, to relationships of BMI to raw (not logged) hearing threshold. Higher BMI at age 16yrs and above (4 kHz)
and at age 23yrs and above (1 kHz), is associated with higher (worse) log hearing threshold. Effects at 4 kHz are between around 2 and 4 times those at 1 kHz, over the ages considered. Coefficients show a tendency to increase with age with maximum relationship at the age of the hearing measurements (45 yrs).
Table 1. Regression coefficient (95% CI) of hearing threshold (dBHL) at 45yrs on BMI (kg/metres2) at separate ages.
1 kHz
4 kHz
BMI, 7yrs -0.005 (-0.095, 0.084) 0.086 (-0.078, 0.249)
BMI, 11yrs 0.001 (-0.061, 0.063) 0.081 (-0.035, 0.198)
BMI, 16yrs 0.040 (-0.008, 0.088) 0.126 (0.030, 0.223)
BMI, 23yrs 0.081 (0.035, 0.126) 0.200 (0.119, 0.282)
BMI, 33yrs 0.094 (0.062, 0.125) 0.171 (0.113, 0.229)
Tables 2a and 2b show the regression of log
hearing threshold in adulthood on BMI at 7yrs,
and subsequent changes in BMI between
successive waves, in the two models described
above. Table 2a shows this relationship at 1 kHz
and Table 2b at 4 kHz.
Model 1, which adjusts for birthweight, noise
at test and early life factors (family history of
hearing impairment, conductive hearing loss in
childhood, hearing thresholds in childhood,
mother’s weight at child’s birth, and social class
at birth) and noise at test, shows a positive and
statistically significant relationship between
change (increase) in BMI at ages 11-16 and above
(both frequencies) and higher log hearing
threshold (worse hearing) at 45yrs of age with
the strongest relationships (shown earlier at 4
kHz than at 1 kHz) with change in adolescence (4
kHz) and in early adulthood, up to age 33) (1
kHz). These relationships of BMI change to
hearing threshold continue to be found at both
frequencies in Model 2, which also adjusts for all
remaining variables (occupational noise exposure
and current social class, smoking and alcohol
intake, diabetes and systolic blood pressure).
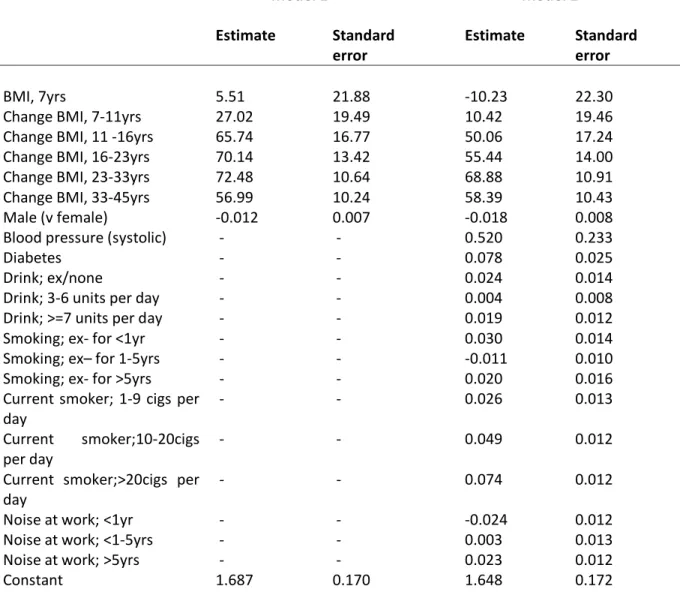
Table 2a. Regression coefficients of Log hearing threshold at 1 kHz on BMI (*104) in the 2 models.
Model 1 Model 2
Estimate Standard
error Estimate Standard error
BMI, 7yrs 5.51 21.88 -10.23 22.30
Change BMI, 7-11yrs 27.02 19.49 10.42 19.46
Change BMI, 11 -16yrs 65.74 16.77 50.06 17.24
Change BMI, 16-23yrs 70.14 13.42 55.44 14.00
Change BMI, 23-33yrs 72.48 10.64 68.88 10.91
Change BMI, 33-45yrs 56.99 10.24 58.39 10.43
Male (v female) -0.012 0.007 -0.018 0.008
Blood pressure (systolic) - - 0.520 0.233
Diabetes - - 0.078 0.025
Drink; ex/none - - 0.024 0.014
Drink; 3-6 units per day - - 0.004 0.008
Drink; >=7 units per day - - 0.019 0.012
Smoking; ex- for <1yr - - 0.030 0.014
Smoking; ex– for 1-5yrs - - -0.011 0.010
Smoking; ex- for >5yrs - - 0.020 0.016
Current smoker; 1-9 cigs per
day - - 0.026 0.013
Current smoker;10-20cigs
per day - - 0.049 0.012
Current smoker;>20cigs per
day - - 0.074 0.012
Noise at work; <1yr - - -0.024 0.012
Noise at work; <1-5yrs - - 0.003 0.013
Noise at work; >5yrs - - 0.023 0.012
Constant 1.687 0.170 1.648 0.172
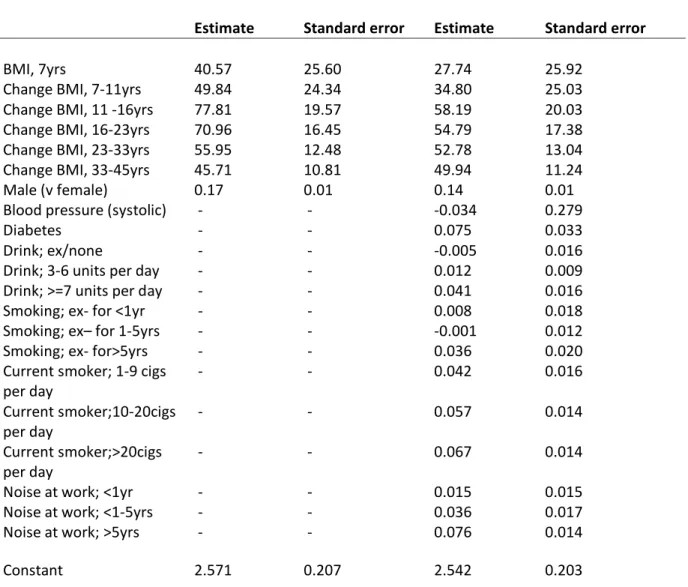
Table 2b. Regression coefficients of Log hearing threshold at 4 kHz on BMI (*104) in the two models.
Model 1 Model 2
Estimate Standard error Estimate Standard error
BMI, 7yrs 40.57 25.60 27.74 25.92
Change BMI, 7-11yrs 49.84 24.34 34.80 25.03
Change BMI, 11 -16yrs 77.81 19.57 58.19 20.03
Change BMI, 16-23yrs 70.96 16.45 54.79 17.38
Change BMI, 23-33yrs 55.95 12.48 52.78 13.04
Change BMI, 33-45yrs 45.71 10.81 49.94 11.24
Male (v female) 0.17 0.01 0.14 0.01
Blood pressure (systolic) - - -0.034 0.279
Diabetes - - 0.075 0.033
Drink; ex/none - - -0.005 0.016
Drink; 3-6 units per day - - 0.012 0.009
Drink; >=7 units per day - - 0.041 0.016
Smoking; ex- for <1yr - - 0.008 0.018
Smoking; ex– for 1-5yrs - - -0.001 0.012
Smoking; ex- for>5yrs - - 0.036 0.020
Current smoker; 1-9 cigs
per day - - 0.042 0.016
Current smoker;10-20cigs
per day - - 0.057 0.014
Current smoker;>20cigs
per day - - 0.067 0.014
Noise at work; <1yr - - 0.015 0.015
Noise at work; <1-5yrs - - 0.036 0.017
Noise at work; >5yrs - - 0.076 0.014
Constant 2.571 0.207 2.542 0.203
Notes. All Change BMI measures are divided by 104 in order that coefficients are easily readable
When transformed back to original scale, at 1 kHz the largest effect, of 0.039 dB in model 1 (reducing to 0.036 dB in model 2) occurs at age 23-33 yrs. At 4 kHz the largest effect, of 0.102 dB in model 1 (reducing to 0.074 dB in model 2) occurs at age 23-33 yrs.
In terms of the increase per 1 standard deviation of the change scale, at 1 kHz this corresponds to, at age 23-33 yrs, 0.222 dB in model 1 (reducing to 0.203 dB in model 2). At 4 kHz the largest effect, of 0.378 dB in model 1 (reducing to 0.274 dB in model 2) occurs at age 23-33 yrs. For comparison, the effect of noise at work (>= 5 yrs versus none) is 1.00 dB.
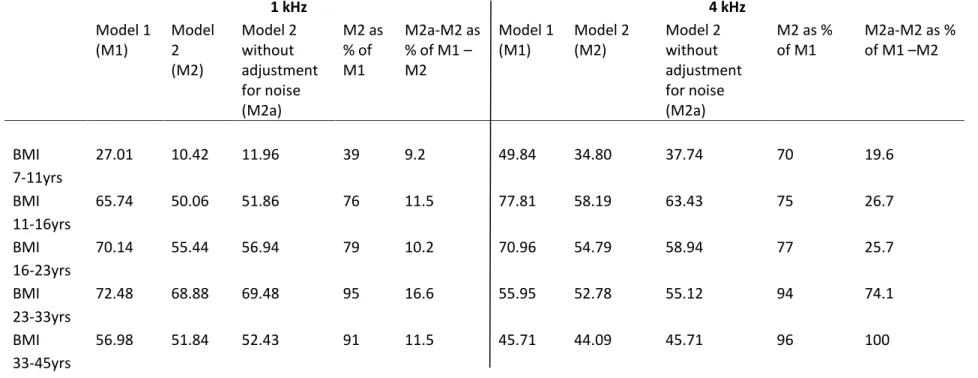
The contribution of noise at work to the difference between model 1 and model 2 is examined
Table 3. Contribution of noise at work to difference between the two models.
1 kHz 4 kHz
Model 1
(M1) Model 2 (M2)
Model 2 without adjustment for noise (M2a)
M2 as % of M1
M2a-M2 as % of M1 – M2
Model 1
(M1) Model 2 (M2) Model 2 without adjustment for noise (M2a)
M2 as %
of M1 M2a-M2 as % of M1 –M2
BMI 7-11yrs
27.01 10.42 11.96 39 9.2 49.84 34.80 37.74 70 19.6
BMI 11-16yrs
65.74 50.06 51.86 76 11.5 77.81 58.19 63.43 75 26.7
BMI 16-23yrs
70.14 55.44 56.94 79 10.2 70.96 54.79 58.94 77 25.7
BMI 23-33yrs
72.48 68.88 69.48 95 16.6 55.95 52.78 55.12 94 74.1
BMI 33-45yrs
56.98 51.84 52.43 91 11.5 45.71 44.09 45.71 96 100
The effect of adjustment for noise (cols 5, 10 of Table 3) is seen to be greater for 4 kHz than for 1 kHz at all ages, and shows a tendency to be greater at higher ages. Noise at work is responsible for the majority of the difference between models 1 and 2 for effect of BMI change 23-33 yrs on hearing threshold at 4 kHz.
Finally, separate models tested for an interaction between changes in BMI between successive ages and, separately, both noise at work (>5yrs versus <= 5yrs) and gender, and found no interactions with any of the BMI changes for either hearing outcome frequency with either noise at work or gender.
Discussion
Higher BMIs in adulthood, at ages 23, 33, and 45 yrs, in univariate analyses, were associated with higher hearing thresholds (worse hearing) at both 1 kHz and 4 kHz at age 45 yrs. Change (increase) in BMI in successive age waves from 11 yrs upwards, after adjustment for confounding early life factors (Model 1), was also associated with worse hearing at age 45yrs for both sexes at both frequencies. At both 1 and 4 kHz, changes in unit BMI between ages 11 and 33 yrs showed the strongest partial relationships to hearing in adulthood.
These relationships largely persisted, though were attenuated after taking into account, in Model 2, the effects of further variables - occupational noise exposure, current social class, current drinking, smoking, diabetes and systolic blood pressure. These variables, being generally more recent in time than the BMI change variables, are potential candidates for a mediating role.
The inclusion of smoking, drinking and noise at work in model 2, was to aid in the search for mechanisms behind the BMI change/ hearing loss relationship, and to determine the extent to which these may or may not overlap with variables which are causes, correlates or sequelea of these. We however make no claim of a biological pathway between these variables.
We examined the effect of adjustment for noise per se, by comparing coefficients in model 2 re-run without the adjustment for noise, with model 2, expressed as the percentage of the difference between model 1 and model 2. The effect of noise at
work on the coefficient of BMI change 23-33 yrs on hearing threshold at 4 kHz, is responsible for the majority of the difference between models 1 and 2.
The increase in the partial relationships to BMI at later ages (post 33yrs) in model 2 is due principally to the adjustment for current smoking. Smoking is inversely related to BMI (particularly at later ages) and positively related to hearing impairment. These findings suggest that increases in BMI peri-pubertally and beyond, have relatively long-term influences on hearing ability in mid-life.
In order to check for any bias in results due to any errors of measurement in the self-assessed weight and height at age 23, we re-ran analyses without this measure, now using the change in BMI from age 16 to age 33 to replace those from age 16 to age 23 and from age 23 to age 33, and found very comparable results, the maximum relationships occurring, as before, between ages 16 and 33 (models 1,2) for 1 kHz outcome and between ages 11 and 16 (models 1,2) for 4 kHz outcome.
In a comparable model (model 2), a 1 standard deviation change in BMI from 11 to 16 yrs has 27% of the effect (transformed back to raw, dB, scale) of exposure to noise for greater than 5yrs, compared with the effect of no work-based exposure on hearing threshold levels at 4 kHz. Effects of current smoking and drinking, occupational noise exposure, and current social class are found, even after controlling for BMI over the life course.
Strengths and limitations
To our knowledge, this is the first analysis to examine the effects of increases in BMI throughout the life course on hearing ability in mid-life. The findings are based on a large, probably unique, cohort with extensive pure-tone audiometry results, together with a wide range of anthropometric, early childhood, social and environmental variables (Ecob et al, 2008a). The British 1958 Birth Cohort is population-based, consisting of all births during one week in March 1958, so findings should have a high degree of generalizability to the mid-life British population.
unskilled manual class (IV or V) compared with the original sample. However, the difference was small (Power et al 2007; Atherton et al 2008).Missing data and attrition, however, represent a significant study limitation, which we have addressed as far as possible through use of multiple imputation and weighting.
Lack of a measure of recreational noise exposure was a further limitation. Changing patterns of social and environmental noise exposure e.g. use of MP3 players and iPods across generations, could limit the generalizability of our findings to later birth cohorts.
Comparison with other studies
The finding of a relationship between BMI and hearing thresholds is consistent with that from a cross-sectional study using an amalgamated dataset from nine European audiological centres (Fransen et al 2008). This study had a comparable number of subjects to the British 1958 Birth Cohort (4.083 vs 9.023), with an older and wider age range (53-67yrs vs 45-46yrs) but relied on a mix of population-based and clinic-based samples.
The European dataset included measures of both air and bone conduction, allowing exclusion of cases with probable conductive hearing impairment, and a measure of recreational noise exposure (gunshot noise). However, they lacked data on social class, family history of hearing impairment, and early childhood risks, and were unable to examine relationships with BMI across the life course.
Barrenas’s large prospective longitudinal register study of 245,000 Swedish conscripts aged 17-24yrs, also demonstrated an association between current overweight/obesity and sensorineural hearing threshold (Barrenas et al 2005b) although no data were available on potential social and environmental confounders. Unlike Barrenas, we found no association between being light for gestational age at birth and hearing impairment in early adulthood. It would be of interest to analyze the British 1958 Birth Cohort to determine whether a subgroup of infants who were light for gestational age at birth, but subsequently overweight or obese in adulthood (as suggested by thrifty phenotype hypothesis (Barrenas et al 2003)), showed increased risk of hearing impairment. Hearing threshold in the Swedish conscripts was also associated with short stature (Barrenas et al 2005a), a finding consistent with other
reports (e.g. Burr et al 2008). We found a similar
association, but only for males, at 1 kHz (but not at 4 kHz).
Comparisons between the present study, and that of Montgomery et al (2010), are challenging, as the studies examine different relationships. Montgomery demonstrated relationships between childhood BMI and childhood hearing impairment, and between adult BMI and childhood hearing impairment, even when childhood BMI and social factors were controlled for. They proposed that certain exposures might impact both neurological development and the risk of adult obesity, but also acknowledge that it is plausible that early hearing impairment could itself predispose in some way to the subsequent development of obesity. Similarly, Osika and Montgomery’s (2008) finding of an association between poor coordination in childhood and subsequent obesity, could be explained by clumsiness discouraging participation in sports and exercise, resulting in increased risk of obesity.
The present study examines relationships between adult hearing ability and BMI while controlling for childhood hearing impairment. We found no evidence of a difference in pattern of relationship between BMI and hearing threshold by gender. We demonstrated a relationship between adult hearing threshold and BMI in adulthood even when controlling for childhood hearing impairment, however additional analyses beyond the scope of the present study are needed to determine if childhood hearing impairment was associated with adult BMI in our study cohort.
evidence for menstrual fluctuations in auditory perception (Haggard and Gaston 1978) that could point to a hormonal effect on hearing ability. Our finding of increasing BMI in adolescence, in association with poorer adult hearing ability, could also implicate a hormonal mechanism.
Prolonged psychological stress has been demonstrated to result in chronic activation of glucocorticoid receptors, potentially damaging hearing through detrimental effects on the central nervous system (Montgomery et al 2010). Canlon et al (2007) demonstrated the influence of the hypothalamic-pituitary-adrenal (HPA) axis on the auditory system, so a “stress effect” on hearing appears biologically plausible. Psychological stress is also known to be associated with childhood obesity (Dockray et al 2009) and weight gain. Maternal stress, depression and insecure parent attachment styles have also been associated with overweight in young children, and could conceivably have a negative impact on the young child’s neurological stimulation and function (Montgomery et al 2010). In this model, poor maternal health is a common antecedent of both obesity in the child (and subsequent adult) as well as poorer hearing ability. Obesity is also known to be associated with oxidative stress (Henderson et al 2006; Le Prell et al 2011) and development of chronic inflammation (Fernandez-Sanchez et al 2011). These factors may in turn influence CSF pressure, changing CO2 / pH values that impact along the cochlear aqueduct and have an effect primarily in the high frequency turn of the cochlea, where the aqueduct enters the cochlea. Ferguson et al (1998) have shown that CSF pressure affects OAE function independently of middle ear pressure changes, at least over the short term. More studies are needed to confirm that these changes occur in the medium to long term, consistent with these results.
There is increasing understanding that much hearing loss has a genetic basis. Certain genes could predispose to both obesity and hearing loss, and some genes could be selective for high frequency loss. It is also possible that the efficiency of the cochlear mechanism is attenuated in the presence of high BMI, and that effects could differ between frequencies at different periods of development. Different biological mechanisms underly relationships
at the two different hearing frequencies. Future studies should address some of these hypotheses.
In his recent review “Fair Society, Healthy Lives” (2010), Sir Michael Marmot suggests that “giving children the best start in life” be the first recommendation for reducing health inequalities. Our findings support this life course view of health development, suggesting that greater attention to early life factors may be needed to improve mid-life hearing ability. The same report calls for a strengthening of the role and impact of ill health prevention, including improving programmes that address the causes of obesity across the social gradient. (Department of Health and Department for Children, Schools and Families (2010). At present, only 4% of NHS funding is spent on prevention. Studies such as ours, that demonstrate associations between earlier life risks and later health impacts, support the policy argument that inaction on early life risks is no longer affordable. Our study also highlights the importance of addressing rising BMI in adolescence. Although recent data suggest that obesity prevalence rates in children under 10 yrs are levelling off, prevalence rates in 11-15 year olds remain high and have actually risen in boys (Health Survey for England 2008). Our findings strengthen the importance of maintaining a focus on health promotion as children enter the teenage years (Department of Health 2010). In addition, 2008 data show that 61% adults in England are now overweight or obese, a trend that is likely to impact hearing ability at population level (Health Survey for England 2008). To explore the full extent of health associations with common conditions such as obesity, we also need more research, such as this study, that crosses disciplines, linking a range of risks with mid-life health attributes.
Conclusions
health preventive strategies could pay dividends in improved hearing ability in mid-life. Future research should focus on the impact of earlier life risk prevention strategies on mid-life hearing ability,
elucidating possible mechanisms for observed relationships and on the strength of these relationships as the NCDS population continues to age.
Acknowledgements
We are grateful to all participants in the 2002-2004 biomedical follow up and to nurses, office and laboratory staff who contributed to the successful completion of the study. Adrian Davis and Pauline Smith were responsible for the inclusion of the hearing measures in the Biomedical wave of the 1958 Birth Cohort. Medical Research Council Grant G0000934, awarded under the Health of the Public Initiative. Dr Russ was supported in part by U.S. Health Resources and Services Administration (HRSA)-Maternal and Child Health Bureau (MCHB) Co-operative Agreement UA6MC19803 for the MCH Lifecourse Research Network (LCRN). The study sponsor had no role in study design; in the collection, analysis and interpretation of data; in the writing of the report; and in the decision to submit an article for publication. The researchers were independent from the funder. Ethical approval for the medical examination of the 1958 British Birth Cohort was obtained from South East MREC (ref 01.1/44).
References
Atherton K, Fuller E, Shepherd P, Strachan DP, Power, C. (2008) Loss and representativeness in a biomedical survey at age 45 yrs, 1958 British Birth Cohort. Journal of Epidemiology and Community Health, 62, 216-223.
Bainbridge KE, Hoffman HJ and Cowie CC. (2008) Diabetes and hearing impairment in the United States,
audiometric evidence from the National Health and Nutrition Examination Survey, 1999 to 2004. Annals of Internal Medicine, 49, 1-10. (Epub)
Barrenas ML, Bratthall A and Dahlgren J. (2003) The thrifty phenotype hypothesis and hearing problems. British Medical Journal, 327, 1199-1200.
Barrenas ML, Bratthall A and Dahlgren J. (2005a) The association between short stature and sensorineural hearing loss. Hearing Research, 205(1-2), 123-130.
Barrenas ML, Jonsson B, Tuvemo T, Hellstrom PA and Lundgren M. (2005b) High risk of sensorineural hearing loss in men born small for gestational age with and without obesity or height catch-up growth, a prospective longitudinal register study on birth size in 245,000 Swedish conscripts. Journal of Clinical and Endocrinal Metabolism, 90, 4452-4456.
British Society of Audiology. (1981) Recommended procedures for pure tone audiometry using a manually operated instrument. British Journal of Audiology, 15, 213-6.
Burr H, Lund SP, Sperling BB, Kristensen TS and Poulsen OM. (2005) Smoking and height as risk factors for prevalence and 5-yr incidence of hearing loss. A questionnaire-based follow-up study of employees in Denmark aged 18-59 yrs exposed and unexposed to noise. International Journal of Audiology, 44, 531-9. Canlon B, Meltser I, Johansson P and Tahera Y. (2007) Glucocorticoid receptors modulate auditory sensitivity to
acoustic trauma.
Clark WW. (1991) Noise exposure from leisure activities, a review. Journal of the Acoustical Society of America,
90, 175-181.
Davis AD. (1995) Hearing in Adults. Whurr, London.
Department of Health and Department for Children, Schools and Families. (2010) Healthy Weight, Healthy Lives: Two Years On. Department of Health and Department for Children, Schools and Families. Accessed 02.08.10 at
Dockray S, Susman EJ and Dorn LD. (2009) Depression, cortisol reactivity and obesity in childhood and adolescence. Journal of Adolescent Health, 45, 344-50.
Ecob R, Sutton G, Rudnicka A, Smith P, Power C, Strachan D and Davis A. (2008a) Is the relation of socio-economic position on hearing loss from childhood to middle age explained by noise, smoking and drinking behaviour? International Journal of Audiology, 47, 100-108.
Ferguson MA, Davis AC and Lovell EA. (1998) CSF and posture effects on transient evoked otoacoustic emissions. In A Reid, B Marchbanks and A Ernst. eds. Intracranial and inner ear physiology and pathophysiology. Pp 35-43.Whurr, London.
Fernandez-Sanchez A, Madrigal-Sanillan E, Bautista M, Esquivel-Soto J, Morales-González A, Esquivel-Chirino C , Durante-Montiel I, Sánchez-Rivera G, Valadez-Vega C and Morales-González JA. (2011) Inflammation, oxidative stress and obesity. International Journal of Molecular Science, 12, 3117-32.
Fortnum HM, Summerfield AQ, Marshall DN, Davis AC and Bamford JM. (2001) Prevalence of permanent childhood hearing impairment in the United Kingdom and implications for universal neonatal hearing screening, questionnaire based ascertainment study. British Medical Journal, 323, 536-540.
Fransen E, Topsakal V, Hendrickx E, factors for age-related hearing impairment and moderate alcohol consumption is protective, a European population-based multicenter study. Journal of the Association for Research into Otolaryngology, 264-76; discussion 261-3.
Fuller E, Power C, Shepherd P and Strachan DP. Technical report on the National Child Development Study
biomedical survey 2002–2004. CLS Technical Report Institute of Education, London.
Gates GA, Cooper JC Jr, Kannel WB and Miller NJ. (1990) Hearing in the elderly, the Framingham cohort, 1983-1985. Part 1. Basic audiometric test results. Ear and Hearing, 11, 247-256.
Gates G, Cobb J, D'Agostino R and Wolf P. (1993) The relation of hearing in the elderly to the presence of cardiovascular disease and cardiovascular risk factors. Archives of Otolaryngology Head Neck Surgery,
119, 156-161.
Haggard M and Gaston JB. (1978) Changes in auditory perception in the menstrual cycle. British Journal of Audiology, 12, 105-18.
Health Survey for England (2008). Accessed 02.08.10 at
Hedley AA, Ogden CL, Johnson CL, Carroll MD, Curtin LR and Flegal KM. (2004) Prevalence of overweight and obesity among US children, adolescents, and adults, 1999-2002. Journal of the American Medical Association, (23), 2847-2850.
Henderson D, Bielefeld EC, Harris KC and Hu BH. (2006)
Ear and Hearing, 27, 1-19.
Hulcrantz M, Simonoska R and Stenberg AE. (2006) Estrogen and hearing, a summary of recent investigations.
Acta Otolaryngology. 126, 10-14.
Researc
Kurmis AP and Apps SA. (2007) Occupationally-acquired noise-induced hearing loss, a senseless workplace hazard. International Journal of Occupational Medicine and Environmental Health, 20, 127-136.
damage to the inner ear and hearing loss.
Lutman ME, Davis AC and Ferguson MA. (2008) Epidemiological Evidence for the Effectiveness of the Noise at Work Regulations, RR669, Sudbury, UK, Health and Safety Executive, 98pp. (Research Report RR669)
Marmot M. (2010) Fair Society, Healthy Lives: The Marmot Review Strategic review of health Inequalities in England post-2010. Accessed 24.07.10 at
Montgomery SM, Osika W, Brus O and Bartley M. (2010) Sex differences in childhood hearing impairment and adult obesity. Longitudinal and Life Course Studies, 1, 359-370.
Nomura K, Nakao M, Morimoto T. (2005) Effect of smoking on hearing loss, quality assessment and meta-analysis. Preventive Medicine, 40,138-144.
Osika W and Montgomery SM. (2008) Physical control and coordination in childhood and adult obesity. Longitudinal Birth Cohort Study. British Medical Journal, 337, online 2008 August
12. doi:
Power C. (1992) A review of child health in the 1958 birth cohort, National Child Development Study. Paediatric and Perinatal Epidemiology, 6, 81-110.
Power C, Lake JK and Cole TJ. (1997) Body Mass Index and height from childhood to adulthood in the 1958 British birth cohort. American Journal of Clinical Nutrition, 66, 1094-101.
Power C and Elliott J. (2006) Cohort Profile, 1958 British birth cohort (National Child Development Study).
Power C, Atherton K, Strachan DP, Shepherd P, Fuller E, Davis A, Gibb I, Kumari M, Lowe G, McFarlane, G, Rahi J, Rodgers B and Stansfeld S. (2007) Life-course influences on health in British adults, effects of socio-economic position in childhood and adulthood. International Journal of Epidemiology, 36, 532-9. Rosenhall U, Sixt E, Sundh V and Svanborg A. (1993) Correlations between presbyacusis and extrinsic noxious
factors. Audiology, 32, 234-243.
Royston P. (2005) Multiple imputation of missing values, update of ICE. The Stata Journal, 5, 1-16.
Russ SA, Poulakis Z, Barker, M, Wake, M, congenital hearing loss in Victoria, Australia. International Journal of Audiology, 42, 385-390.
de Stavola, B, Nitsch D, Silva I, de dos Santos S, McCormack V,
(2006) Statistical Issues in Life Course Epidemiology. American Journal of Epidemiology, 136, 1-13. Schienkowitz A, Schulze MB, Kroke A and Boeing H. (2006) Body Mass Index history and risk of type 2 diabetes,
results from the European Prospective Investigation into Cancer and Nutrition (EPIC) – Potsdam Study.
American Journal of Clinical Nutrition, 84, 427-433.
obesity in England from 1995 to 2007 and projections of prevalence to 2015. Journal of Epidemiology and Community Health, 64,167-74.
StataCorp. (2005) Stata Statistical Software: Release 9. College Station, TX: Statacorp LP.
Steel KP. (2000) Science, medicine, and the future; new interventions in hearing impairment. British Medical Journal, 320, 622-625.
Stenberg AE, Wang H, Fish J, Schrott-Fischer A, Sahlin L and Hultcrantz M. (2001) Estrogen receptors in the normal adult and developing human inner ear and in Turner’s syndrome. Hearing Research, 157, 87-92. Sterne JAC, Carlin JB, Spratt M, Royston P, Kenward MG, Wood AM and Carpenter JR. (2009) Multiple
imputation for missing data in epidemiological and clinical research: potential and pitfalls. British Medical Journal, 309, 1128- 338.
Van Naarden K, Decoufle P and Caldwell K. (1999) Prevalence and characteristics of children with serious hearing impairment in metropolitan Atlanta, 1991-1993. Pediatrics, 103, 570-575.