91
A new classification method based on pairwise
Support Vector Machine (SVM) for facial age
estimation
Mohammad Ali Beheshti-Nia1*, Zahra Mousavi 2 1
Department of Industrial Engineering,Faculty of Engineering, Semnan University, Semnan, Iran
2
Faculty of Computer engineering, Amir Kabir University, Tehran, Iran
[email protected], [email protected]
Abstract
This paper presents a practical algorithm for facial age estimation from frontal face image. Facial age estimation generally comprises two key steps including age image representation and age estimation. The anthropometric model used in this study includes computation of eighteen craniofacial ratios and a new accurate skin wrinkles analysis in the first step and a pairwise binary support vector machine (SVM) in the second one. Anthropometric model is the first model that has been provided; however, it hasn't been much considered and even hasn't been applied on any large database so far. Therefore, the algorithm is applied on FG-Net database and the average of the absolute errors (MAE) and cumulative score (CS) measures are provided to make comparison with other approaches much easier. Experimental results show that the proposed method can give MAE=6.34 and CS (<=10) =81.14 using a pairwise binary tree support vector machine (SVM).
Keyword: Data mining; Classification; Support Vector Machine; SVM; facial age estimation.
1 – Introduction
Human faces include a significant amount of information on individual's age, gender, ethnicity, etc. Over the last decade, facial age estimation has been an interesting topic due to the fact that it yields extensive real-world applications in image processing and computer vision (FuGuo, Huang, 2010). This fact reveals meaningful potential for designing automatic facial age estimation systems. The facial age estimation can be applied in many industries; such as security and military industries as well as any organization which need accurate facial identification such as police stations and forensics.
Kwon and Lobo (1999) conducted a study based on craniofacial development theory and skin wrinkle analyses. The main idea of the craniofacial research is to provide an appropriate mathematic model to give an account of the growth of a person's head from infancy to adulthood. They categorized 47 facial images into three categories: babies, young/middle-aged
*corresponding author
ISSN: 1735-8272, Copyright c 2017 JISE. All rights reserved Journal of Industrial and Systems Engineering
Vol. 10, No. 1, pp 91-107 Winter (January) 2017
92
adults and seniors. Six ratios were computed from distances on frontal face images and are used to draw a distinction between babies and adults. Then, young adults were distinguished from seniors using skin wrinkle analyses. The authors have only reported the results from using each ratio and didn’t present their work's overall performance.
Dehshibi and Bastanfard (2010) have also used some ratios and wrinkle analyses to fall 498 facial images into four categories: under 15, 16-30, 31-50 and over 51. They used seven ratios and three wrinkle densities as input nodes of a feed forward back propagation neural network (FFBPNN) with two hidden layers. Although, the performance of their system is claimed to be 86.64%, some drawbacks should be noticed: for one thing, since the essence of wrinkle densities in various parts of face is different, it is required to take them into consideration in distinctive ways while they considered all these three wrinkle areas the same and applied canny filter on all of them. For another thing, the FFBPNN isn't stable and in different runs gives different answers. Therefore, the responds are not strenuously reliable.
Aforementioned key issues motivate us to use anthropometric model comprises computation of eighteen craniofacial ratios to precisely recognize babies and young adults and a novel accurate skin wrinkles analysis to perfectly distinguish senior adults in different ages, in the image representation phase and a pairwise binary tree support vector machines (support vector machines) algorithm in the age estimation phase to label each person’s image with the exact age. Since the FG-Net is a baseline database for comparisons with many existing age estimation techniques (FuGuo, Huang, 2010), the algorithm proposed in this paper is applied on this database and compared using manifold technique. The benefits of this method will be confirmed with experimental results.
The contributions in this paper are as follow:
• An anthropometric model is applied, using 18 ratios from landmarks on human faces. Other researches in the literature use less number of ratios. For example Dehshibi and Bastanfard (2010) use 7 ratios.
• A wrinkle densities analysis is used based on wrinkle regions at forehead, cheekbone and eye corner. Since the essence of wrinkles in the various regions is different, for example, wrinkles in the forehead region are horizontal whereas they are diagonal in the cheek region, they are considered in different ways in this study. While other researches use identical approach to analysis of wrinkles at the all mentions regions.
• A new approach is used for age estimation, in which an anthropometric model is combined by a pairwise binary support vector machine (SVM). No research in the literature uses this approach.
This paper is organized as follows. In section 2, the methods used for ratios and wrinkles extraction and classification are described in more details. Section 3 gives a clear illustration of the experimental results and the evaluation and comparison with manifold. Finally, a concise conclusion is given in section 4.
2- Literature review
A great number of researches have been carrying out on the issue so far. Generally, these works naturally include two main modules: Age image presentation and age estimation.
Based on the literature, age image representation is divided into five models, included: (1) Anthropometric model (Kwon and Lobo, 1999), (Dehshibi and Bastanfard, 2010) and (Koruga et al., 2011): based on measurements and proportion of human face beside face wrinkle densities. (2) Active appearance model (CootesEdwards, Taylor, 2001), (LanitisTaylor, Cootes, 2002) and (LanitisDraganova, Christodoulou, 2004): based on the statistical face model. (3) Aging pattern subspace (Geng et al., 2006), (GengZhou, Smith-Miles, 2007): based on AGing pattErn Subspace (AGES) method. (4): Age manifold (FuXu, Huang, 2007), (GuoFuDyer et al., 2008) and (ChaoLiu, Ding, 2013): based on the use of a common aging trend or pattern to utilize a manifold embedding. (5): (Hayashi et al., 2002), (El Dib and Onsi, 2011): Aging related facial feature extraction based on both global and local features.
93
Age estimation algorithms comprise three techniques: (1) Classification (Kwon and Lobo, 1999), (Dehshibi and Bastanfard, 2010), (UekiHayashida, Kobayashi, 2006), (Hironobu Fukai, 2007): each age is considered as a class label. Different kinds of classification are used for this purpose for instance, ANN, KNN and SOM. (2) Regression (Fu and Huang, 2008), (FuXu, Huang, 2007), (Yan et al., 2007), (Shuicheng et al., 2008), (Liu et al., 2014): each age is considered as a number in the output. (3) Hybrid approach (GuoFuHuang et al., 2008), (GuoFuDyer et al., 2008), (El Dib and Onsi, 2011), (Guodong et al., 2008): This approach is a combination of classification and regression.
As mentioned before, anthropometric model is the first model in field of facial age estimation; nonetheless, few works are done using this model and none of them used regression to provide an exact age label for each person. Furthermore, due to the fact that representation phase in this model has two parts, each of them are focused on one of these parts and negligent the other one and they couldn’t provide a comparable result with other models. On the other hand, none of those works even applied on a large database so far.
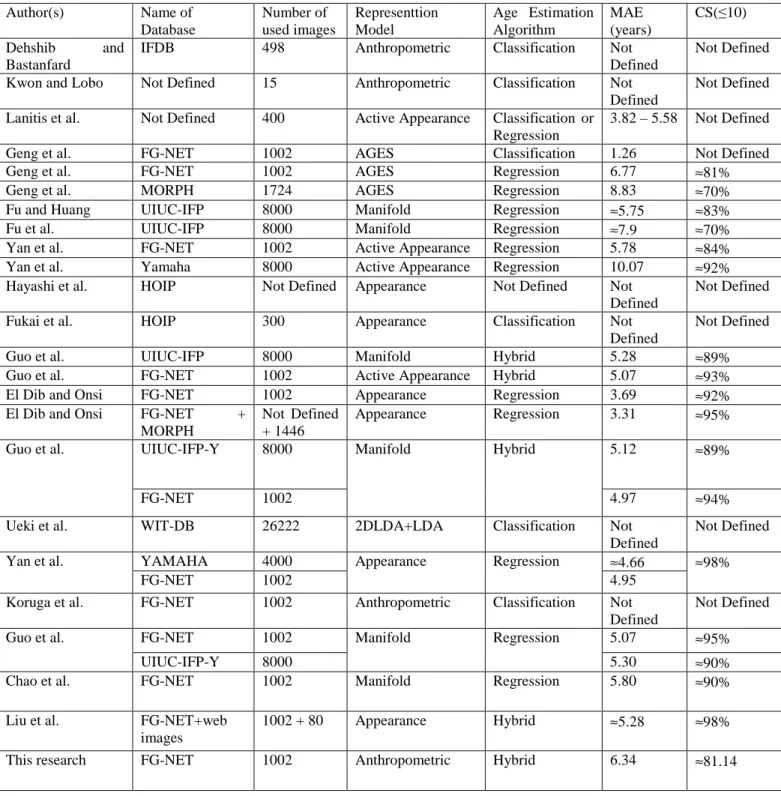
Table 1 provides a good view about the previous researches and the current one. The closest research in the literature to this research is Dehshibi and Bastanfard (2010). But there are some differences between the current work and their research as follow:
• They present a classification in which there are four classes of ages and each image is assigned to one of the classes. But in this research the age is determined exactly. • Both researches use an anthropometric model, but they used 7 ratios from
landmarks on human faces, while 18 ratios are used in this study.
• Both researches use a wrinkle densities analysis based on wrinkle regions at forehead, cheekbone and eye corner. They considered identical approach to analysis of wrinkles at the all mentions regions, but they are considered in different ways since the essence of wrinkles in the various regions is different. For example, wrinkles in the forehead region are horizontal whereas they are diagonal in the cheek region.
• They used feed forward propagation neural network for age estimation; however, in this paper a pairwise binary support vector machine (SVM) is used.
• They used 498 images for testing their method but 1002 images are used in this study.
94
Table 1. Summary of all representation models’ techniques
Author(s) Name of
Database
Number of used images
Representtion Model
Age Estimation Algorithm
MAE (years)
CS(≤10)
Dehshib and
Bastanfard
IFDB 498 Anthropometric Classification Not
Defined
Not Defined
Kwon and Lobo Not Defined 15 Anthropometric Classification Not
Defined
Not Defined
Lanitis et al. Not Defined 400 Active Appearance Classification or
Regression
3.82 – 5.58 Not Defined
Geng et al. FG-NET 1002 AGES Classification 1.26 Not Defined
Geng et al. FG-NET 1002 AGES Regression 6.77 ≈81%
Geng et al. MORPH 1724 AGES Regression 8.83 ≈70%
Fu and Huang UIUC-IFP 8000 Manifold Regression ≈5.75 ≈83%
Fu et al. UIUC-IFP 8000 Manifold Regression ≈7.9 ≈70%
Yan et al. FG-NET 1002 Active Appearance Regression 5.78 ≈84%
Yan et al. Yamaha 8000 Active Appearance Regression 10.07 ≈92%
Hayashi et al. HOIP Not Defined Appearance Not Defined Not
Defined
Not Defined
Fukai et al. HOIP 300 Appearance Classification Not
Defined
Not Defined
Guo et al. UIUC-IFP 8000 Manifold Hybrid 5.28 ≈89%
Guo et al. FG-NET 1002 Active Appearance Hybrid 5.07 ≈93%
El Dib and Onsi FG-NET 1002 Appearance Regression 3.69 ≈92%
El Dib and Onsi FG-NET +
MORPH
Not Defined + 1446
Appearance Regression 3.31 ≈95%
Guo et al. UIUC-IFP-Y 8000 Manifold Hybrid 5.12 ≈89%
FG-NET 1002 4.97 ≈94%
Ueki et al. WIT-DB 26222 2DLDA+LDA Classification Not
Defined
Not Defined
Yan et al. YAMAHA 4000 Appearance Regression ≈4.66 ≈98%
FG-NET 1002 4.95
Koruga et al. FG-NET 1002 Anthropometric Classification Not
Defined
Not Defined
Guo et al. FG-NET 1002 Manifold Regression 5.07 ≈95%
UIUC-IFP-Y 8000 5.30 ≈90%
Chao et al. FG-NET 1002 Manifold Regression 5.80 ≈90%
Liu et al. FG-NET+web
images
1002 + 80 Appearance Hybrid ≈5.28 ≈98%
95
3- Research methodology
In this paper to perform facial age estimation a new framework is proposed.As illustrated in Figure.1 the proposed age estimation framework consists of three main modules which are preprocessing, representation module that consists of two sub modules includes calculating ratios and calculating wrinkle densities, and age estimation module which includes regression using pairwise binary support vector machine (SVM). These modules are explained in the following sections.
Figure 1. Proposed age estimation diagram 3-1- Preprocessing
Preprocessing stage prepares images in order to use in the following steps. At first, color images are transformed into grayscale. Then, due to the fact that a great number of the FG-Net database images suffer from periodic noise, a low pass filter is applied to omit that. The result of noise Removing is illustrated in Figure. 2. Finally, a 2-D pixel wise adaptive wiener filter is used to improve image qualities in order to extract wrinkle densities. A Neighborhood of size 3-by-3 is used to estimate the local image mean and standard deviation for the wiener filter.
Figure 2. Periodic noise removing. (a) Original image, (b) image after applying low pass filter, (c) and (d) show forehead regions in original and filtered images, respectively
Input Images
Preprocessing
Periodic noise removing Wiener filter
Representation module
Calculating ratios
Extracting 17 ratios
Calculating wrinkle densities
Extracting wrinkle densities from 4 face regions
Age estimation
Pairwise binary tree SVM regression
Estimat ed ages
96 3-2- Representation phase
3-2-1- Calculating ratios
Face anthropometry is the scientific measurement of the sizes and proportions of human faces. Face anthropometric investigations define some measurements taken from landmarks on human faces over different ages. Craniofacial development theory has proved that human face's shape changes over time. As time passes, face transforms from circular shape into oval shape and it causes change in the location of the face features such as eyes, nose, lips and top of head.
Kwon and Lobo (1999) carried out some research in the field of age estimation for the first time. They used six ratios to distinguish babies from adults. Dehshibi and Bastanfard (2010) used seven ratios and Koruga et al. (2011) utilized a dozen ratios further than Kwon and Lobo (1999).
97
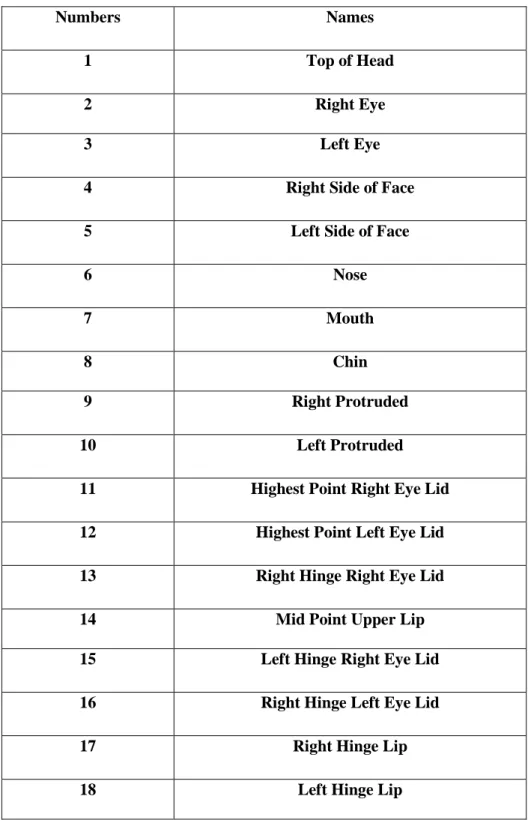
Table 2. Facial landmark numbers and names used in the framework
Numbers Names
1 Top of Head
2 Right Eye
3 Left Eye
4 Right Side of Face
5 Left Side of Face
6 Nose
7 Mouth
8 Chin
9 Right Protruded
10 Left Protruded
11 Highest Point Right Eye Lid
12 Highest Point Left Eye Lid
13 Right Hinge Right Eye Lid
14 Mid Point Upper Lip
15 Left Hinge Right Eye Lid
16 Right Hinge Left Eye Lid
17 Right Hinge Lip
98
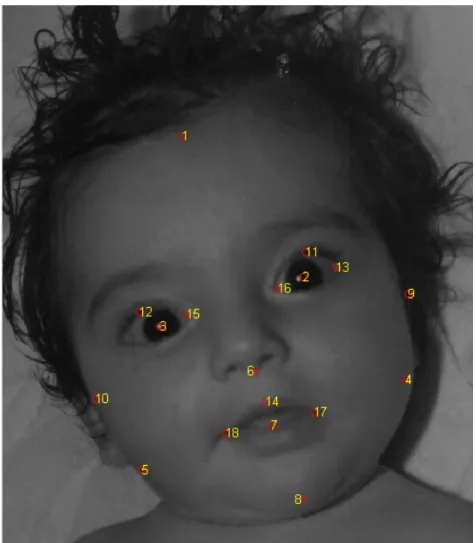
This framework utilized 18 landmarks and 17 ratios to address facial images. Landmarks used in this framework are shown in Figure 3 and Table 2. This work's ratios are derived as follow:
(1)
1 = (( , ℎ, ))
(2)
2 = ( ( , ℎ, )ℎ)
(3)
3 = (( , ℎ, ℎ ))
(4)
4 = (( ,, ℎ))
(5)
5 = (( ,, ℎ )ℎ)
(6)
6 = ((" # $ , ℎ ), ℎ )
(7)
7 = ( &( ' ( , ℎ &, )' ( )
(8)
8 = ( ℎ *+ +(" # $, , ℎ )*+ + )
(9)
9 = ($ ℎ *( ℎ $ ℎ , $ ℎ *, * -## + #)ℎ )
(10)
10 = (( ℎ $ℎ $ ℎℎ ,, ℎ ))
(11)
11 = ( ℎ $( ℎ $ ℎ ℎ , *, -## + #))
(12)
12 = ($ ℎ *( ℎ $ , $ ℎ *ℎ , ℎ )ℎ )
(13)
13 = ( ℎ $(" # $ℎ , ℎ ), ℎ )
(14)
14 = ( *( *-## + #,-## + #, ) )
(15)
15 = (" # $(" # $, , ℎ ) )
(16)
16 = ( ℎ $ ( , $, ) ℎ )
(17)
99
Where D(A,B) is Euclidean distance between two face features A and B.
3-2-2-Calculating wrinkle densities
Since the human face shape doesn't change too much in adulthood wrinkle densities can be taken, to separate adults from senior adults. The existence of wrinkle in an area can be measured based on lines and curves detection in that region.
To do that, first of all, forehead, under eyes, eye corners and cheeks regions are extracted (due to the symmetry of the human face, these regions are just taken from one side of the faces). Then, since the essence of wrinkles in the various regions is different, for instance, wrinkles in the forehead area are horizontal whereas they are diagonal in the cheek area; they are considered in different ways.
3-2-2-1- Forehead area
Initially, for wrinkle analysis wrinkle areas need to be found. Forehead area is a rectangle with a width of 5/3 of distance between eyes and with a height of 2/3 of distance between eyes, located above eyes.
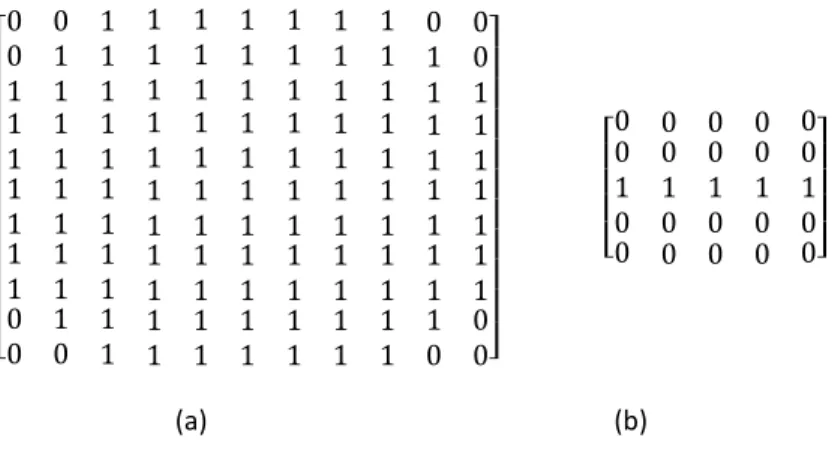
Considering the possibility of the existence of hair in this area and the adverse effect it would have on the wrinkle detection, in the first step, the forehead images are converted into BW images using a threshold. Black areas are considered as hair and then this area is expanded using 'erosion' morphology operator on the white region to conclude all desired areas with the structure element which is shown in Figure. 4(a).
In the second step, to find forehead wrinkles, canny edge detector was applied on the original forehead region to extract all existed lines. Next, 'open' morphology operator is utilized with the structure element illustrated in Figure 4(b), to separate horizontal lines from others.
/ 0 0 0 0 0 0 0 0 0
10 0 10 1 1
1 1 1
1 1 1 1 1 1 0 0 1 1 1 1 1 1 1 0 1 1 1 1 1 1 1 1 1 1 1
1 1 1 1 1 1 1 0 0 1 1 1 1 1 0 1 1 1 1 1 1
1 1 1 1 1 1 1 1 1 1 1 1 1 1 1 1 1 1 1 1 1 1 1 1 1 1 1 1 1 1 1 1 1 1 1 1 1 1 1 1 1 1 1 1 1 1 1 1 1 1 1 1 1 1 1 1 1 0 1 1 1 1 0 023 3 3 3 3 3 3 3 3 4 / 0 0 0
10 0 0 0 00
1 0
0 0 0 1 1 1 0 0 0
0 1 0
0 0 0 0 023
3 3 4
(a) (b)
Figure 4. Structure elements used in the morphology operators
In the last step, hair area which is found in the first step is subtracted from forehead wrinkle area in the second step. If a pixel belongs to the last step, it is labeled as a forehead wrinkle pixel.
In the proposed method, grayscale image 'Forehead' is fed into the algorithm and returns 'Forehead Hairs ' and 'Forehead Wrinkles' binary images with the same size. Wrinkle density in this area is defined as (18):
(18)
' + ℎ 5+ 6 =sum(' + ℎ size(Forehead)_Wrinkles − Forhead_Hairs )
Dividing the result by the size of image makes the 'Forehead Wrinkle Density' independent of image size.
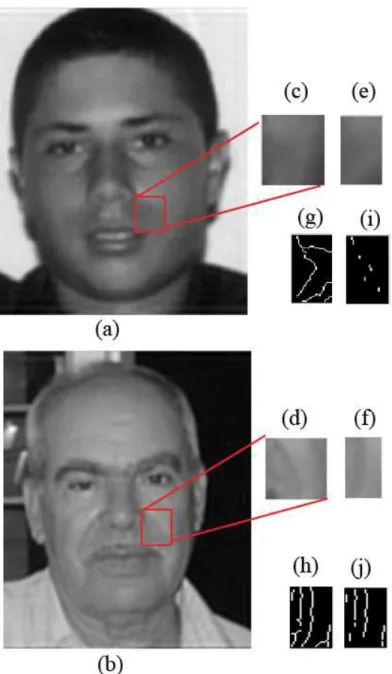
Figure 5 displays trends of calculating forehead wrinkle densities for a young and a senior adult. The right side of the image is related to a twenty years old person and the left side of the
100
image is related to a fifty years old person. (a), (b) displays the forehead areas after cropping it from the original image. (c), (d) are BW images considered as the hair images. (e), (f) show hair images after applying 'erosion' operator on white areas to expand black areas. (g), (h) display applying canny edge detector on the (a), (b), respectively. (i), (j) are the results of applying 'open' morphology operator on the (g), (h), respectively, to find desired horizontal lines. Finally, (e), (f) subtracted from (i), (j) and results in (k), (l), respectively. As can be seen in the Figure. 5, using this algorithm, lines related to the wrinkles can be separated from hair lines and intensity change lines.
Figure 5. Extracting forehead wrinkles 3-2-2-2- Cheekbone area
Cheekbone area is stretching from the side of the nose to the above of the lip. Due to the symmetry of the face, only the right side cheekbone is considered; however, in a number of pictures because of the orientation of the face this district isn't accessible, the left side one is considered.
There are clear wrinkles in the elderly person in this area, so in this stage, these wrinkles are detected. Firstly, the cheekbone cropped image is rotated trough 30 degrees and one third of the middle of the image is cropped. Secondly, the canny filter is applied to detect the lines in this area. Then, using 'open' morphology operator, vertical lines are separated. These binary image returns to 1 if pixel is related to the cheekbone wrinkles and returns to 0 elsewhere. Wrinkle density in this area is defined as (19):
101
(19)
ℎ 6J 5+ 6 =sum(Cheekbone )size(Cheekbone )
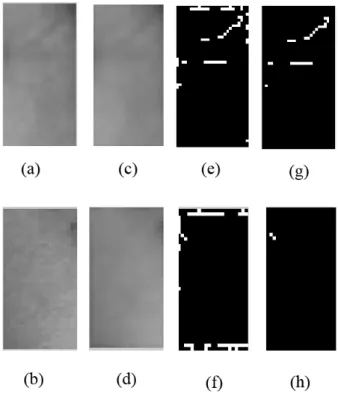
Figure 6 illustrates detecting cheekbone wrinkle for a young and an elderly person and let us compare them with each other. The up side of the image is related to an eighteen years old person and the down side of the image is related to a sixty-nine years old person. (a), (b) displays the cheekbone areas after cropping it from the original image. (c), (d) are cheekbone images cropped from the original images. (e), (f) are the result of the rotation through 30 degrees followed by cropping the one third of the middle of the (c), (d), respectively. (g), (h) display applying canny edge detector on the (e), (f), respectively. (i), (j) are the results of applying 'open' morphology operator on the (g), (h), respectively, to find desired vertical lines. As can obviously be seen, this algorithm can separate these wrinkle lines from the other ones.
102
3-2-2-3- Eye corner area
Considering the distance of right hinge and left hinge of the right eye to be 'DEyeCorners', eye corner area is 0.4*DEyeCorners far from the right hinge of the right eye. It has a width of 1/2 DEyeCorners and a height of DEyeCorners.
Due to the delicacy of wrinkles in this area and considering the fact that applying periodic noise remover in the preprocessing stage destruct this wrinkles, this area is cropped before applying periodic noise remover on original image. After that, the wiener filter is applied to reduce noises of this area. Due to the fact that wrinkles of this region are primarily horizontal, * the horizontal Sobel filter is used to find wrinkles of this area. Applying wiener filter on these sub images result in appearing some lines in the sides of the edge images which are removed before calculating wrinkle density. by calling this binary image as 'EyeCorner', wrinkle density in this area is defined as (20):
(20)
+ +5+ 6 =sum(EyeCorner )size(EyeCorner )
Figure 7 illustrates the process of eye corner wrinkle density calculation and compares this process in a 24 years old person with a 52 years old person. The up side of the image is related to a 52 years old person and the down side of the image is related to a 24 years old person. (a), (b) displays the eye corner areas after cropping it from the original image. (c), (d) are eye corner images after applying wiener filter. (e), (f) display applying canny edge detector on the (c), (d), respectively. (g), (h) display removing sides lines from (e), (f), respectively.
Figure 7. Extracting eye corner wrinkles 3-3- Age estimation phase
Given aging representation features, the next significant step is estimating the ages. In this step both classification and regression method can be used. Kwon and Lobo (1999) and Dehshibi and Bastanfard (2010) used classification method to classify their images into a number of classes. A pairwise binary tree SVM is used to regress the ages, similar to the approach in GuoFuHuang et al. (2008). It makes comparison with the manifold learning, used in
103
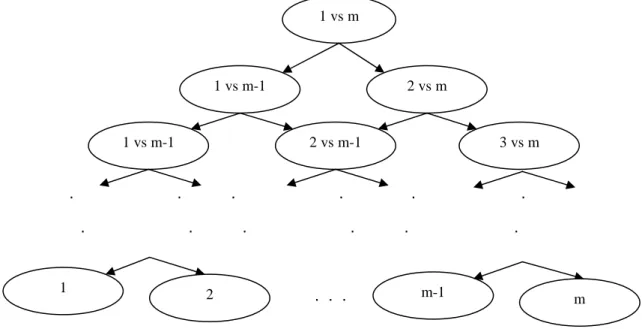
GuoFuHuang et al. (2008), much easier. Besides, considering the number of classes which are involved in each face's age estimation to be m, and the number of images to be n, the number of pairwise comparisons is limited to m-1 and m<n. Consequently, the computation cost decreases, dramatically. Figure 8 illustrates the structure of pairwise binary tree SVM used in this work.
Figure 8. Pairwise binary tree SVM used in the work
4- Numerical experiments
4-1- The used database for experiments
Database has always been one of the essential parts of a facial age estimation system (FAES). Due to the fact that it's extremely hard to collect a large size aging database with age information at the time of taking photos, there are a few databases for this purpose and fewer of them are publicly available. Fortunately, FG-NET database ('The FG-NET Aging Database,"', 2010) which is a large database containing 1002 high resolution color or grayscale face images, is publicly available. The age range is from 0 to 69 years with frontal face images available for each subject. A file containing 68 key points is provided along with each image. Since 'The FG-NET is baseline for comparisons with many age estimation techniques (FuGuo, Huang, 2010) so this database is used to apply the method and compare it with other methods.
4-2- Data structure
For age estimation, at first, the representation features including 17 ratios and 3 wrinkle densities are extracted as described in section 2.2. Some key points attached to the database are used beside a top of head point attained using ellipse fitting on some of that key points. Figure. 9 illustrates the 69 key points providing by FG-NET and the ellipse that are found from ellipse fitting besides the key points used in this work. Blue circles show 69 key points attached to the database, green circles show the ellipse fitted on some of key points, and red circles are the key points used in this work.
1 vs m
1 vs m-1 2 vs m
1 vs m-1 2 vs m-1 3 vs m
. . . . . .
. . . . . .
. . . . . .
1 2
104
Figure 9. The key points
Next, a pairwise binary tree SVM is used in the age estimation phase mentioned in section 2.3 to estimate image ages. The input vector consists of 17 ratios and 3 wrinkle densities. Besides, since cheekbone wrinkle density and ratio 14 are more efficient than others, they are repeated in the input vector. In addition, the ratio of the major and minor axis of the ellipse that has been found in the ellipse fitting is used in the input vector, too.
To evaluate the accuracy of the algorithm, leave one out protocol is used to determine, test and train datasets. The performance of age estimation mainly can be measured by two criterions: MAE and cumulative score (CS) (FuGuo, Huang, 2010). The MAE is defined as the mean of the absolute errors between the estimated age labels and the ground truth age labels, and can be defined as follow:
(21)
O = PQRS− SQ/
U SVW
Where l_k is the ground truth age for the kth test image, l _k is the estimated age, and N is the ̂ total number of test images. The CS is defined as:
(22)
&(X) = YZ[/ × 100%
Where, YZ[ is the number of test images in which the age estimation makes an absolute error no higher than j years.
4-3- Numerical results
Experimental results show that this work's MAE is 6.34 and CS<=10 is 81.14. Table 1 shows the result of all representation models beside this work. The presented method is compared with the manifold learning used in GuoFuHuang et al. (2008) since they used the same age classification method.
In comparison with GuoFuHuang et al. (2008) that shows the MAE using manifold representation and binary tree SVM classification is 7.16, the MAE used in this study which is
6.34 is much lower. The comparison between them in terms of CS is also illustrates that method gives a bit better CS than manifold and it is shown in Fig
Figure 10. CS of
5-
Conclusion
Estimating human age from images is a problem that has recently gained attention from various researchers due to its numerous applications in many industries; such as security and military industries as well as any organization which
police stations and forensics.
An applicable, efficient and novel facial age estimation algorithm anthropometric model. The algorithm
compare with other methods. Seventeen ratios and three precise wrinkle densities are extracted from each face image in representation phase. Ratios are more applicable to detect people under the age of eighteen whereas wrinkle densities
In age estimation phase, a pairwise binary tree SVM SVM output is a number between 0
CS measures are used to illustrate
manifold learning to prove its effectiveness.
Nevertheless, it can be mentioned that some other representation objects such as skin color and skin texture can be merged with
can be an interesting topic to investigate in the future.
References
Chao, W.-L., Liu, J.-Z. &Ding, J. learning and age-oriented regression'.
Cootes, T. F., Edwards, G. J. &Taylor, C. J. (2001). 'Active Appearance Models'. Pattern Anal. Mach. Intell., 23
Dehshibi, M. M. and Bastanfard, A. (2010). 'A new algorithm for age recognition from facial images'. Signal Processing, 90
105
6.34 is much lower. The comparison between them in terms of CS is also illustrates that method gives a bit better CS than manifold and it is shown in Figure 10.
CS of the algorithm in comparison with manifold learning
Estimating human age from images is a problem that has recently gained attention from various researchers due to its numerous applications in many industries; such as security and military industries as well as any organization which need accurate facial identification such as
n applicable, efficient and novel facial age estimation algorithm is presented algorithm is applied on the FG-NET database which is a baseline to mpare with other methods. Seventeen ratios and three precise wrinkle densities are extracted from each face image in representation phase. Ratios are more applicable to detect people under the age of eighteen whereas wrinkle densities are more useful for above that age.
In age estimation phase, a pairwise binary tree SVM is used to regress the ages. In fact, each SVM output is a number between 0-69 years which represents the estimated age.
to illustrate the efficiency of this work and the approach is manifold learning to prove its effectiveness.
Nevertheless, it can be mentioned that some other representation objects such as skin color and skin texture can be merged with the features is this study to improve the measures, which can be an interesting topic to investigate in the future.
Z. &Ding, J.-J. (2013). 'Facial age estimation based on label oriented regression'. Pattern Recognition, 46(3), 628-641. Cootes, T. F., Edwards, G. J. &Taylor, C. J. (2001). 'Active Appearance Models'. Pattern Anal. Mach. Intell., 23(6), 681-685.
Dehshibi, M. M. and Bastanfard, A. (2010). 'A new algorithm for age recognition from facial Signal Processing, 90(8), 2431-2444.
6.34 is much lower. The comparison between them in terms of CS is also illustrates that this
rning
Estimating human age from images is a problem that has recently gained attention from various researchers due to its numerous applications in many industries; such as security and accurate facial identification such as is presented using NET database which is a baseline to mpare with other methods. Seventeen ratios and three precise wrinkle densities are extracted from each face image in representation phase. Ratios are more applicable to detect people under
bove that age.
to regress the ages. In fact, each 69 years which represents the estimated age. The MAE and is work and the approach is compared with Nevertheless, it can be mentioned that some other representation objects such as skin color e measures, which
J. (2013). 'Facial age estimation based on label-sensitive
Cootes, T. F., Edwards, G. J. &Taylor, C. J. (2001). 'Active Appearance Models'. IEEE Trans.
106
El Dib, M. Y. and Onsi, H. M. (2011). 'Human age estimation framework using different facial parts'. Egyptian Informatics Journal, 12(1), 53-59.
'The FG-NET Aging Database'. (2010).
Fu, Y., Guo, G. &Huang, T. S. (2010). 'Age Synthesis and Estimation via Faces: A Survey'. IEEE Transactions on Pattern Analysis and Machine Intelligence, 32(11), 1955-1976.
Fu, Y. and Huang, T. S. (2008). 'Human Age Estimation With Regression on Discriminative Aging Manifold'. IEEE Transactions on Multimedia, 10(4), 578-584.
Fu, Y., Xu, Y. &Huang, T. S. (2007). 'Estimating Human Age by Manifold Analysis of Face Pictures and Regression on Aging Features'. 2007 IEEE International Conference on
Multimedia and Expo, 1383-1386.
Geng, X., Zhou, Z.-H. &Smith-Miles, K. (2007). 'Automatic Age Estimation Based on Facial Aging Patterns'. IEEE Trans. Pattern Anal. Mach. Intell., 29(12), 2234-2240.
Geng, X., Zhou, Z.-H., Zhang, Y., Li, G. &Dai, H. (2006). 'Learning from facial aging patterns for automatic age estimation'. Proceedings of the 14th ACM international conference on Multimedia, 307-316.
Guo, G., Fu, Y., Dyer, C. R. &Huang, T. S. (2008). 'Image-Based Human Age Estimation by Manifold Learning and Locally Adjusted Robust Regression'. IEEE Transactions on Image Processing, 17(7), 1178-1188.
Guo, G., Fu, Y., Huang, T. S. &Dyer, C. R. (2008). 'Locally Adjusted Robust Regression for Human Age Estimation'. Applications of Computer Vision, 2008. WACV 2008. IEEE Workshop on, 1-6.
Guodong, G., Yun, F., Dyer, C. R. &Huang, T. S. (2008). 'A Probabilistic Fusion Approach to human age prediction'. Computer Vision and Pattern Recognition Workshops, 2008. CVPRW '08. IEEE Computer Society Conference on, 1-6.
Hayashi, J., Yasumoto, M., Ito, H., Niwa, Y. &Koshimizu, H. (2002). 'Age and gender estimation from facial image processing'. SICE 2002. Proceedings of the 41st SICE Annual Conference, 1(13-18.
Hironobu Fukai, H. T., Yasue Mitsukura, Minoru Fukumi. (2007). 'Apparent age estimation system based on age perception'. Proceedings of the SICE Annual Conference, 2808-2812. Koruga, P., Ba, M., x010D, J, x &eva. (2011). 'Application of modified anthropometric model in facial age estimation'. ELMAR, 2011 Proceedings, 17-20.
Kwon, Y. H. and Lobo, N. d. V. (1999). 'Age Classification from Facial Images'. Computer Vision and Image Understanding, 74(1), 1-21.
Lanitis, A., Draganova, C. &Christodoulou, C. (2004). 'Comparing different classifiers for automatic age estimation'. IEEE Transactions on Systems, Man, and Cybernetics, Part B (Cybernetics), 34(1), 621-628.
Lanitis, A., Taylor, C. J. &Cootes, T. F. (2002). 'Toward automatic simulation of aging effects on face images'. IEEE Transactions on Pattern Analysis and Machine Intelligence, 24(4), 442-455.
107
Liu, J., Ma, Y., Duan, L., Wang, F. &Liu, Y. (2014). 'Hybrid constraint SVR for facial age estimation'. Signal Processing, 94(576-582.
Shuicheng, Y., Xi, Z., Ming, L., Hasegawa-Johnson, M. &Huang, T. S. (2008). 'Regression from patch-kernel'. Computer Vision and Pattern Recognition, 2008. CVPR 2008. IEEE Conference on, 1-8.
Ueki, K., Hayashida, T. &Kobayashi, T. (2006). 'Subspace-based age-group classification using facial images under various lighting conditions'. 7th International Conference on Automatic Face and Gesture Recognition (FGR06), 6 pp.-48.
Yan, S., Wang, H., Tang, X. &Huang, T. S. (2007). 'Learning Auto-Structured Regressor from Uncertain Nonnegative Labels'. 2007 IEEE 11th International Conference on Computer Vision, 1-8.