HEALTH AND HOUSEHOLD ACCESS TO WATER AND SANITATION: A GLOBAL ANALYSIS AND SYSTEMATIC LITERATURE REVIEW
Alycia Overbo
A thesis submitted to the faculty at the University of North Carolina at Chapel Hill in partial fulfillment of the requirements for the degree of Master of Science in Public Health
in the Department of Environmental Sciences and Engineering in the Gillings School of Global Public Health.
Chapel Hill 2014
Approved by:
Jamie Bartram
Pete Kolsky
ABSTRACT
Alycia Overbo: Health and household water and sanitation access: a global analysis and systematic literature review
(Under the direction of Jamie Bartram)
Millennium Development Goal target 7c sought to improve global access to safe water and
sanitation, but different benchmarks were used to monitor “improved” access; the water
benchmark is community-level access, and for sanitation it is household-level. Household-level
sanitation is considered safer than shared sanitation, yet the relative health impacts of access to
shared water sources and water supplies on premises have not been established. An analysis
evaluated global progress towards water and sanitation targets under alternative benchmarks, and
a systematic literature review was conducted to compare the relative health impacts of using
shared water sources and at-house water supplies. Results indicate that water and sanitation have
similar coverage deficits for household-level access and that individuals with at-house water
supplies may experience lower odds of water-washed diseases and improved height outcomes.
Promoting at-house water supplies through policy and development goals may realize potential
health gains, particularly in underserved rural areas.!
ACKNOWLEDGEMENTS
I would like to acknowledge the contributions of my peers, colleagues and professors, whose
support was instrumental to this research. I would like to thank Mark Elliott, Jeanne Luh, Robert
Bain, David Holcomb, and Kate Shields for their advice on statistical methods, as well as Emily
Elliott for her advice on figures. I would like to acknowledge Kyle Onda, Jonny Crocker, and
Georgia Kayser for their development of the ‘WatSan Cluster’ methodology used in this analysis
and to thank them for their advice in applying it to this analysis. Special thanks are extended to
Mike Fisher, Ashley Williams, and Caroline Kostyla for providing constructive feedback on
earlier drafts and to librarians Mellanye Lackey and Jason Reed for their invaluable assistance.
Lastly, I would like to thank the members of my committee, who have each provided guidance
and valuable insights throughout the research process, and the members of my research group for
TABLE OF CONTENTS
LIST OF TABLES!...!vii!
LIST OF FIGURES!...!viii!
BACKGROUND!...!1!
CHAPTER 1: DOES GLOBAL PROGRESS ON SANITATION REALLY LAG BEHIND WATER?!...!3!
ROLE IN ANALYSIS!...!4!
ABSTRACT!...!5!
INTRODUCTION!...!5!
METHODS!...!8!
Description of data!...!10!
Statistical analysis!...!11! RESULTS!...!15! DISCUSSION!...!19! Limitations!...!22! CONCLUSION!...!24! REFERENCES!...!25!
CHAPTER 2: AT-HOUSE WATER SUPPLIES AND HEALTH: A SYSTEMATIC LITERATURE REVIEW!...!28!
ROLE IN ANALYSIS!...!29!
ABSTRACT!...!30!
INTRODUCTION!...!31!
METHODS!...!32!
Search strategy!...!32!
Inclusion and exclusion criteria!...!33!
RESULTS!...!34!
Search results!...!34!
Study characteristics!...!35!
Health impacts!...!38!
Diarrheal diseases!...!38!
Height and weight!...!40!
Trachoma!...!42!
Hepatitis A and E!...!42!
Helminth and parasite infections!...!43!
Distance to source!...!44!
Water quantity!...!44!
Water quality!...!45!
DISCUSSION!...!46!
CONCLUSIONS!...!52!
APPENDIX: TABLE OF STUDY DESCRIPTIONS!...!54!
REFERENCES!...!59!
EPILOGUE!...!69!
LIST OF TABLES
Table 1. Description of scenarios and benchmark definitions.!...!9!
Table 2. Number and description of countries included and excluded from water and sanitation analyses.!...!10!
Table 3. Allocation of 151 countries to WatSan clusters for gap-filling.!...!12!
Table 4. Equations used for analysis!...!13!
Table 5. Search strategy.!...!32!
LIST OF FIGURES
Figure 1. Global progress with a community-levelbenchmark for water and sanitation
(Scenario 1)!...!16!
Figure 2. Global progress with a household-level benchmark for water and sanitation
(Scenario 2)!...!17!
Figure 3. Global progress with a community-level benchmark in rural and urban areas
(Scenario 1 & 2).!...!18!
Figure 4. Global progress with a household-level benchmark in rural and urban areas
(Scenario 1 & 2).!...!19!
Figure 5. Literature screening and results.!...!35!
Figure 6. Geographical distribution of included studies.!...!36!
BACKGROUND
Safe water and sanitation are critical determinants of health, and lack of access to safe
water and sanitation facilities contributes to the disease burden of many developing countries.
An estimated 2.2 million people die each year from diarrhea and other diseases related to water,
sanitation, and hygiene (1). If universal access to improved water and sanitation were achieved,
155 million cases of diarrhea could be prevented and 730,000 lives would be saved (2). The
United Nations set the Millennium Development Goal (MDG) of halving the world population
without sustainable access to safe water and sanitation by 2015 to mitigate the global disease
burden from water, sanitation, and hygiene (3). While the MDG target for water was met in
2010, the sanitation target was declared to be seriously off-track and unlikely to be met by 2015
(4).
Improving global water and sanitation access were included within the same MDG target,
and use of designated “improved” facilities served as a benchmark for safe and sustainable
access. Different benchmarks were used for “improved” access in the associated water and
sanitation monitoring. Improved water sources were shared or on the household premises,
whereas sanitation facilities were only considered improved when they were on premises (3). A
global data analysis was undertaken to re-evaluate the global progress towards safe water and
sanitation access under alternate benchmarks: “improved” community-level access for water and
Shared water and sanitation facilities present different health risk, which is reflected in
their different MDG benchmarks. Shared sanitation facilities with improper maintenance may
present greater health risks to the community than household facilities (5). Also, certain
sub-populations may be less likely to use shared facilities; for example, women may choose not to
use shared sanitation facilities due to risk of experiencing violence (6). Shared “improved”
water facilities are sources protected from contamination that are presumed to deliver safe water.
However, water collected from shared sources may become contaminated at the source, during
collection, or in household storage (7,8,9). Additionally, studies have found that households
distant from shared water sources experience higher prevalence of diarrhea and trachoma than
households in closer proximity to their water sources (10,11). Study findings suggest that
households living in closer proximity to water sources may experience better health through
increased water use and water allocation for hygiene activities (12,13).
It is generally accepted that households with at-house water supplies experience better
health than households using shared supplies, but the global coverage of access to at-house water
supplies is unknown and the collective body of research literature has not been evaluated to
collate and weigh the evidence supporting that notion. A systematic literature review on the
health impacts of water and sanitation was conducted to assess whether at-house water supplies
are associated with household health gains. A global data analysis was used to assess the
sufficiency of the community-level water benchmark and estimate global coverage of at-house
water supply access. Each of these analyses is presented in this thesis as a manuscript prepared
CHAPTER 1: DOES GLOBAL PROGRESS ON SANITATION REALLY LAG BEHIND WATER?
An analysis of global progress on community- and household-level access to safe water and sanitation
Oliver Cumming*, Mark Elliott**/***, Alycia Overbo*** & Jamie Bartram***
* Department of Disease Control, Faculty of Infectious Tropical Disease, London School of
Hygiene and Tropical Medicine
** Department of Civil, Construction and Environmental Engineering, University of Alabama
ROLE IN ANALYSIS
Jamie Bartram conceived the research question for this study, and Alycia Overbo and Mark
Elliott developed the methodological approach. Alycia Overbo collected, imputed, and
quantitatively analyzed the study data with the support of Mark Elliott. Ollie Cumming and
Jamie Bartram had lead roles in the writing process, and Alycia Overbo and Mark Elliott
ABSTRACT
Safe drinking water and sanitation are important determinants of human health and
wellbeing and have been declared human rights. Both water and sanitation were included in the
MDGs under a single target but the benchmarks used for monitoring improved access differed
significantly; for water the benchmark is community-level access but for sanitation it is
household-level access. We estimated global progress for water and sanitation under two
scenarios with equivalent household- and community-level benchmarks. Our results suggest that
the ‘sanitation deficit’ is apparent only when household-level sanitation access is contrasted with
community-level water access. When equivalent household- and community-level benchmarks
are used for water and sanitation, the global deficit is as great for water as it is for sanitation, and
sanitation progress in the 1990-2015 MDG-period outstrips that in water. We conclude that for
any future international goals a household-level benchmark should be considered for both water
and sanitation, such that efforts are focused where access is optimal.
INTRODUCTION
In 2012, the United Nations (UN) Secretary General declared that the water component
of Millennium Development Goal (MDG) target 7c, to reduce by half the proportion of people
without access to safe drinking water, had been met in 2010, five years ahead of the 2015
estimated 2.5 billion lack access to an ‘improved’ sanitation facility2. This apparent deficit, with
global progress on extending access to safe sanitation lagging behind that of water, has been
coined the ‘sanitation crisis’ and has contributed to various calls to action being issued3. The MDG target for water and sanitation, and the methods for monitoring its progress,
are part of a longer-term evolution of international goal setting and monitoring for water and
sanitation4. Although there is one joint target for water and sanitation – “to halve, by the year
2015, the proportion of people without sustainable access to safe drinking water and basic
sanitation”2 – the respective benchmarks for monitoring water and sanitation differ significantly with regard to the level of access deemed adequate. For water, the benchmark for ‘improved’ is
community-level and, for sanitation, it is household-level2. This decision to establish different benchmarks was seemingly pragmatic, based on a combination of evidence and experience but
also realism in terms of what could be achieved at that time in light of existing levels of progress,
resource constraints, and historic levels of ambition with regard to the level and quality of access
that could be achieved. In addition, keeping the water target at the level of the community may
have been considered a progressive measure to incentivize reaching those with distant and unsafe
water, rather than improving the level of access of those already served at the community-level.
The inclusion of water and sanitation in the MDGs reflects the important contribution of
these basic services to human health and wellbeing as well as to the realization of human rights.
It has been estimated that as much as 6.6% of the global burden of disease is attributable to poor
water, sanitation and hygiene, and this problem is heavily concentrated in low income settings5. In particular, diarrhoeal diseases, largely preventable with safe water, sanitation and hygiene,
persist as a leading cause of child deaths globally6. Water and sanitation also contribute to
and beyond these specific benefits, access to “sufficient, safe, accessible and affordable” water
and sanitation is recognized as a human right10.
The extent to which these benefits differ between community- and household-level
access to water and sanitation is unclear, but that they do differ significantly is well established
and generally accepted11. The human rights considerations of sufficiency, safety, accessibility and affordability are inextricably linked to where services are located in relation to the
household. The benchmarks for water and sanitation used in monitoring the MDG target
however were not consistent in this regard; the minimum requirement for water was a protected
community-level source, such as a tubewell, but for sanitation it was a household-level sanitation
facility, such as a household pit latrine. It is striking that within one MDG target, such different
benchmarks should have been established in relation to both human rights obligations and
potential health benefits.
In 2015, a new set of development goals will be agreed and an ‘illustrative’ proposal for
these has been made which includes a dedicated universal water and sanitation access target12. However the meaning of this target is contingent on which benchmarks will be used in
monitoring access to water and sanitation. In this analysis, we assess progress on water and
sanitation access from 1990 through 2015 under two scenarios: the first with a community-level
benchmark for both water and sanitation; and the second with a household-level benchmark for
both. We refashion the current MDG target definitions of ‘improved’ in order to critically assess
progress in bringing water and sanitation closer to the household where the health and other
benefits are greatest. A better understanding of trends in global progress for community- and
household-level access to these services can support current debates as to the appropriate level of
METHODS
This study uses the same data sources used by the WHO/Unicef Joint Monitoring
Programme (JMP) to assess national, regional and global progress toward the water and
sanitation MDG target. This analysis models global progress on water and sanitation under the
two scenarios described in Table 1; the first with a community-level benchmark for access and
the second with a household-level benchmark. It is necessary to ‘gap fill’ for certain countries
and years where data is unavailable and for this we use an alternative approach to that currently
used by the JMP. The methods are described in three parts: (1) the approach to gap-filling for
missing data; (2) estimation of progress under Scenario 1 with a community-level access
benchmark; (3) estimation of progress under Scenario 2 with a household-level access
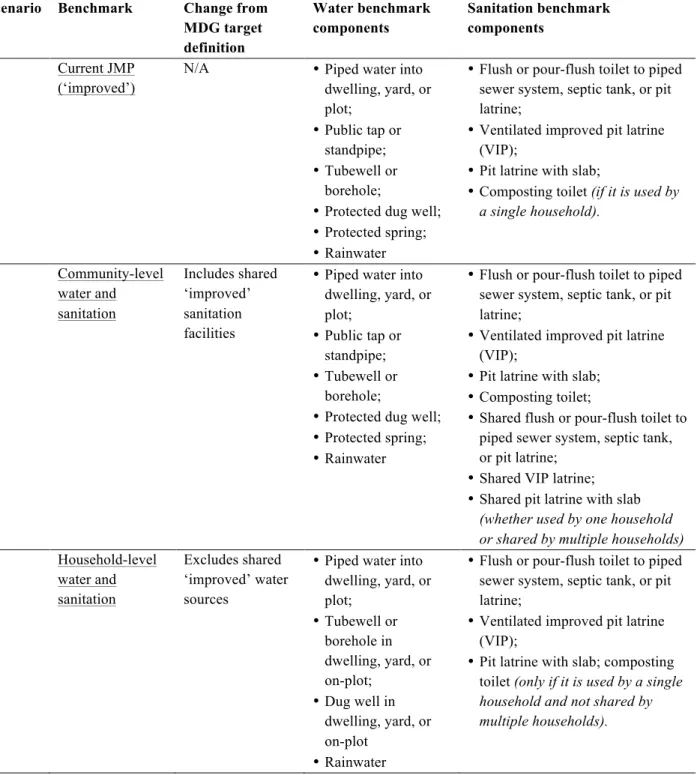
Table 1. Description of scenarios and benchmark definitions.
In total, 170 countries were included for the water analysis and 169 countries for the
sanitation analysis, equivalent to 99.5% and 98.4% of the global population respectively.
Scenario Benchmark Change from MDG target definition Water benchmark components Sanitation benchmark components
0. Current JMP (‘improved’)
N/A •Piped water into dwelling, yard, or plot;
•Public tap or standpipe; •Tubewell or
borehole;
•Protected dug well; •Protected spring; •Rainwater
•Flush or pour-flush toilet to piped sewer system, septic tank, or pit latrine;
•Ventilated improved pit latrine (VIP);
•Pit latrine with slab;
•Composting toilet (if it is used by a single household).
1. Community-level water and sanitation Includes shared ‘improved’ sanitation facilities
•Piped water into dwelling, yard, or plot;
•Public tap or standpipe; •Tubewell or
borehole;
•Protected dug well; •Protected spring; •Rainwater
•Flush or pour-flush toilet to piped sewer system, septic tank, or pit latrine;
•Ventilated improved pit latrine (VIP);
•Pit latrine with slab; •Composting toilet;
•Shared flush or pour-flush toilet to piped sewer system, septic tank, or pit latrine;
•Shared VIP latrine; •Shared pit latrine with slab
(whether used by one household or shared by multiple households) 2. Household-level
water and sanitation
Excludes shared ‘improved’ water sources
•Piped water into dwelling, yard, or plot;
•Tubewell or borehole in dwelling, yard, or on-plot;
•Dug well in dwelling, yard, or on-plot
•Rainwater
•Flush or pour-flush toilet to piped sewer system, septic tank, or pit latrine;
•Ventilated improved pit latrine (VIP);
Countries with populations under 100,000 and/or under 100 km2 total area were excluded from
the analysis and all countries without any data for water and/or sanitation coverage were
excluded. The description of country exclusion can be found in Table 2.
Table 2. Number and description of countries included and excluded from water and sanitation
analyses.
Sanitation
Countries included in raw JMP data (2011) 224
Countries excluded by size or population criteria 49
Countries excluded for missing all data 6
Countries used to calculate cluster averages of shared to improved sanitation ratio 146 Countries missing shared sanitation estimates 37 Countries gap-filled using clustering methodology 25 Countries gap-filled using MDG region and HDI methodology 12 Countries missing data for certain years and technologies 41
Total countries used in analysis 169
Total world population included in analysis 98.4%
Water
Countries included in raw JMP data (2006) 229
Countries excluded by size or population criteria 56
Countries excluded for missing all data 2
Countries used to calculate cluster averages of proportion of protected wells on plot 22 Countries gap-filled using clustering methodology 148 Countries gap-filled using MDG region and HDI methodology 22 Countries missing data for certain years and technologies 16
Total countries used in analysis 170
Total world population included in analysis 98.5%
Description of data
The JMP assembles country-level data from national censuses and nationally
representative household surveys collected by national offices of statistics and international
(www.wssinfo.org). Although data for urban and rural improved drinking water, and for water
piped to home/plot are publicly available, this data alone is insufficient for the purposes of
estimating household versus community level access for water and sanitation as done here. The
additional and more detailed data required for this analysis (including urban and rural population
using protected wells, public standpipes, protected springs and rainwater collection) were
obtained directly from the JMP for 1990 through 2006.
Statistical analysis
Countries were allocated to one of five ‘WatSan clusters’ based on similarity across a set
of WatSan indicators using a hierarchical clustering method and gap statistic analysis as
described by Onda and colleagues13. This approach to clustering is reported as being more compact and better separated than comparable geographic or income based clustering approaches
such as those used by the United Nations or the World Bank 13. Countries that were used in this analysis but were not included in the WatSan clusters (22 countries; Table 3) were grouped by
Human Development Index (HDI) category and MDG region. These country clusters were used
to estimate and apply mean proportions of the population using shared sanitation and
Table 3. Allocation of 151 countries to WatSan clusters for gap-filling.
Countries in italics were used to establish cluster averages for shared sanitation; countries in bold were used to establish cluster averages for shared protected wells. The italicized countries are those for which the percentage using shared sanitation was available from JMP. The bolded countries are those for which the percentage of protected wells shared between households could be determined from Demographic Health Survey (DHS) and Multiple Indicator Cluster Survey (MICS) data.
Cluster Countries
1
Australia, Austria, Belgium, Canada, Cyprus, Czech Republic, Denmark, Estonia, Finland, France, Germany, Greece, Iceland, Ireland, Israel, Japan, Latvia, Lithuania, Luxembourg, Malta, Netherlands, New Zealand, Norway, Portugal, Singapore, Slovak Republic, Slovenia, South Korea, Spain, Sweden, Switzerland, United Kingdom, United States
2 Argentina, Belarus, Brazil, Bulgaria, Chile, Colombia, Cuba, Iran, Kazakhstan, Mexico, Oman, Russia, Ukraine, Uruguay, Venezuela
3
Albania, Algeria, Armenia, Azerbaijan, Bosnia and Herzegovina, Costa Rica, Croatia, Dominican Republic, Egypt, El Salvador, FYR Macedonia, Georgia, Iraq, Jordan, Kyrgyzstan, Lebanon, Maldives, Mauritius, Moldova, Mongolia, Sri Lanka, Syria, Tajikistan, Tunisia, Turkey, Turkmenistan, Uzbekistan, Vietnam
4
Belize, Bhutan, Bolivia, Botswana, China, Ecuador, Gabon, Guatemala, Guyana, Honduras, India, Indonesia, Jamaica, Namibia, Nicaragua, Panama, Paraguay, Peru, Philippines, Sao Tome and Principe, South Africa, Suriname, Thailand, Trinidad and Tobago
5
Afghanistan, Angola, Bangladesh, Benin, Burkina Faso, Burundi, Cambodia, Cape Verde, Central African Republic, Chad, Comoros, Congo, Cote d’Ivoire, Democratic Republic of the Congo, Djibouti, Equatorial Guinea, Ethiopia, Gambia, Ghana, Guinea, Guinea-Bissau, Haiti, Kenya, Laos, Lesotho, Liberia, Madagascar, Malawi, Mali, Mauritania, Morocco, Mozambique, Myanmar, Nepal, Niger, Nigeria, Pakistan, Papua New Guinea, Rwanda, Senegal, Sierra Leone, Sudan, Swaziland, Tanzania,
Timor-Leste, Togo, Uganda, Yemen, Zambia, Zimbabwe
Where sanitation values were not provided by the JMP for certain countries in certain
years (most often 1995, 2000 and/or 2010) estimates were made using simple linear regression
techniques based on available data points through Microsoft Excel 2011 software 14. In the 37 countries where there is no data for shared sanitation, the JMP reports these countries as having
no shared sanitation15. In this analysis, these 37 countries were instead allocated to either the WatSan clusters or, if the country was not included in the cluster analysis of Onda and
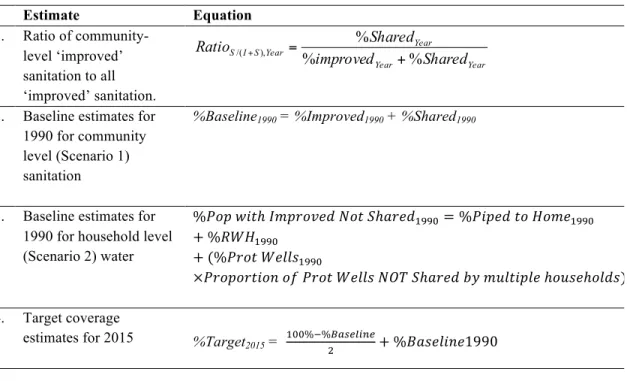
Table 4. Equations used for analysis
Estimate Equation
1. Ratio of community-level ‘improved’ sanitation to all ‘improved’ sanitation. 2. Baseline estimates for 1990 for community level (Scenario 1) sanitation
%Baseline1990 = %Improved1990 + %Shared1990
3. Baseline estimates for 1990 for household level (Scenario 2) water
%!"#!!"#ℎ!!"#$%&'(!!"#!!ℎ!"#$!""#=%!"#$%!!"!!"#$!""#
+%!"#!""# +(%!"#$!!"##$!""#
×!"#$#"%&#'!!"!!"#$!!"##$!!"#!!ℎ!"#!!!"!!"#$%&#'!ℎ!"#$ℎ!"#$) 4. Target coverage
estimates for 2015 %Target2015 = !""%!%!"#$%&'$
! +%!"#$%&'$1990
Water values for missing years were estimated using linear regression as with sanitation,
described above. However, the JMP dataset used in this analysis did not distinguish between
protected wells on premises and shared protected wells, and there are no published estimates on
these relative proportions. To estimate community- versus household-level protected well access
for different countries and years, available data from the DHS 16 and MICS 17 surveys were retrieved to establish mean cluster ratios1 for protected wells on premises that could be applied to all countries included in our analysis. For the developed countries of WatSan cluster 1, it was
assumed that all protected wells were household-level (Table 3).
For some countries urban and rural ‘improved’ water estimates were provided by JMP
but data for piped water and other ‘improved’ categories were not. The relationships between
per capita are strongly positively correlated; therefore, the global regression of these parameters
was used to estimate urban and rural piped water coverage when country-level estimates were
unavailable from JMP. For these and other countries lacking JMP estimates for the other
categories of improved water, the distribution of the fraction of ‘other improved’ into the four
remaining categories (protected well, public standpost, protected spring and rainwater) was
calculated for each MDG region. The corresponding MDG regional averages were then applied
to distribute ‘other improved’ into the four remaining categories.
With assigned values for all missing data, progress under Scenario 1 (with a
community-level benchmark for both water and sanitation) and Scenario 2 (with a household-community-level
benchmark for both water and sanitation) were estimated in accordance with JMP methods 2, 4. For Scenario 1, we combined estimates for ‘improved’ and ‘shared’ sanitation (Table 4, Equation
2) and compared coverage with that under the standard community-level water benchmark used
for the MDGs. For Scenario 2, water access at the household level was calculated by summing
JMP estimates for ‘piped to home/plot’ with those for ‘rain water harvesting’ and the estimated
fraction of ‘protected wells’ not shared by multiple households (Table 4, Equation 3).
Gap-filling was conducted for both scenarios using data from the countries called out in Table 3.
For both scenarios, values for the MDG baseline year (1990) were calculated for both
scenarios in accordance with JMP methods for both benchmarks. Based on this revised baseline,
values for the MDG target year (2015) target were calculated for both scenarios in accordance
with the JMP methodology and the same formula applied to both (Table 4, Equation 4).
Estimates of global coverage under the two scenarios were likewise calculated using the linear
RESULTS
We estimated global progress between 1990 and 2015 on community- and
household-level access to water and sanitation, further disaggregated by rural and urban areas. Using these
alternative benchmarks, we were also able to estimate whether the MDG target, refashioned in
accordance with these alternative benchmarks, would be met under these two scenarios. Finally,
we estimated when universal access to water and sanitation would be achieved using these two
benchmarks.
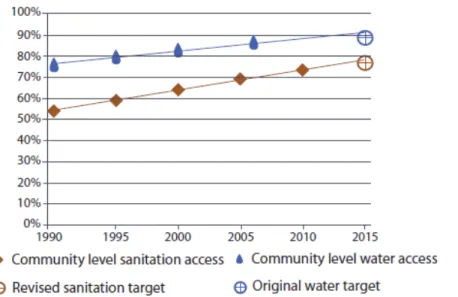
Global progress on community-level drinking water and sanitation (see Table 2 for
definitions) is depicted in Figure 1. Under this scenario, with equivalent community-level
benchmarks for both water and sanitation, the nominal MDG target of halving the proportion
without access is met by 2010 for water and in 2014 for sanitation; both ahead of the 2015 target
date. While the water target is met earlier, the rate of progress for sanitation exceeds that of
water such that the difference in the proportion with access to water versus sanitation is almost
halved between 1990 and 2015. Under this scenario, we estimate that in 2015 the global
population without community-level access to water and sanitation access will be approximately
517 million and 1.58 billion, respectively. We estimate that at current rates of progress, universal
community-level access will not be achieved until 2025 and 2037 for water and sanitation
Figure 1. Global progress with a community-levelbenchmark for water and sanitation (Scenario
1)
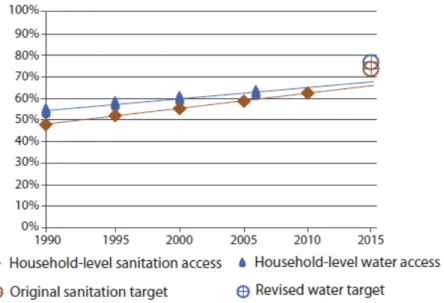
An equivalent household-level access benchmark for both water and sanitation was
considered under Scenario 2 (see Table 1 for definitions). Global progress against this
benchmark between 1990 and 2015 is shown in Figure 2. Under this scenario the estimated
levels of access in 2015 are almost equal such that approximately one third of the world’s
population will lack access to safe water and sanitation at a household level, equivalent to 2.35
billion and 2.46 billion for water and sanitation respectively. The rate of progress for
household-level access is greater for sanitation compared to water such that, on current trends, access to
sanitation at a household-level will overtake that of water in 2022. Based on the same linear
regression, we estimate that universal household-level access will not be achieved until 2075 and
Figure 2. Global progress with a household-level benchmark for water and sanitation (Scenario 2)
!
Globally, levels of access to water and sanitation and rates of progress, whether at a community-
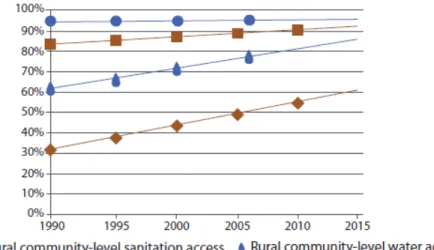
or household-level, vary between rural and urban settings. Figure 3 shows global progress
against a community-level benchmark disaggregated by rural and urban settings. In rural areas,
between 1990 and 2015 substantial progress has been made on both water and sanitation against
a community-level benchmark and the gap between rural and urban levels has reduced
substantially. In urban areas, there has been little change in the proportion without
community-level access to water whilst the proportion without community-community-level access sanitation has
Figure 3. Global progress with a community-level benchmark in rural and urban areas (Scenario 1 & 2).
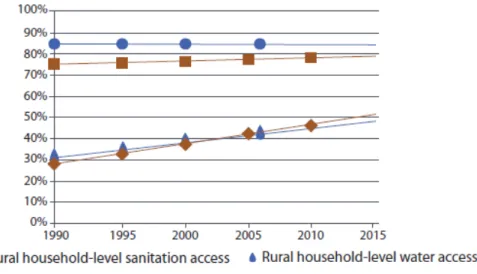
Between 1990 and 2015, levels of household-level access to water and sanitation improve at an
almost equal rate in rural areas (Figure 4). Access to rural household-level coverage for water
and sanitation rose from approximately 949 million for water and 855 million for sanitation in
1990, to 1.69 billion to 1.80 billion respectively in 2015. Although the proportion of the
population in urban areas gaining household-level access to both water and sanitation has
changed little for sanitation and remained constant for water between 1990 and 2015 (Figure 4),
in absolute numbers, we estimate a large change. Between 1990 and 2015, we estimate that an
additional 1.26 billion people will have achieved household-level access to water and 1.29
billion to household-level sanitation in urban areas. These dramatic increases in absolute
numbers have though barely kept pace with increases in the global urban population. In 2015,
we estimate that for water and sanitation respectively 32% and 34% of the global urban
Figure 4. Global progress with a household-level benchmark in rural and urban areas (Scenario 1 & 2).
!
DISCUSSION
Applying equivalent benchmarks to both water and sanitation reveals remarkable
similarity in progress on water and sanitation since 1990 (Figures 1 & 2). Although the
proportion of those with community-level access to water will exceed that of sanitation in 2015,
the proportions with household-level access to water and sanitation will be almost equal (Figure
2). Disparities in levels of access between rural and urban areas are also diminishing (Figures 3
& 4).
The purpose of this analysis was to assess progress on water and sanitation under the
timeframe of the MDGs (1990-2015) considering different benchmarks of access. The two
scenarios constitute alternative benchmarks for monitoring MDG progress, with equivalent
levels of access for water and sanitation in each scenario: Scenario 1 to halve the proportion
without community-level access by 2015, and Scenario 2 to halve the proportion without
considered community-level access the target would have been met before 2015. If, alternatively,
the water benchmark for the MDG target had been household level access, like that for
sanitation, the target would be seriously off-track.
The often reported ‘sanitation deficit’ is apparent only when household-level sanitation access is contrasted with community-level water access, as is done under the current MDG target monitoring framework. Our analysis suggests substantial and comparable progress has been
made since 1990 under the MDG target on both water and sanitation and at both levels of
community and household access; and, that progress towards MDG attainment is broadly similar
under each scenario. Indeed, since 1990, the rate of progress has been greater for sanitation than
for water for both community- and household-level access and in both rural and urban areas.
These benchmarks correspond to important differences in the likely benefits associated
with water and sanitation. The importance of distance to water source in determining the level of
benefits enjoyed by the individual or household has long been recognized. In their seminal study
of domestic water use in East Africa, White, Bradley and White observed that, “diarrhoeal
diseases also seem to diminish when water supplies are made more accessible”11. This observation was confirmed by the findings of a later review on the effect of water supply that
found the only water supply interventions to improve health were those where water was made available at or near the home18. More recent systematic reviews have found that increased distance to water source was significantly associated with an increased risk of diarrhoeal disease
although the reasons for this association could not be elucidated19. These findings are supported by an analysis of household survey data from 26 African countries which found that time spent
walking to a household’s water source was a significant determinant of under-five child health
arguments for this apparent jump in health benefits is that it is driven by a dramatic increase in
use when water is available at the household-level which enables improved hygiene practice21. For sanitation too there is evidence that the benefits of household-level access far
outweigh those offered by community-level access. This is supported by common sense about
relative ease of access, especially at night and for certain sub-populations (including women,
children, people with disabilities and those with chronic diseases). In general, shared facilities
are assumed to be less acceptable to populations and therefore less likely to be used, particularly
by women22. Joshi and colleagues cite two examples of different types of community-level sanitation facility, one in Kenya and one in Bangladesh; the prohibitive costs of the former
driving households to unsafe alternatives, and the latter, with inadequate provision for
maintenance, presenting an environmental risk to the community23. A study of shared toilets in
Bhopal, India, including facilities managed by the community, the municipal authority and
private providers, found that the ratio of male to female users was 2:1 and this was consistent for
both adults and children24. One reason why women, in particular, may not opt to use shared facilities is the associated risk of violence they may experience, whether this be psychological,
physical or sexual25.
Evidence suggests that household-level access is required to maximize the benefits
associated with use of water and sanitation. Indeed many benefits are limited or negated by
community-level access such that human rights obligations of governments to progressively
realize sufficient, safe, and accessible water and sanitation services will be difficult to ensure
without universal household access. The rates of progress for both community- and
household-level access have been remarkably consistent for water and sanitation, likewise across rural and
household-level access to water have led to a substantially lower level of ambition with regard to
water access as compared to sanitation.
If any future water and sanitation goal is to deliver the potential benefits offered by these
services, the benchmarks selected will be critical. The current recommendation is for three
different targets of ascending ambition – by 2025, no one to practice open defecation; by 2030,
universal ‘basic’ access to safe water; and, by 2040, universal access to ‘adequate’ sanitation and
the proportion without ‘intermediate’ drinking water access to be halved – and a fourth
cross-cutting target detailing how the other targets will be reached2. These proposed targets will undoubtedly change but critically these proposals introduce two new parameters relevant to this
analysis: (1) universal access; (2) incremental service levels.
Of the proposed incremental service levels, ‘intermediate’ water access and ‘adequate’
sanitation access are equivalent to household-level access in this analysis. Whilst universal
household-access to sanitation is deemed attainable within the horizons of a post-2015 goal,
universal household-level water access is not. Our analysis though suggests that progress rates
are highly similar such that the same target years are appropriate for water and sanitation for the
equivalent benchmarks of community- or household-level access. Further, our analysis does not
suggest that a household-level access target for safe drinking water is significantly less attainable
than sanitation. This analysis suggests that equivalent targets with household-level access
benchmarks for water and sanitation are both appropriate and attainable.
Limitations
Whilst the use of household surveys, such as the DHS or the MICS, permits estimates of
global estimates of progress, there are limitations to data assembled from different surveys that
have changed over time and require consistent implementation across diverse and complex
settings26. Gunther and Fink in their analysis of the DHS and MICS surveys for 172 countries report the challenges of managing hundreds of different codes for both water and sanitation, and
the JMP uses many other surveys in addition4. In addition, the survey data compiled by the JMP does not have publicly available margins of error such that it was not possible to estimate
confidence intervals for our estimates.
Our methods with regard to missing values for particular years and/or categories of
access differ from those used by the JMP and certain limitations exist. Firstly, a number of
countries were excluded from this analysis due to their size or the fact that no estimates exist for
water and sanitation coverage (Table 1). However, less than 1% of the global population was
excluded from our water analysis and less than 2% for sanitation, and as only global trends have
been reported, any effect of excluding countries on our results will be minimal. Secondly, we
clustered most countries based on comparability across a number of water and sanitation
characteristics, rather than HDI as is commonly used, in order to allocate values for missing data.
This method compares favourably to that used by the JMP with regard to the compactness of
clusters13 but excludes a small number of countries (n=22), however the overall estimate for global progress is likely to be more robust.
The limitations to the data and methods used for this analysis are broadly similar to those
facing the JMP and, as the primary purpose of this analysis is to provide comparable estimates of
progress using different benchmarks, the findings are not necessarily weakened. Further analysis
from the global patterns discussed here. Whilst this analysis considered urban:rural disparities,
there are other parameters for disparity that might be considered. Important among these, based
on recent analysis by the JMP and others1, 27, are socio-economic disparities as captured by comparison on levels and rates of progress between wealth quintiles.
CONCLUSION
The claim that sanitation lags behind water is largely an artifact of the benchmarks
adopted for monitoring progress towards the MDG target. Global progress towards universal
access to both safe water and sanitation at the household level, where the health and other
benefits are maximized, is far off target and the deficit is as great for water as it is for sanitation.
Aligning future goals, targets and monitoring with this challenge is critical to secure the full
health and other benefits offered by water and sanitation. Future benchmarks should be clear and
concise; equally meaningful for those households currently without these services and those with
responsibility to progressively realize these goals. Expressing the targets for a future goal in
equivalent terms of community or household level access for water and sanitation, rather than the
existing terminologies of ‘basic’ or ‘intermediate’, would increase clarity and focus attention on
two critical thresholds. Rendering future targets equivalent will also reinforce the
interdependency of these services, facilitating greater coordination in planning, resourcing and
delivery. One path to achieving this may be a global target with a single benchmark set at the
REFERENCES !
1. WHO/Unicef Progress on sanitation and water - 2012 Update; Geneva New York, 2012.
2. WHO/Unicef Progress on sanitation and water - 2013 update; Geneva and New York, 2013.
3. UNNC, Deputy UN Chief calls for urgent action to tackle global sanitation crisis. UN News Centre 2013.
4. Bartram, J.; Brocklehurst, C.; Luyendijk, R.; Hossain, R.; Fisher, M.; Wardlaw, T.; Gordon, B., Global monitoring of water supply and sanitation: A critical review of history, methods, and future challenges. Environ Health Perspect Manuscript submitted for publication.
5. Bartram, J.; Cairncross, S., Hygiene, sanitation, and water: forgotten foundations of health. PLoS Med 2010,7 (11), e1000367.
6. Liu, L.; Johnson, H. L.; Cousens, S.; Perin, J.; Scott, S.; Lawn, J. E.; Rudan, I.; Campbell, H.; Cibulskis, R.; Li, M.; Mathers, C.; Black, R. E.; Child Health Epidemiology Reference Group of, W. H. O.; Unicef, Global, regional, and national causes of child mortality: an updated systematic analysis for 2010 with time trends since 2000. Lancet 2012,379 (9832), 2151-61. 7. Hutton, G.; Haller, L.; Bartram, J., Global cost-benefit analysis of water supply and sanitation interventions. J Water Health 2007,5 (4), 481-502.
8. Jasper, C.; Le, T. T.; Bartram, J., Water and sanitation in schools: a systematic review of the health and educational outcomes. International journal of environmental research and public health 2012,9 (8), 2772-87.
9. Checkley, W.; Buckley, G.; Gilman, R. H.; Assis, A. M.; Guerrant, R. L.; Morris, S. S.; Molbak, K.; Valentiner-Branth, P.; Lanata, C. F.; Black, R. E.; Childhood, M.; Infection, N., Multi-country analysis of the effects of diarrhoea on childhood stunting. Int J Epidemiol 2008, 37 (4), 816-30.
10. UNGA, Right to Water. United Nations General Assembly, 2010; Vol. A/64/292_A/64/L.63/Rev.1).
11. White, G. F.; Bradley, D. J.; White, A. U., Drawers of water. Domestic water use in East Africa. Drawers of water. Domestic water use in East Africa. 1972.
13. Onda, K.; Crocker, J.; Kayser, G. L.; Bartram, J., Country clustering applied to the water and sanitation sector: A new tool with potential applications in research and policy. International Journal of Hygiene and Environmental Health 2014,217 (2–3), 379-385.
14. Microsoft Microsoft Excel [computer software]
, Microsoft: Redmond, Washington: Microsoft., 2011.
15. Wolf, J.; Bonjour, S.; Pruss-Ustun, A., An exploration of multilevel modeling for estimating access to drinking-water and sanitation. J Water Health 2013,11 (1), 64-77. 16. ICFInternational, Demographic and Health Surveys (various) [Datasets]. Calverton, Maryland: ICF International [Distributor], 2012.: 2004-2012.
17. Unicef, Multiple Indicator Cluster Surveys. Unicef, Ed. Unicef: New York, 2012.
18. Esrey, S. A.; Potash, J. B.; Roberts, L.; Shiff, C., Effects of improved water supply and sanitation on ascariasis, diarrhoea, dracunculiasis, hookworm infection, schistosomiasis, and trachoma. Bulletin of the World Health Organization 1991,69 (5), 609-621.
19. (a) Wang, X.; Hunter, P. R., A systematic review and meta-analysis of the association between self-reported diarrheal disease and distance from home to water source. The American journal of tropical medicine and hygiene 2010,83 (3), 582; (b) Subaiya, S.; Cairncross, S., Response to Wang and Hunter: A Systematic Review and Meta-Analysis of the Association between Self-Reported Diarrheal Disease and Distance from Home to Water Source. The American Journal of Tropical Medicine and Hygiene 2011,84 (3), 504.
20. Pickering, A. J.; Davis, J., Freshwater Availability and Water Fetching Distance Affect Child Health in Sub-Saharan Africa. Environmental Science & Technology 2012,46 (4), 2391-2397.
21. Cairncross, S.; Feachem, R., Environmental health engineering in the tropics: an introductory text. John Wiley & Sons Ltd.: 1993.
22. Chant, S., Cities through a “gender lens”: a golden “urban age” for women in the global South? Environment and Urbanization 2013,25 (1), 9-29.
23. Joshi, D.; Fawcett, B.; Mannan, F., Health, hygiene and appropriate sanitation:
experiences and perceptions of the urban poor. Environment and Urbanization 2011,23 (1), 91-111.
24. Biran, A.; Jenkins, M. W.; Dabrase, P.; Bhagwat, I., Patterns and determinants of communal latrine usage in urban poverty pockets in Bhopal, India. Tropical Medicine & International Health 2011.
26. Hancioglu, A.; Arnold, F., Measuring coverage in MNCH: tracking progress in health for women and children using DHS and MICS household surveys. PLoS Med 2013,10 (5),
e1001391.
27. Rheingans, R.; Anderson, J. D.; Luyendijk, R.; Cumming, O., Measuring disparities in sanitation access: does the measure matter? Tropical Medicine & International Health 2014,19
(1), 2-13.
CHAPTER 2: AT-HOUSE WATER SUPPLIES AND HEALTH: A SYSTEMATIC LITERATURE REVIEW
Alycia Overbo, Ashley Rhoderick Williams, & Jamie Bartram
ROLE IN ANALYSIS !
Alycia Overbo designed the search strategy for this review and screened articles with Ashley
Williams. Alycia Overbo collected and analyzed data and authored this manuscript with the
ABSTRACT
Many studies have found that decreased distance to water source is associated with lower
odds of diarrhea and trachoma, and it is generally accepted that households with at-house water
supplies experience better health. However, the collective body of research literature has not
been collated nor evaluated to weigh the evidence supporting that notion. A systematic literature
review was conducted on the impacts of at-house water supplies on diarrheal diseases, trachoma,
child growth, helminth infections, hepatitis A and E, scabies, and typhoid to further examine the
relationship between household health and distance to water source and to assess whether
at-house water supplies are associated with health gains. Included studies provide evidence that
individuals with at-house water supplies have greater height outcomes and experience lower
odds of diarrheal disease, trachoma, helminth infections, and hepatitis A compared to individuals
with lesser levels of water service. Bacterial diseases were more strongly impacted by use of
at-house water sources than protozoan diarrheal infections. Few studies analyzed the associations
between at-house water supplies and quantity of domestic water supply, hygiene behavior, or use
of multiple water sources, so their respective roles in the health benefits of at-house water
supplies remains unclear. Our review suggests that at-house water supplies are associated with
health gains, and promoting household-level water service through policy and development goals
INTRODUCTION
Water access is an important factor mediating the transmission and prevention of many
infectious diseases. Studies have reported that households in close proximity to their water
sources experience lower prevalence of diarrhea (1,2) and trachoma (3,4) and also use greater
quantities of water (5,6). Per capita water use is an important predictor of health (7); as greater
quantities of water become available, hygiene activities such as hand washing and face washing
become more prevalent (8,9). In addition, studies have found that households in closer
proximity to their water supplies practice improved hygiene behavior (10,11). Hygiene
improvements reflect the Mills Reincke phenomenon of multiplying health gains; for example,
hygiene has been shown to reduce risk and prevalence of respiratory infections (12,13), trachoma
(14,15), and diarrhea (16,17). Repeated episodes of diarrhea have adverse effects on nutrition
and growth in children (18,19), and the use of improved water sources has been associated with
improved child height and weight outcomes (20,21).
Despite the evidence for health gains achieved through improved water access, literature
provides little insight into the health benefits achieved through having a water supply on the
household premises. Households with at-house water supplies may enjoy better health through
proximity to water sources as well as decreased risk of water contamination, which may occur at
the source, during collection, or in household storage (22-24). In order to better characterize the
relationship between household health and level of water service, a systematic literature review
was conducted on the impacts of at-house water sources on child growth and a selection of
METHODS
Search strategy
The literature search was conducted on 10 July 2013 in three computerized databases of
peer-reviewed articles: Embase; Global Health; and PubMed. The search strategy included
terms describing water sources within household premises and water-related pathogens and
health outcomes (Table 5). Health outcomes not included in the search strategy were considered
outside of the scope of this review. No search limits on publication date, language, or study
location were used. Duplicate results were deleted after the initial search. The bibliographies of
accepted studies were also screened for relevant studies.
Table 5. Search strategy.
Term
description Terms used in search strategy Water water
Supply location and quality
private OR shared OR improved OR unimproved OR piped OR pipe OR house OR houses OR home OR homes OR household OR households OR plot OR yard OR dwelling OR premises OR distance OR quantity
Supply synonyms
access OR source OR sources OR supply OR supplies OR connection OR connections
Health outcomes
Inclusion and exclusion criteria
Two reviewers independently screened the titles of all search results and marked
potentially relevant studies for abstract review. Studies investigating water-related health
outcomes, hygiene, household water access, and water supply interventions were marked for
abstract review. Studies researching health outcomes in the following conditions were excluded:
outbreaks; suspected contamination events; natural disasters; conflicts; or refugee camps.
Secondary research was also excluded.
In abstract review, studies having statistical analysis of water access, environmental, or
household conditions as risk factors for water-related health outcomes were marked for full-text
review. Qualitative studies and water quality studies lacking health outcome data were excluded.
Studies excluded in the full-text review had one or more of the following characteristics:
unclear definitions, diagnoses, or rationales for health outcomes; recall periods exceeding 2
weeks for self-reported diarrhea; or lack of statistical analysis of at-house water supplies and
health outcomes. At-house water sources were defined as household piped connections, yard
taps, or wells on premises. For studies where water source location or type was unclear, the
authors were contacted for clarification. Studies published in multiple papers were included
once in the review unless papers reported on different health outcomes of interest.
All studies accepted in the full-text screening were assessed for study rigor. A set of
rigor criteria was developed to distinguish studies that were rigorous and more relevant to this
review. Study rigor was assessed by the following reported factors: description of study setting;
description of study time frame; randomized or systematic participant selection; description of
data collection methods; use of regression or adjusted analysis; and statement of funding or
account for cofounder adjustment as well as individual-level analysis (25). Binary classifications
were used to indicate whether each criterion was met or not, and the rigor score for each study
was calculated as the number of total points over the number of rigor criteria. Studies meeting
80% of all criteria were considered rigorous; studies meeting less than 80% of criteria were
considered less rigorous in reporting and study design. Data on study methods and findings were
extracted from all included studies, and study findings were compared by health outcome and by
rigor assessment.
RESULTS
Search results
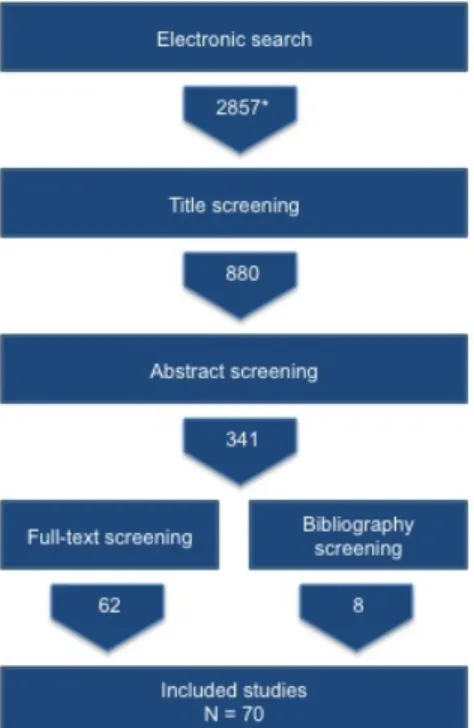
The electronic search yielded 2857 studies (Figure 5). Following review of study titles,
abstracts, and full-text, 62 studies were selected for inclusion in the final analysis. An additional
eight studies were identified from bibliographies, and 70 studies were included in the final
Figure 5. Literature screening and results.
*Number of search results after removal of duplicates
Study characteristics
The 70 included studies included 45 findings on diarrheal diseases, 12 findings on
Hepatitis A and E, 15 for child growth outcomes, six on helminth infections, four on trachoma,
two each on scabies and typhoid, and one finding on otitis media. Seven of the included studies
reported on multiple health outcomes (26-32). Thirty-one studies met 80% or more of the
criteria used for rigor evaluation (Appendix). Common reporting omissions and sources of potential bias identified in rigor assessment were non-systematic or non-representative
participant selection, unadjusted statistical analysis, non-disclosure of funding or conflict of
interest, and not describing the dates and duration of the study. Ten less rigorous studies did not
The number of participants included in the pooled 70 studies totaled 121,041. Of these
participants, the vast majority were children age 18 and under (78,264). Studies exclusively
selecting participants aged five and under recruited 18,361 participants. Eighteen studies
included household participants of all ages and two studies recruited only adults.
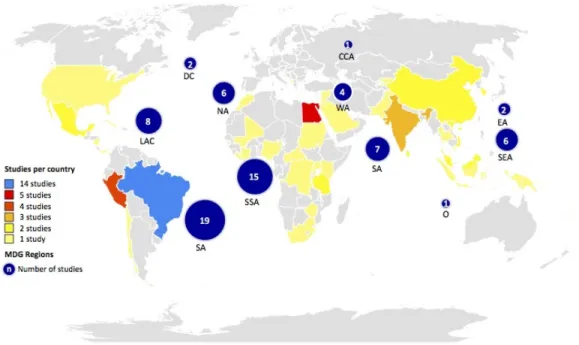
The included studies were conducted in 42 countries and were concentrated in
Sub-Saharan Africa and South America (15 and 19, respectively; Figure 6). Studies were nearly
evenly distributed across the regions of Southern Asia, Latin America, Northern Africa, and
Southeastern Asia, and all but two studies were conducted in developing countries. More studies
were conducted in urban areas than in rural areas (26 and 19, respectively) and 12 studies
spanned rural and urban areas. Seven studies took place in peri-urban areas, and six did not
distinguish between an urban or rural setting.
Figure 6. Geographical distribution of included studies.
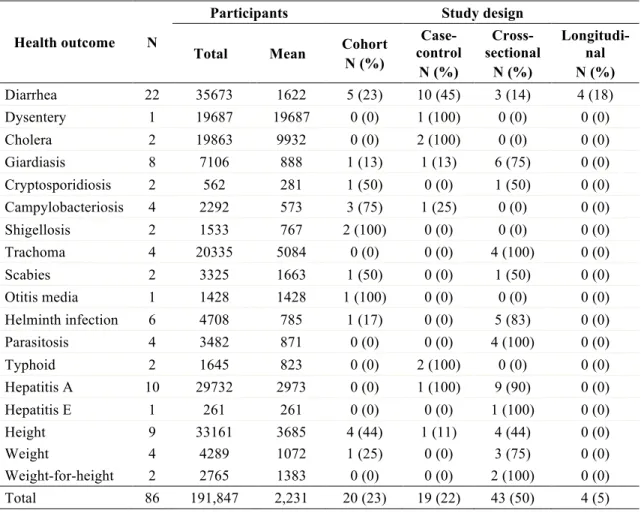
Study design varied across health outcomes (Table 6). Cohort and case-control study
designs were commonly used for studies on diarrheal disease and growth outcomes.
Cross-sectional studies were predominantly used to investigate trachoma, helminth infections, hepatitis
A and E, and other parasitic outcomes. Studies using microscopic stool evaluations or blood
tests generally had cross-sectional design.
Table 6. Description of included studies, by health outcome.
!
Health outcome N
Participants Study design
Total Mean Cohort N (%) Case-control N (%) Cross-sectional N (%) Longitudi-nal N (%) Diarrhea 22 35673 1622 5 (23) 10 (45) 3 (14) 4 (18) Dysentery 1 19687 19687 0 (0) 1 (100) 0 (0) 0 (0) Cholera 2 19863 9932 0 (0) 2 (100) 0 (0) 0 (0) Giardiasis 8 7106 888 1 (13) 1 (13) 6 (75) 0 (0) Cryptosporidiosis 2 562 281 1 (50) 0 (0) 1 (50) 0 (0) Campylobacteriosis 4 2292 573 3 (75) 1 (25) 0 (0) 0 (0) Shigellosis 2 1533 767 2 (100) 0 (0) 0 (0) 0 (0) Trachoma 4 20335 5084 0 (0) 0 (0) 4 (100) 0 (0) Scabies 2 3325 1663 1 (50) 0 (0) 1 (50) 0 (0) Otitis media 1 1428 1428 1 (100) 0 (0) 0 (0) 0 (0) Helminth infection 6 4708 785 1 (17) 0 (0) 5 (83) 0 (0) Parasitosis 4 3482 871 0 (0) 0 (0) 4 (100) 0 (0)
Typhoid 2 1645 823 0 (0) 2 (100) 0 (0) 0 (0)
Hepatitis A 10 29732 2973 0 (0) 1 (100) 9 (90) 0 (0) Hepatitis E 1 261 261 0 (0) 0 (0) 1 (100) 0 (0) Height 9 33161 3685 4 (44) 1 (11) 4 (44) 0 (0)
Weight 4 4289 1072 1 (25) 0 (0) 3 (75) 0 (0)
Weight-for-height 2 2765 1383 0 (0) 0 (0) 2 (100) 0 (0) Total 86 191,847 2,231 20 (23) 19 (22) 43 (50) 4 (5)
Health impacts
Figure 7. Number of studies by assessed rigor, significant health impact, and health outcome.
*Seven studies reported on multiple health outcomes and are represented more than once.
Diarrheal diseases
!
Forty studies investigated associations between at-house water supply and diarrheal
diseases (Appendix). Twelve studies of these studies investigated the health effects of water
supplies as a main research objective (1,27,30,31,33-40); the other studies investigated at-house
water supplies among a broader set of household and environmental risk factors for diarrhea.
experience lower prevalence of self-reported diarrheal disease than households lacking this level
of service, but the evidence within rigorous studies is weaker (Figure 7). In one less rigorous
study, at-house water sources were associated with increased diarrhea prevalence; however, the
study authors observed that following connection, tap water was stored in open containers
instead of used directly from the tap and was subsequently contaminated (27).
Five of eight rigorous studies analyzing self-reported diarrhea found a significant
association between at-house water supplies and lower diarrhea prevalence. A study on
household benefits of at-house water supplies in Vietnam found that longitudinal diarrhea
prevalence was 41% lower in households with water on plot than in households using shared
‘improved’ sources, a statistically significant finding (40). In Pakistan, children under age five
and individuals of all ages having at-house connections and water storage facilities experienced
49% lower risk of diarrhea than under-fives and individuals in unconnected households (36).
Seasonal effects were found in a cross-sectional study in Mexico City, which reported that
prevalence of diarrhea among children under five was 60% lower in households with piped
connections during the dry season, a significant finding, but there was no significant difference
found in the wet season (41). Two case-control studies selected participants from health centers;
use of at-house water supplies was significantly associated with lower diarrhea risk in
multivariate analysis of one study, and in the second study, it was significant in adjusted analysis
but not the hierarchical model (38,42).
Four rigorous studies reported no statistically significant association between at-house
water supplies and self-reported diarrhea. At-house water sources showed no association with
infant diarrheal outcomes in a longitudinal study in rural Egypt; however, the authors noted these
Nicaragua and a longitudinal study in Morocco found no association between at-house water
supplies and diarrhea (1,39). A cohort study in Peru found that children aged 24 months with
household-level water and sanitation services and greater water storage had lower risk of
diarrhea than children from households lacking water connections, lacking sewage, and having
smaller storage containers, but lack of access to at-house water supplies was not a significant risk
factor (31).
Among the studies in which etiology or stool examination for diarrheal disease agents
was reported, at-house water was associated with lower odds of campylobacteriosis and
shigellosis (Figure 7). The pooled giardiasis studies do not indicate a clear relationship with use
of at-house water sources. Two studies on cryptosporidiosis found no health impact from use of
at-house water sources. Evidence was divided in two studies on cholera (Figure 7); the majority
of cholera studies identified in screening were excluded for being conducted during outbreak
conditions.
Height and weight
Pooled findings from studies investigating child height and weight outcomes indicate that
at-house water supplies are associated with greater stature and height-for-age but have no
observable effect on wasting (weight-for-height) or underweight (weight-for-age) status. Four of
six rigorous studies reported that children with at-house water supplies had greater height than
children lacking at-house water supplies in analyses adjusted for socioeconomic status. Brazilian
households with piped water in the home were significantly less likely to have children below
the 10th length-for-age percentile than households lacking piped water, but had no significant
differences in underweight or wasting (29). In Pakistan, children from households with water
connections (44). Connected households without storage experienced intermittent water supply
and did not have significantly different height-for-age than children from unconnected
households, indicating that continuous water supply was associated with greater height-for-age
(44). A cohort study in rural Sudan found that households with both water and sanitation at
home had less stunting and were twice as likely to reverse stunting by the end of the study than
households lacking water and sanitation (45). Among households lacking sanitation, the risk of
stunting was 21% lower in households with water connections, but in households with sanitation
at home, risk of stunting incidence was not significantly different between households with and
without at-house water supplies (45). Children with indoor water supplies were 72% less likely
to be malnourished than children with water sources off premises in Brazil, but indoor water
supplies were not significantly protective in the hierarchical model (46).
Two rigorous studies found no significant difference in stature or weight between
children using at-house water supplies and children using water sources off plot. Children under
five in Sri Lanka with piped water did not experience significantly different stunting or wasting
outcomes than children with water from handpumps, protected wells, or unimproved sources
(47). Children in Peru with household water connections were 0.6 cm (95% CI -0.1-1.4) taller at
age 24 months than children of the same age without household connections, but the difference
Trachoma
All three rigorous, cross-sectional trachoma studies reported significantly improved
outcomes for households with water on plot or piped into the home. A study conducted in Mali
found that children from households with traditional wells in the yard were 37% and 50% less
likely to have active and intense trachoma, respectively, in comparison to children using shared
sources (48). Trachoma prevalence was highest among children using distant river or pond
water, and intermediate prevalence was found among for children using community borehole
wells (48). Similarly, children in Ethiopia with access to only river or lake water had over twice
the odds of active trachoma as children with piped water (4). A study in Brazil found that
children having outdoor or no piped water had 3.6 times the odds of trachoma as children with
indoor water connections (49). The fourth, less-rigorous trachoma study found that active
trachoma prevalence was slightly greater in households with outdoor taps rather than indoor taps,
and households with no plumbing had the highest prevalence, however the results were not
statistically significant (50).
Hepatitis A and E
Study findings on hepatitis A and E collectively indicate health benefits from at-house
water supplies; two of three rigorous studies found lower seroprevalence of hepatitis A in homes
with water connections. The hepatitis A seroprevalence among students with at-house water
supplies was 24% lower than among students without at-house water (51). A study conducted
across regions of Brazil found regional differences in hepatitis A risk factors (52). Water supply
coverage and regularity were not associated with hepatitis A infection in the Northeast region,
Midwest region, and Federal district, but seroprevalence in the Midwest region was nearly two
study in Rio de Janeiro, water source was not associated with hepatitis A outcomes, but water
treatment with a ceramic filter was weakly protective (53).
Helminth and parasite infections
Three of four rigorous studies found significant health benefits from at-house water
supplies on helminth infections. In Kyrgyzstan, individuals without at-house water supplies had
nearly two times the odds of Ascaris lumbricoides infection as individuals with at-house water supplies, but at-house water supplies were not statistically associated with improved Enterobius vermicularis and Dicrocoelium dendriticum outcomes (54). Individuals using communal wells in India were twice as likely to be infected with Trichuris and have higher intensity Trichuris
infections as individuals with indoor plumbing (55). Piped water and handwashing after
defecation were each associated with lower prevalence of Trichuris and Ascaris in Malaysia, and handwashing before eating was also associated with lower prevalence of Ascaris (56).
A fourth rigorous study on helminth infections in Côte d’Ivoire found that using wells on
premises was a significant risk factor for hookworm infection. The authors suggested that the
shaded, moist soil around the wells created a good habitat for hookworm larvae (57). Two less
rigorous studies did not find significant associations between at-house water supplies and
helminth infections (26,28). These two older studies analyzed community prevalence data with
the chi-square test and did not analyze or adjust for individual risk factors such as age or access
to sanitation.
Four studies investigated prevalence of helminth infections and pooled giardiasis,
hookworm infection, ascariasis, trichuriasis, and schistosomiasis in the analysis (32,58-60). One
of these found a significant association between at-house water supplies and risk of helminth