Sharif University of Technology
Scientia IranicaTransactions B: Mechanical Engineering http://scientiairanica.sharif.edu
Numerical 3D simulation of developing turbulent
stratied gas-liquid ow in curved pipes consisting of
entrained particles through this type of ow
M.A. Rasoulian
a, A. Rasteh
a, A. Farokhipour
a, Z. Mansoori
b,
M. Saar-Avval
a;, A. Haj
b, and G. Ahmadi
ca. Department of Mechanical Engineering, Amirkabir University of Technology, Tehran, Iran. b. Energy Research Center, Amirkabir University of Technology, Tehran, Iran.
c. Department of Mechanical and Aeronautical Engineering, Clarkson University, Potsdam, NY, USA. Received 6 May 2018; accepted 27 August 2018
KEYWORDS Gas-liquid multiphase ow;
Stratied ow; Particle tracking; Curved pipe; Numerical analysis.
Abstract. Since curved pipes are widely used in industrial equipment, predicting multiphase ows in these geometries is of great importance. In the present study, a computational model for predicting the velocity prole is developed and used to study the developing turbulent gas-liquid ows in curved pipes. In order to discretize and solve the three-dimensional steady-state momentum equations, the nite volume scheme on staggered grids as well as central dierence and QUICK scheme have been used. Moreover, the k " model has been employed to reect the nature of turbulence in the ow. In order to address the needs for faster convergence and convenient mapping of the physical domain, the computations have been performed in a newly extended coordinate system. Particle tracking has been done using Lagrangian approach in which a two-way coupling regime has been considered. In terms of validation, the numerical simulation results for the straight pipe have been compared with the analytical solution and previous experimental results. Moreover, injection of particles through the ow indicates that, in each section of the bend, the trade-o between centrifugal and pressure gradient forces plays a key role in particles' motion. In the last section, the eects of particle diameter and bend curvature on particles' motion have been examined.
© 2018 Sharif University of Technology. All rights reserved.
1. Introduction
Behavior of multi-phase ows in curved pipes is of use for many industrial applications. Since bends are widely exploited, particularly in pieces of equipment
*. Corresponding author.
E-mail addresses: [email protected] (M.A. Rasoulian); [email protected] (A. Rasteh); farokhipour [email protected] (A. Farokhipour); [email protected] (Z. Mansoori); [email protected] (M. Saar-Avval); [email protected] (A. Haj); [email protected] (G. Ahmadi)
doi: 10.24200/sci.2018.50868.1896
of gas and oil industry, the computational modeling of such ows in these geometries can help predict the ow behavior passing through them to a large extent. The stratied ow velocity proles of both gas and liquid phases, pressure losses along the passage, and sec-ondary ows occurring along the pipe are signicantly aected by the curved section. Furthermore, in the production procedures, since the entrainment of sand particles to transmission lines frequently carrying gas-liquid ows is an inevitable issue during this process, their behavior should be carefully considered to prevent probable consequences such as pressure loss, erosion, and equipment failure. Among the geometries, bends
are more prone to erosion phenomenon due to the impingement of particles on the wall downstream of the curved section at which particles, because of their inertia, are not able to follow the streamlines and, consequently, detach from them and impact the inner surface of the pipe. Many pieces of research available in the literature, mostly conducted experimentally, are devoted mainly to the pressure drop across the bend, bulk ow measurements, and mean void fraction of gas and liquid phases [1,2]. In many applications, however, more detailed information of turbulent stratied ow, such as gas and liquid velocity proles, as well as the location and strength of secondary ows, can facilitate the prediction of the particle's motion and erosion wear caused by entrained particles in multiphase ows through the bend.
The multi-phase ows in curved geometries are generally more complex than those in straight ones are. This may be the reason why there is a rather limited amount of research in this area. The available literature includes semi-empirical studies; for instance, Gardner and Neller [3] implemented visual and experimental studies on bubble/slug ows using a pipe of 76 mm diameter in a vertical 90elbow with radii of curvatures
of 305 and 610 mm. In their work, they used a traversing probe to measure the local time-averaged air concentration. They reported that gas could ow either on the outside or the inside of the bend depending on the balance between the centrifugal force and the gravity. The trade-o between these two forces is expressed in terms of Froude number:
F r= V2=ga sin ;
where V is the mixture mean velocity, a is the radius of curvature of the bend, and is the stream-wise angle across the bend. It is noteworthy that the phases are owing in radial equilibrium when the Froude number is equal to unity. For F r > 1, the gas is displaced towards the inside of the bend, while, for F r < 1, the gas moves to the outside of the bend. An experimental study was performed on two-phase mixture owing in an inverted U-bend by Usui et al. [4,5]. They measured some gures such as the local void fraction distribution, averaged void fraction over the bend with the aid of quick closing valves, and slip ratio both through and in the vicinity of the bend. As a result of their work, they found that the secondary ow in bend would have governing eects upon the distribution of void fraction across the whole cross-section of the pipe. Das et al. [6] and Bandyopadhyay et al. [7] performed an experimental study of gas/non-Newtonian liquid ow through a 12.7 mm curved pipe. They managed to develop an empirical correlation to estimate the pressure drop over the passage as a function of dynamic variables and physical parameters
of the system. In another investigation by Ribeiro et al. [8], drop sizes upstream and downstream of a 90,
32 mm internal diameter bend on a horizontal plane were measured. Their results demonstrated that the drop sizes downstream were 50-75% of those upstream. From their point of view, this trend was attributed to thicker lms caused by the initial deposition induced by the secondary ow that occurred in the gas phase. Moreover, they found that the ratio of downstream to upstream entrained fraction would decrease with a rise in the upstream entrainment fraction. Azzi et al. [9] considered dierent correlations to estimate the pressure loss of the variety of ow conditions, the bend orientation, and geometries; eventually, they decided that in order to calculate adequately the two-phase ow pressure loss in both vertical and horizontal ducts in wider parameter ranges, the eect of gravitational force in experiments should be taken into account.
Comprehensive studies concerning the eect of the bend on the ow elds of a two-phase air/water mixture were performed by Wang et al. in horizon-tal [10,11] and vertical return bends [12,13]. In these studies, for the horizontal experiments, return bends with 3-6.9 mm diameter and curvature ratios (curvature radius/pipe diameter) of 1.5, 2.5, and 3.5 were used, while a single bend geometry (6.9 mm ID and curvature ratio of 1.5) was exploited for the vertical cases, and the distribution of the phases was observed through still photography. In their investigation, the eects of parameters, such as tube size, mass ux, and curvature ratio, were examined. Finally, with the aid of visual observation in the horizontal bends, the transition of ow regime from stratied to annular ows was detected. On the other hand, for the vertical return bend with D = 6:9 mm, some unique phenomena, such as ow reversal and frozen slug ow, were observed absent in previously reported results for horizontal congurations. However, such phenomena (the ow reversal and freezing slug) were hardly seen at a smaller tube (D = 3 mm) owing to the eect of the surface tension and ow inertia.
Spedding and Benard [14] measured the pressure drop of a two-phase air/water pipe ow and three-phase air/oil/water through a 26 mm ID pipe and elbow (curvature radius/pipe diameter = 0.654) for vertical to horizontal ows. Two-phase results were highly dependent on the ow regimes present in the system. Three-phase data also showed noticeable, yet undramatic, dierences. Recently, several investigators have implemented a few local measurements across an elbow by a wire-mesh sensor. Abdulkadir et al. [15] considered the ow elds of a 90 bend (curvature
radius/pipe diameter = 2.3) with the aid of advanced instrumentation, including Wire-Mesh Sensor (WMS) and Electrical Capacitance Tomography (ECT), to produce cross-sectionally resolved data on void fraction
and high-speed video. Although, for the vertical 90
bend, they observed that bubble, stratied, slug, and semi-annular ows were present downstream, the ow regime showed the same congurations upstream of the bend for the horizontal 90 bend. As a result
of another work of theirs, they found that ECT and WMS predicted the same ow pattern signatures. Furthermore, in both the vertical and horizontal 90
bends, the gravitational force tends to move the liq-uid and gas to the inside and outside of the bend, respectively. Dierent slug characteristics, such as the liquid slug body length distribution, were identied by Kesana [16]. They also obtained the frequency of the slugs from void fraction data using dual wire-mesh sensors in the horizontal ow orientation. In their investigation, they examined the discrepancies between the properties of the slug ow and pseudo-slug ow regimes upstream and downstream of an elbow. In another study involving a dual wire-mesh sensor, Vieira et al. [17] focused on the two-phase stratied-slug transition, stratied wavy, and annular ow regimes before and after a horizontal stainless steel elbow with an internal diameter of 76.2 mm and 144 mm radii of curvature. Time series analysis of void fraction data from WMS resulted in determining mean void fraction, local time-averaged void fraction distribution, liquid phase distribution around the peripheral surface, interfacial structure velocities, as well as characteristic signatures within the cross-section of pipe before and after the elbow. In their research, the eect of some factors, such as the supercial liquid and gas velocities and liquid viscosity, on the measured parameters were examined. The results indicated that the distribution of gas and liquid phases and interfacial velocities were signicantly changed, even for 20D downstream of the elbow. A comprehensive experimental study of gas-solid heat transfer in a pipe with dierent congura-tions (horizontal, inclined, and vertical posicongura-tions) was implemented by Mokhtarifar et al. [18]. The eects of parameters, such as pipe slope and feed rate of solid particles, on the Nusselt number were examined. Results showed that the Nusselt number, in a dilute regime of the mixture, decreased to a lower feed rate of solids; conversely, at higher feed rates of solids, it increased. Importantly, Nusselt number took higher values close to the pipe position of 45.
In terms of CFD simulations, Nojabaei et al. [19] investigated heat transfer in a turbulent liquid-solid suspension upward ow in a vertical pipe where a four-way coupling regime was considered. During the simulation, the eects of loading ratio, particle density, and particle diameter on heat transfer coecient were discussed. The results illustrated that particle to liquid density had a prominent eect on heat transfer and turbulence characteristics. The turbulent heat transfer in gas-solid ows through an inclined pipe
with various inclination angles under a constant wall heat ux condition was investigated by Pishvar et al. [20]. According to the report of their study, an increase up to a certain angle led to a signicant surge in Nusselt number. Dabirian et al. [21] conducted a research study using a commercial CFD code for 4-in horizontal pipe carrying stratied turbulent air/water and presented the results such as liquid holdup, liquid height, wall shear stress, and velocity proles. Haj et al. [22] used a new form of the toroidal coordinate system to address the need for convenient mapping of the physical domain, where uid ow pattern was considered laminar and stratied. In addition, they employed bipolar coordinate in curved pipe cross-section. They achieved results by assuming the eect of liquid phase as a boundary condition at interfacial surface and considering the angular displacement of liquid phase negligible. They reported that several vortices were formed in the gas phase whose size and strength varied along the curved section.
Currently, simultaneous Particle Image Ve-locimetry (PIV) measurements of stratied turbulent air/water ow in a horizontal pipe were performed using water droplets as tracers in the gas phase by Ayati et al. [23]. The two-phase ow measurements indicated the expected behavior of low ow rates and very interesting features related to the turbulence structure at higher ow rates that led to wavy inter-faces. Inspired by the ongoing approach, Vestl et al. [24] produced detailed velocity prole measurements over a range of operating conditions of a two-phase gas/liquid ow with low liquid fractions in horizontal and inclined pipes. The experiments were implemented in a 15 m long stainless steel pipe with internal diam-eter of 56 mm at room temperature and atmospheric outlet pressure. In general, higher axial velocities were observed in the gas phase. Higher velocity gradients were observed close to the pipe wall and interface. Based on the horizontal gas-liquid ow measurements, the maximum velocity was located close to halfway between the interface and the upper wall.
Since the entrainment of solid particles into pipes carrying crude oil is an inevitable and inseparable part of production procedure in oil and gas industry, prediction of particles behaviour, particularly particle deposition, can prevent operational problems such as a decrease in production, excessive pressure drop, erosion, corrosion, and, consequently, equipment fail-ure. The operational condition, in which continuous movement of particles through the pipe is guaranteed, will be the best approach to confront the deposition issue. This condition can be managed by operating above the critical particle deposition velocity, which is the velocity that satises the desired operational condition. In order to address this requirement, a few investigations regarding the particles in two-phase
ows were performed. Stevenson and Thorpe [25] ex-perimentally measured the average velocity of particles in a smooth stratied ow through curved pipes. They found that particle velocity followed a linear trend with respect to the average velocity of the liquid phase of the ow. Moreover, it was seen that larger particles moved more quickly than smaller ones along the pipe. As a result of their experiments, they found that particle velocity decreased with increasing the liquid viscosity. This could be justied by considering the particle size relative to the depth of the viscous sublayer. Another experimental study was conducted by Dabirian et al. [26] in a 4-in horizontal pipe carrying a stratied ow to examine the behaviour of solid particles (glass beads) with concentration ranges of 100 to 10,000 ppm. In their research, ow regime sequences of three ranges of particle sizes were investigated. They introduced gas velocity, particle concentration, and liquid holdup as key parameters for the creation of dierent particle regime ows. Furthermore, they reported that the dependence of critical particle deposition velocity on particle size increased as their sizes increased; by the same token, the critical particle deposition velocity rose. In addition, when the concentration of par-ticles increased, the critical velocity remained fairly unchanged for the smaller particles, while it gradually increased for larger ones ( 125 m). Moreover, some of the most important characteristics of the stratied air-water ow in a mini-channel were studied by means of a rule-based fuzzy inference system by Zehtabiyan-Rezaie [27]. Their analysis demonstrated that the system was a viable approach to avoid signicant computation cost of the numerical simulations. In the case of CFD prediction of erosion phenomenon, Banakermani et al. [28] simulated a range of elbow angles for two dierent ow orientations; horizontal inlet and outlet ow directions (H-H ow) and the cases with vertical inlet and outlet ows on the horizontal plane, or with some angles (V-H ow). They found that the total annual eroded volume in the H-H case conguration was larger than that in V-H case gure. Moreover, their results showed that, in both V-H and
H-H cases, over the range of mass loadings under investigation, the maximum erosion rate increased gradually when the elbow angle increased from 15 to
90; however, the rate of total eroded volume remained
relatively constant over the sand rate range.
The thrust of this work is to study the de-veloped turbulent stratied gas-liquid in horizontal curved pipes consisting of entrained particles. A computational model of predicting velocity proles and secondary ows has been developed. The three-dimensional steady-state momentum equations, by means of the k " turbulence model, have been discretized and solved using the nite volume scheme. The computations have been performed in the ex-tended form of toroidal and bipolar coordinate systems. Axial velocity contours and secondary ows have been predicted in the gas phase in the curved pipe in four axial sections over the bend. Particle tracking has been implemented by the Lagrangian approach considering the two-way coupling regime. The behavior of particles has been discussed in three cross-sectional positions of the pipe along the curved section, and the eects of particle diameter and bend curvature on particles' motion have been examined. Experimental results and analytical data for the case of the developed stratied gas-liquid ow in curved pipes have been used to validate obtained results.
2. Mathematical formulation 2.1. Coordinate system
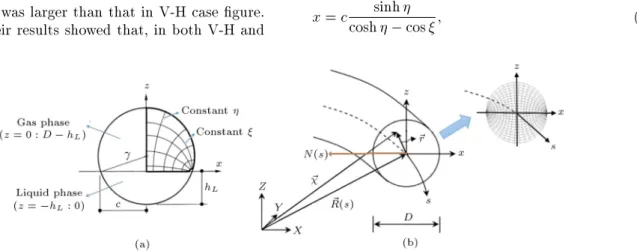
In this study, in order to match the coordinate system with the ow conguration in curved geometries, the orthogonal toroidal coordinate system is used to simu-late the turbulent stratied ow in curved pipes. The toroidal coordinate system is depicted in Figure 1. The liquid and gas domains in stratied pipe ow, as shown in Figure 1, are modelled by the bipolar coordinate system in the pipe cross-section described as follows:
x = ccosh cos sinh ; (1)
Figure 1. (a) Schematic diagram of the new toroidal coordinates system (; ; s). (b) The bipolar coordinate at the pipe cross-section.
z = ccosh cos sinh ; (2) 8 > > > < > > > :
< ; 1 < < 1 for upper uid( air) < + ; 1 < < 1
for lower uid (water)
(3)
where c and , as illustrated in Figure 1, are focal length in bipolar coordinate system and the half-view angle of the interface from the centre of the pipe, respectively. In other words, is equal to half of the angle subtended by the centre of the pipe and the gas-liquid interface and is dened as follows:
= cos 1
1 2hDL
: (4)
Herein, hL and D represent the liquid height and
pipe internal diameter, respectively. In this study, in order to address the needs for faster convergence and convenient mapping of the physical domain, a new form of the toroidal coordinate system is created and used. Therefore, the Navier-Stokes governing equations need to be stated in the frame of the aforementioned coordinate system. Accordingly, a bipolar coordinate system should be expressed in the reference Cartesian coordinate system XY Z. The position of any point through the curved geometry can be dened by vector ~. Thus, ~ can be calculated by:
! =!R (s) + !r ; (5) where ~R(s) and ~r (in the reference Cartesian coordinate system XY Z) are described as follows:
!R (s) = a cos s a
bi+ a sin sabj; (6) !r = c sinh
cosh cos !
N (s) + ccosh cos sinh bk; (7) where a is the radius of curvature of the curve, s is axial direction (stream-wise direction), and ~N(s) represents the principal normal vector of s and is described by:
!N (s) = cos s a
bi sin sabj: (8) Thus, the position of each point inside the curve in the reference Cartesian coordinate system XY Z can be dened by vector ~ as follows:
! =a cos s a
+ ccosh cos sinh cos sabi +
a sin sa+ ccosh cos sinh sin sabj + ccosh cos sin bk: (9)
The corresponding scale factors (metric coecients) are provided by:
h=
q
(@X/@)2+ (@Y/@)2+ (@Z/@)2
= 1
cosh cos ; (10)
h=
q
(@X/@)2+ (@Y/@)2+ (@Z/@)2
= cosh cos 1 ; (11)
hs=
q
(@X/@s)2+ (@Y/@s)2+ (@Z/@s)2
= 1 +a (cosh cos )c sinh : (12)
2.2. Governing equations
The Reynolds-Averaged Navier-Stokes (RANS) conti-nuity and momentum equations for steady-state in-compressible and viscous ow in the curvilinear new coordinates system (; ; s) are given as follows [29]:
Continuity: 1 hhhs
@ (hhsu)
@ +
@ (hhsv)
@ +
@ (hhw)
@s
=0: (13)
momentum: 1 hhhs
@ (hhsUU)
@ +
@ (hhsV U)
@
+@ (h@shW U)
+hV
h
U@h@ V@h@
W hhs
W@h@s
= h1
@p @+ h @ @ 1 hhhs
@ (hhsUU)
@
+@ (h@hsV U)+@ (h@shW U)
hhs
@ @
hs
hh
@ (hV )
@ @ (hV )
@ @ @s h
hhs
@ h
V
@ (hsV )
@
+ g+ Spu
+ r:
u0!v0
: (14)
momentum: 1
hhhs
@ (hhsUV )
@ +
@ (hhsV V )
@
+@ (h@shW V )
+hU
h
V@h@ U@h@
W hsh
W@h@s
= h1
@p @+ h @ @ 1 hhhs
@ (hhsUV )
@
+@ (h@hsV V )+@ (h@shW V )
hhs
@ @s
h
hhs
@ (hsW )
@ @ (hV )
@s @ @ hs
hh
@ (hV )
@ @ (hV )
@
+ g+ Spv
+ r:
v0!v0:
(15)
s momentum: 1 hhhs
@ (hhsUW )
@ +
@ (hhsV W )
@
+@ (h@shW W )
+hU
hs
W@h@s
+hV
hs
W@h@s
= h1
s @p @s+ hs @ @s 1 hhhs
@ (hhsUW )
@
+@ (h@hsV W )+@ (h@shW W )
hh
@ @
h
hhs
@ (hU)
@s
@ (hsW )
@ @ @s h
hhs
@ (hsW )
@ @ (hV )
@s
+ gs+ Spw
+ r:
w0!v0: (16)
Herein, u, v, w are the velocity components, U, V , W are the mean velocity components, u0, v0, w0 are the
uctuation velocity components, and Su
p, Spv, Spw are
the sources or sink terms when the particles exist in the ow eld, and the career uid is inuenced by them (two-way coupling regime); in , , and s directions, they are respectively dened by:
Su p = 'p
p dup dt g ; (17) Sv p = 'p
p dvp dt g ; (18) Sw p = 'p
p
dwp
dt gs
; (19)
where 'p and pare particle mass loading and density,
respectively. Apart from the situation where the ow regime is considered as two-way coupling, these terms are neglected. The last term on the right-hand sides of momentum equations reects the eect of turbulence through the ow eld in terms of turbulent stress. In order to solve the RANS equations, extra modelling for Reynolds stress term (u0
iuj0) is required. This term is
dened by [30]:
ij = ui0vi0= t
@Ui
@xj +
@Uj
@xi
2
3kij; (20) where k is the turbulence kinetic energy per unit mass quantied by the mean of the turbulence normal stresses. Thus, it is computed by:
k = 12u02+ v02+ w02: (21)
In the case of this work, among several turbulence models, which are developed to calculate the Reynolds stress term, the two equations of standard k " turbu-lence model are selected. The turbuturbu-lence model that can provide excellent performance for ows, in which boundary layers under adverse pressure gradient, sep-aration, and recirculation exist, has been successfully applied to this CFD simulation. The two equations of the standard k " turbulence model to calculate the turbulence kinetic energy, k, and dissipation rate, ",
are, respectively, written as follows:
r:k!V= r:
t
krk
+ 2tSij:Sij "; (22)
r:"!V=r:
t
"r"
+C1"k"2tSij:Sij C2"" 2
k;(23) where trepresents the eddy viscosity and is computed
as follows: t= Ck
2
" : (24)
In these equations, Sij represents a component of
deformation rate, and the model constants are k =
1:00, "= 1:30, C1"= 1:44, C2"= 1:92, and C = 0:09.
2.3. Particle tracking
In this step of the study, the sand particles are injected from the pipe inlet into the ow and tracked using the Lagrangian approach. Inspired by Newton's second law, the particle's motion represents a direct consequence of the trade-o between forces acting on them, which is dened by:
mpd
! Vp
dt = !
FD+F!A+F!P+F!g; (25)
where mp is the particle mass, Vpis the velocity of the
particle, F!D is the drag force, F!A is the added mass
force, F!P is the pressure-gradient force, and F!g is the
resultant of gravity and buoyancy forces. These forces are calculated according to Eqs. (26) to (29) [31]:
!
FD=34fmpCD pdp
V!f !Vp!Vf V!p
; (26)
!
FA= 12mpf p
d!Vp
dt ; (27)
!
FP = 14dp3rp; (28)
! Fg= mp
1 f
p
!g : (29)
Herein, f, Vf, and dp are uid density, uid velocity,
and particle diameter, respectively. CD is the drag
coecient based on Schiller and Naumann model [32], and:
Rep=
fdpV!f V!p
f ;
where f is the dynamic viscosity of uid; Rep
repre-sents the particle Reynolds number. The fourth-order Range-Kutta method is used to solve Eq. (25).
The Crowe model [33] has been used to model the collision of the particle with the wall and the gas-liquid interface. The return velocity is usually lower than the collision velocity, and the reason for this drop is the energy transfer from the particle to the wall. The return velocity depends on several important factors: wall and particle material, angle of incidence, and velocity of incidence. According to this model, the particle velocity components after the collision can be calculated as follows
8 > < > :
vx= vx(0)+ "xf (e + 1) vy(0)
vy= evy(0)
vz= v(0)z + "zf (e + 1) v(0)y
(30)
where v(0)x , v(0)y , v(0)z are the components of the velocity
of incidence; vx, vy, vz are the components of return
velocity; f represents the skin friction coecient of wall; e is the coecient of restitution; and "x and "z
represent the direction cosines on x z plane. The coecients of restitution and friction at the wall and interface include ew = 0:95, eint = 0:6, fw = 0:3, and
fint= 0:5.
3. Denition of problem and model
The current research concentrates on a horizontal curved pipe with an internal diameter of 100 mm and the radius of curvature of a = 300 mm, which carries the two-phase turbulent stratied ow with low liquid holdup. The length of the 90 curved pipe is 471 mm.
Liquid holdup at the bottom of the pipe is assumed to have a depth of 10 mm. In other words, water occupies 5.76% of the cross-section of pipe; consequently, the bulk of the pipe volume is lled by gas. There is a reasonable assumption during the simulation by which liquid height is considered unchanged. In this situation, the gas phase can be separately modelled, and the eect of liquid phase appears as boundary conditions at the gas-liquid interface. The continuous phase is air with the density of 1.2 kg/m3 and the dynamic viscosity of
1:51 10 5 N.s/m2.
Inuenced by centrifugal force, the gas-liquid interface in the bend section is displaced from the horizontal position. Based on the assumption of the smooth interface between gas and liquid, Castillo [2] acquired an analytical expression for angular deviation of gas-liquid interface from the horizontal pipe axis, as depicted in Figure 2 and given as:
' =wl2 ag
1 cos
r gy K02t
; (31)
where ' is the liquid free surface angle with the horizontal surface as shown in Figure 2, wlis the mean
stream-wise (axial) velocity of liquid phase, y is the dis-tance between cross-sectional center of gravity of liquid
Figure 2. Angular displacement of gas-liquid interface from the horizontal pipe axis.
phase and pipe axis, and K0 represents cross-sectional
gyration radius of liquid part about the pipe axis. According to Eq. (31), the maximum angular deviation is equal to 2w2
l=ag. It is worth mentioning that Eq. (31)
is only reasonable for very small angular deviations. In this investigation, the mean velocities of the liquid and gas phases are considered as 0.02 m/s and 4 m/s, respectively. According to these values and Eq. (31), the maximum displacement is 0.016.
Since the angular deviation is negligible, in this study, the alteration of gas-liquid interface from completely horizontal position has been ignored. In order to ensure that the ow pattern does not vary as the ow passes through the curved section, a qualitative analogy with the experimental results obtained by Vieira et al. [17] has been drawn. Experiments of the gas-liquid stratied wavy ow with gas void fraction of 0.93, supercial liquid velocity of 0.03 m/s, and supercial gas velocity of 9 m/s passing through the 90 elbow
with curvature ratio, , (pipe radius, R/curvature radius, a) of 0.3342; accordingly, the ow pattern was not displaced from the horizontal position. In this work, since the curvature ratio of the considered bend is 0.17 (50/300), the induced centrifugal force is much lower; consequently, the corresponding maximum angular deviation is smaller; therefore, the aforemen-tioned assumption is not far away from the fact.
4. Numerical method
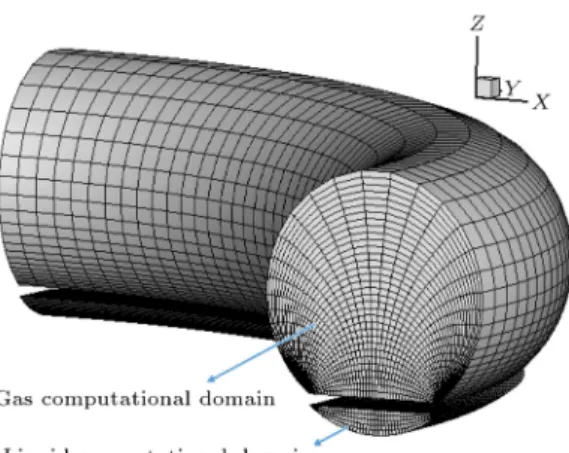
The utilization of an extended toroidal coordinate system boosts the development of an eective com-putational technique to study the stratied ow in curved passages. The computational domain of the gas/liquid ow is illustrated in Figure 3. For the ease of computation, the domain is separated for a given value of liquid holdup; then, the ow elds will be solved independently for each phase by specifying the appropriate boundary conditions at the interfacial surface.
The Navier-Stokes equations, which are expressed in the orthogonal coordinate system (; ; s), are used
Figure 3. Computational domain of the gas and liquid ows.
to describe the gas phase ow eld through the bend. A nite volume method on staggered grids is used to discretize the governing equations. Central dierence and QUICK scheme are used to discretize the diusion and convection terms, respectively. Moreover, the k " model is employed to reect the nature of turbulence in the ow eld.
In terms of boundary conditions, at the walls, the impenetrability and no-slip boundary condition are enforced. At the inlet, a Poiseuille velocity distribution has been considered, while a constant pressure outow at the outlet of the curved pipe is applied. The main purpose of this work is to predict the gas phase velocity eld; therefore, a simplied assumption at the gas/liquid interface has been made based on which the axial velocity of interface is constant during the simulation and equal to the mean axial velocity of the liquid phase, and the other components of the velocity are considered zero.
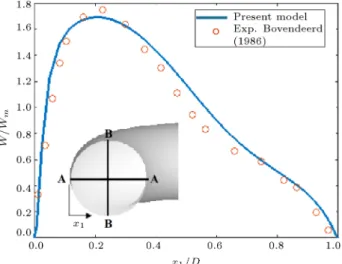
In order to validate the present CFD code, the simulation results have been compared with the exper-imental data by Bovendeerd et al. [34] to develop single-phase ow in a 90 bend pipe. Herein, pipe internal
radius is 4.0 mm, radius of curvature is 24.0 mm, and Reynolds number is 700. In Figures 4 and 5, the predicted dimensionless axial velocity prole on the symmetry plane in two sections of the curve at z = 1 and 1.7 (z = R=(aR)0:5, where R and are pipe radius
and axial direction along the curve, respectively, as shown in Figure 6) is compared with the experimental measurements by Bovendeerd et al. [34]. The vertical axis in these gures represents the dimensionless axial velocity, which is made non-dimensional with the mean axial velocity. On the other hand, the horizontal axis is dimensionless distance from the outer wall of the bend (x1 is the distance from the outer wall). It can
be seen that the predicted dimensionless axial velocity proles are in good agreement with the experimental measurements.
Figure 4. The dimensionless axial velocity prole on the AA plane; z = 1, = 1=6, Re = 700 [34].
Figure 5. The dimensionless axial velocity prole on the AA plane; z = 1:7, = 1=6, Re = 700 [34].
for the stratied gas-liquid ows, a condition in which the bend radius of curvature tends towards innity is considered, and the results are compared with those for the straight pipes. The predicted dimensionless axial velocity prole of the gas-liquid phase for fully developed stratied ow in a straight pipe is compared with the analytical solution provided by Brauner et al. [35] in Figure 7. The axial velocities have been made non-dimensional by:
VR= R 2
4G
dp
ds: (32)
For this case, to obtain the exact value of the interfacial velocity, its value has been initialized; then, the gas phase equations are solved, and axial gas velocity prole is evaluated. In the next step, the corre-sponding averaged shear stress at the interface is calcu-lated and, consequently, is applied to the liquid phase.
Figure 6. Computational domain of the bend.
Figure 7. Comparison of the predicted dimensionless axial velocity prole along the vertical centerline with the analytical solution of Brauner et al. [35]; hL= D=10, G=L= 0:01.
Eventually, the liquid phase is solved, and the interface velocity is calculated. The new interface velocity is then applied to the gas phase, and the solution process will be repeated until the gas-liquid interfacial velocity becomes unchanged and the solution converges. Fig-ure 7 demonstrates that the present model prediction is in excellent agreement with the analytical solution.
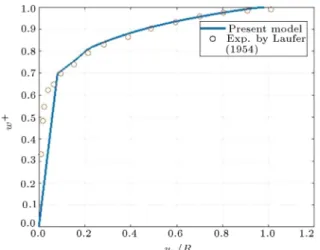
Lastly, to validate turbulence in the fully devel-oped pipe ow, the results are compared with experi-mental ones provided by Laufer [36]. In experiments, pipe internal radius is 127 mm, and the radius of curva-ture tends towards innity (straight pipe) carrying ow with Reynolds number of 50000. This comprehensive comparison consists of three items including axial ve-locity prole, turbulence kinetic energy, and dissipation rate displayed in Figures 8, 9, and 10, respectively. These parameters have been made dimensionless by:
Figure 8. Comparison of the predicted dimensionless axial velocity prole along the vertical centerline with the experimental results by Laufer [36].
Figure 9. Comparison of the predicted dimensionless turbulence kinetic energy prole along the vertical centerline with the experimental results by Laufer [36].
Figure 10. Comparison of the predicted dimensionless turbulence dissipation rate prole along the vertical centerline with the experimental results by Laufer [36].
w+= w
wmax; (33)
k+= k
w 2; (34)
"+= "
w 4: (35)
Although comparing the CFD simulation results with axial velocity and turbulence parameters mea-sured experimentally revealed a satisfactory agreement (discrepancy < 15%), there is a slight deviation near the wall mainly caused by the dierence between initial y+ and actual one leading to the right selection of
appropriate turbulence model.
5. Results and discussion
When the two-phase ow passes through the bend, the maximum axial velocity of the gas phase tends towards the outer wall, and the secondary ow forms and evolves along the pipe. Figure 11 shows axial velocity contours, and Figure 12 displays the corresponding secondary ows occurring in the gas phase through the curved pipe in four axial sections: s = 0:03 m, 0.1 m, 0.14 m, and 0.18 m. The gas Reynolds number is about 27000 in all cases.
Figure 11 depicts that the central maximum stream-wise velocity region disappears gradually and shifts to the region farther away from the inner wall (left) and closer to the gas-liquid interface, top and outer pipe wall (right). Near the inner wall, the axial velocity magnitude is very low, while it is quite high near the outer wall. Therefore, the radial velocity gradient is very high at the outer wall, although this gradient is much lower between the inner wall and maximum axial velocity region. The contour lines of the axial velocity are asymmetric with respect to horizontal centerline, and this asymmetric behavior becomes noticeable along the pipe from s = 0:03 m to s = 0:18 m. At s = 0:18 m, the contours seem to be highly skewed.
Figure 12 shows that, at s = 0:03 m, the secondary ows in the gas phase generate four vortex zones. Two vortices are in the vicinity of gas-liquid interface and pipe wall, while the other two larger vortices are created in the upper part of the pipe cross-section. By drawing an analogy among the secondary ows in all axial sections, as provided in Figure 12, it can be understood that the two lower vortices located in the corners of gas-liquid interface and that near the inner wall become stronger along the pipe, while the other one does not vary signicantly.
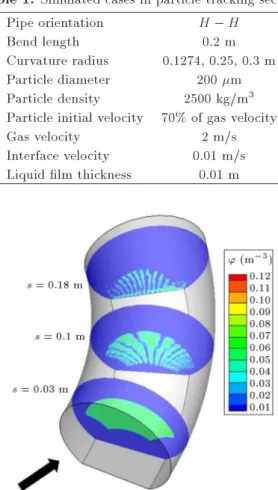
In this step, the behaviour of the entrained parti-cles through the pipe carrying considered ow will be examined. Table 1 contains the parameters describing the geometry, ow, and entrained particles.
Figure 11. Axial velocity contours in the gas phase at s = 0:03, 0.1, 0.14, and 0.18.
Table 1. Simulated cases in particle tracking section.
Pipe orientation H H
Bend length 0.2 m
Curvature radius 0.1274, 0.25, 0.3 m Particle diameter 200 m Particle density 2500 kg/m3 Particle initial velocity 70% of gas velocity
Gas velocity 2 m/s
Interface velocity 0.01 m/s Liquid lm thickness 0.01 m
Figure 13. Concentration of particles in the bend (curvature radius = 0.3 m).
The particle injection region from the inlet surface is ranged as in the following fashion:
(
0:8511 1:8998
0:8306 0:8306 (36) According to Figure 13, the particles are forced to move towards the outer wall during the passage through the bend inuenced by the centrifugal force. Moreover, they are continuously under the inuence of gravitational force. On the other hand, pressure gradient in the radial direction occurs in the ow eld; therefore, in each section of the bend, the trade-o between the aforesaid forces is dierent, which plays a key role in particles' motion. Near the internal walls, the dominant force is the gravity, and the particles tend to have lower concentration than those near the outer wall of the bend.
As shown in Figures 14 and 15, by decreasing the radius of curvature, the particles are more oriented towards the inner wall. The particles are mostly inclined to the vortex located on the right side of the pipe, near the interface, and are still more likely to collide with the interface.
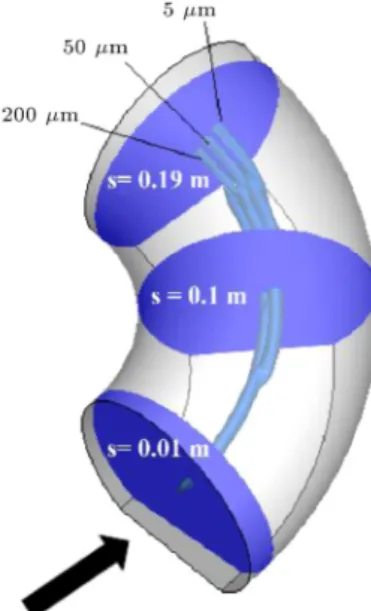
Furthermore, in order to investigate the eect of
Figure 14. Concentration of particles in the bend (curvature radius = 0.25 m).
Figure 15. Concentration of particles in the bend (curvature radius = 0.1274 m).
particle diameter on their path, three particle diame-ters of 5, 50, and 200 microns are injected from the center of inlet surface. The direction of movement of these particles is depicted in Figure 16. By decreasing the diameter of the particles, the pressure-gradient force, the added mass force, and the gravity force decrease with the third power of the diameter; however, the drag force decreases with the rst power of the particle diameter; consequently, centrifugal force acting on the particles overcomes other forces and pushes the particles towards the outer wall.
6. Conclusions
To simulate the gas-liquid stratied ow in a horizontal curved pipe, a new toroidal coordinate system was developed and utilized for convenient mapping of the
Figure 16. Comparison of motion of particles with dierent sizes.
physical domain and the gas-liquid interface. The 3-D steady-state momentum equations were discretized and solved using the nite volume scheme. By comparing the numerical data with the previous experimental results, the validity of the numerical model was ex-amined, showing that the new model could precisely handle developed stratied gas-liquid ows in curved pipe, particularly at low radius of curvature.
In general, higher axial velocities are observed in the gas phase. Based on the horizontal gas-liquid ow simulation, the maximum velocity was detected close to halfway between the interface and the upper wall. This could be attributed to the secondary ows similar to the results acquired by Meknassi et al. [37]. The current results conrm the presence of secondary ows in the gas phase, indicating that the ow is not fully developed.
The present results illustrate that the contour lines of the axial velocity in gas-liquid stratied ow are asymmetric with respect to horizontal centerline. In the axial section from s = 0:03 m to 0.18 m, the secondary ow formed four major vortex (recirculation) zones. Furthermore, the two secondary vortices near the corners of the gas-liquid interface are found to be stronger than the other vortices are and exist in all sections in the curved pipe.
Entrained particle tracking was performed by means of the Lagrangian approach considering the two-way coupling regime between the ow and particles. To solve the equation of particle's motion, the fourth-order Range-Kutta method was exploited. Finally, the results obtained by the particle tracking indicate that, in each section of the bend, the trade-o between centrifugal and pressure gradient forces plays a key role in particles' motion close to the inner surface; in
addition, the dominant force is the gravity, and the particles tend to have lower concentration than those close to the outer wall of the bend. In terms of the eect of particle size, decreasing the particle's diameter results in enhancing the centrifugal force, which pushes the particles towards the outer wall. Furthermore, the comparison of particles' motion through bends with various curvature demonstrates that by decreasing the radius of curvature, the particles are more oriented towards the inner wall. The particles are mostly inclined to the vortex located on the right side of the pipe, near the interface, and are still more likely to collide with the interface.
Nomenclature
a Curvature radius (m) D Pipe diameter (m)
c Focal length in bipolar coordinate system (m)
hL Liquid height (m)
h; h; hs Scale factors
R Pipe radius (m) p Pressure (Pa) s Axial direction (m)
u Velocity component in direction (ms 1)
v Velocity component in direction (ms 1)
w Axial velocity (ms 1)
wmean Axial velocity (ms 1)
X; Y; Z Cartesian coordinates (m) k Turbulence kinetic energy g Gravity
Greek letters
Half-angle subtended by liquid at the center of pipe
Curvature ratio ; Bipolar coordinates Stream-wise angle Viscosity (Pa.s) Density (kg.m 3)
' Angular displacement of gas-liquid interface about the pipe axis (radian) " Turbulence dissipation rate
Subscripts G Gas L Liquid
; ; s New toroidal coordinates p Particle
References
1. Cohen, M.I. \An investigation of pressure drop in a two-phase two-component ow in bends", M.Sc. Thesis, MIT (1957).
2. Castillo, J.R. \Study of two-phase ow in pipe bends", M.Sc. Thesis, MIT (1957).
3. Grander, G.C. and Neller, P.H. \Phase distributions in ow of an air-water mixture round bends and past obstructions at the wall of a 76-mm bore tube", Institution of Mechanical Engineers, 184, pp. 93-101 (1969).
4. Usui, K., Aoki, S., and Inoue, A. \Flow behavior and pressure drop of two-phase ow through C-shaped bend in vertical plane (I)", Journal of Nuclear Science and Technology, 17(12), pp. 875-887 (1980).
5. Usui, K., Aoki, S., and Inoue, A. \Flow behavior and phase distribution in two-phase ow around inverted U-bend", Journal of Nuclear Science and Technology, 20(11), pp. 915-928 (1983).
6. Das, S.K., Biswas, M.N., and Mitra, A.K. \Non-Newtonian liquid ow in bends", The Chemical En-gineering Journal, 45(3), pp. 165-171 (1991).
7. Bandyopadhyay, T.K., Banerjee, T.K., and Das, S.K. \Gas-non-newtonian liquid ow through elbows", Chemical Engineering Communications, 182(1), pp. 21-33 (2000).
8. Ribeiro, A.M., Bott, T.R., and Jepson, D.M. \The inuence of a bend on drop sizes in horizontal annular two-phase ow", International Journal of Multiphase Flow, 27(4), pp. 721-728 (2001).
9. Azzi, A., Friedel, L., Kibboua, R., and Shannak, B. \Reproductive accuracy of two-phase ow pressure loss correlations for vertical 90bends", Forschung im Ingenieurwesen, 67(3), pp. 109-116 (2002).
10. Wang, C.-C., Chen, I.Y., Yang, Y.W., and Chang, Y.-J. \Two-phase ow pattern in small diameter tubes with the presence of horizontal return bend", Interna-tional Journal of Heat and Mass Transfer, 46(16), pp. 2975-2981 (2003).
11. Wang, C.-C., Youn Chen, I., Yang, Y.W., and Hu, R. \Inuence of horizontal return bend on the two-phase ow pattern in small diameter tubes", Experimental Thermal and Fluid Science, 28(2-3), pp. 145-152 (2004).
12. Wang, C.-C., Chen, I.Y., and Huang, P.-S. \Two-phase slug ow across small diameter tubes with the presence of vertical return bend", International Journal of Heat and Mass Transfer, 48(11), pp. 2342-2346 (2005).
13. Wang, C.-C., Chen, I.Y., Lin, T., and Chang, Y.-J. \A visual observation of the air-water two-phase ow in small diameter tubes subject to the inuence of vertical return bends", Chemical Engineering Research and Design, 86(11), pp. 1223-1235 (2008).
14. Spedding, P.L., Benard, E., and McNally, G.M. \Two-and three-phase ow through a 90 degree bend", Developments in Chemical Engineering and Mineral Processing, 13(5-6), pp. 719-730 (2005).
15. Abdulkadir, M., Zhao, D., Sharaf, S., Abdulkareem, L., Lowndes, I.S., and Azzopardi, B.J. \Interrogating the eect of 90 bends on air-silicone oil ows us-ing advanced instrumentation", Chemical Engineerus-ing Science, 66(11), pp. 2453-2467 (2011).
16. Kesana, N. \Erosion in multiphase pseudo-slug ow with emphasis on sand sampling and pseudo-slug characteristics", The University of Tulsa, Oklahoma, USA (2013).
17. Vieira, R.E., Kesana, N.R., McLaury, B.S., Shirazi, S.A., Torres, C.F., Schleicher, E., and Hampel, U. \Ex-perimental investigation of the eect of 90 standard elbow on horizontal gas-liquid stratied and annular ow characteristics using dual wire-mesh sensors", Experimental Thermal and Fluid Science, 59, pp. 72-87 (2014).
18. Mokhtarifar, N., Saaraval, F., Saar-Avval, M., Mansoori, Z., and Siamie, A. \Experimental model-ing of gas-solid heat transfer in a pipe with various inclination angles", Heat Transfer Engineering, 36(1), pp. 113-22 (2015).
19. Nojabaei, B., Mansoori, Z., and Saar-Avval, M. \Heat transfer in turbulent liquid-solid ow consider-ing the interparticle collision eect", Petroleum Sci-ence and Technology, 13;30(12), pp. 1296-306 (2012).
20. Pishvar, M., Avval, M.S., Mansoori, Z., and Amirkhos-ravi, M. \Three dimensional heat transfer modeling of gas-solid ow in a pipe under various inclination angles", Powder Technology, 1(262), pp. 223-32 (2014).
21. Dabirian, R., Mansouri, A., Mohan, R., Shoham, O., and Kouba, G. \CFD simulation of turbulent ow structure in stratied gas/liquid ow and validation with experimental data", In SPE Annual Technical Conference and Exhibition (2015).
22. Haj, A., Mansoori, Z., Saar Avval, M., and Ahmadi, G. \Developing stratied gas-liquid ow 3-D numerical simulation in curved pipes", 9th International Confer-ence on Multiphase Flow, Firenze, Italy (2016).
23. Ayati, A.A., Kolaas, J., Jensen, A., and Johnson, G.W. \PIV in stratied gas-liquid ow in a horizontal pipe using water droplets as tracers in the gas-phase", arXiv preprint arXiv:1701.00387 (2017).
24. Vestl, S., Kumara, W.A., and Melaaen, M.C. \Parti-cle image velocimetry measurements of stratied gas-liquid ow in horizontal and inclined pipes", Multi-phase Flow: Theory and Applications, 417 (2018).
25. Stevenson, P. and Thorpe, R.B. \Velocity of isolated particles along a pipe in stratied gas-liquid ow", AIChE Journal, 48(5), pp. 963-9 (1 May 2002).
26. Dabirian, R., Mohan, R.S., Shoham, O., and Kouba, G. "Solid-particles ow regimes in air/water stratied ow in a horizontal pipeline", Oil and Gas Facilities, 15(06) (2016).
27. Zehtabiyan-Rezaie, N., Damirchi-Darasi, S.R., Zarandib, M.F., and Saar-Avval, M. \Generalized heat transfer and entropy generation of stratied air-water ow in entrance of a mini-channel", Scientia Iranica, Transactions B, Mechanical Engineering, 24(5), pp. 2406-17 (2017).
28. Banakermani, M.R., Naderan, H., and Saar-Avval, M. \An investigation of erosion prediction for 15 to 90elbows by numerical simulation of gas-solid ow", Powder Technology, 334, pp. 9-26 (2018).
29. Hughes, W.F., Gaylord, E.W., and Hughes, G.W. Basic Equations of Engineering Science, New York: McGraw-Hill (1964).
30. Versteeg, H.K. and Malalasekera, W. \An introduction to computational uid dynamics: The nite volume method", Longman Scientic and Technical (1995).
31. Wang, K., Li, X., Wang, Y., and He, R. \Numerical investigation of the erosion behavior in elbows of petroleum pipelines", Powder Technology, 314, pp. 490-9 (2017).
32. Naumann, Z. and Schiller, L. \A drag coecient correlation", Z. Ver Deutsch. Ing., 77, pp. 318-23 (1933).
33. Crowe, C.T., Schwarzkopf, J.D., Sommerfeld, M., and Tsuji, Y., Multiphase Flows with Droplets and Particles, CRC press (2011).
34. Bovendeerd, P.H.M., Steenhoven, A.A.V., Vosse, F.N.V.D., and Vossers, G. \Steady entry ow in a curved pipe", Journal of Fluid Mechanics, 177, pp. 233-246 (1987).
35. Brauner, N., Rovinsky, J., and Maron, D.M. \Analyt-ical solution for laminar-laminar two-phase stratied ow in circular conduits", Chemical Engineering Com-munications, 141-142(1), pp. 103-143 (1996).
36. Laufer, J. \The structure of turbulence in fully devel-oped pipe ow", NACA Rep. no. 1174 (1954).
37. Meknassi, F., Benkirane, R., Line, A., and Masbernat, L. \Numerical modeling of wavy stratied two-phase ow in pipes", Chemical Engineering Science, 55(20), pp. 4681-97 (2000).
Biographies
Mohammad Ali Rasoulian received his BSc degree in Mechanical Engineering from Ferdowsi University of Mashhad, Mashhad, Iran in 2011 and his MSc degree in Mechanical Engineering from Amirkabir University of Technology (Tehran Polytechnic), Tehran, Iran in 2014. Currently, He is a Research Assistant at Energy Research Center of Amirkabir University of Technol-ogy. His research interests include computational uid dynamics (CFD), particle transport, windbreaks and wind ows, solid particle erosion, and multiphase ows. Amin Rasteh received his BSc degree in Mechanical Engineering from Yasuj University, Iran in 2011 and his
MSc degree in Mechanical Engineering from Amirkabir University of Technology (Tehran Polytechnic), Iran in 2014. He is currently a Research Assistant at Energy Research Center in Amirkabir University of Technology. His research interests include computa-tional uid dynamics, convection heat transfer, solid particle erosion, multiphase ows, and turbomachines. Ali Farokhipour received his BS degree in Aerospace Engineering from K. N. Toosi University of Technol-ogy, Iran in 2011 and his MS degree in Mechanical Engineering from Amirkabir University of Technology (Tehran Polytechnic), Iran in 2013, where he is cur-rently a PhD degree student. His research interests include computational uid dynamics, gas turbine, non-premixed combustion, solid particle erosion, and multiphase ows.
Zohreh Mansoori completed her PhD in Mechanical Engineering from Amirkabir University of Technology (Polytechnic), Tehran, Iran. She is an Associate Professor and the Head of Energy Research Center in Amirkabir University of Technology. She has published more than 40 papers in reputable journals and has been serving as an Editorial Board Member of repute. Majid Saar-Avval is a Professor of Mechanical Engineering at Amirkabir University of Technology (AUT), Tehran, Iran. He received his BSc and MSc degrees from Sharif University of Technology and his PhD degree from the Ecole Nationale des Arts et Metiers (ENSAM), Paris, France in 1985. He has been teaching at AUT since then. He was the Head of the Mechanical Engineering Department from June 2000 to June 2002 and the Head of the Energy and Control Center of Excellence from May 2007 to March 2012 at AUT. His research contributions are in the elds of two-phase heat transfer, advanced thermal systems, energy management, and bio-heat transfer.
Ali Haj received his MSc degree in Mechanical En-gineering from Amirkabir University of Technology (Tehran Polytechnic), Iran in 2016. His research interests include heat transfer enhancement, two-phase ow modelling, and Computational Fluid Dynamics (CFD).
Goodarz Ahmadi received his PhD degree in Me-chanical Engineering from the Purdue University, West Lafayette, IN, USA, and is now a Professor of Me-chanical Engineering at Clarkson University, USA. His research work concerns particle transport, deposition and removal, aerosol mechanics, stochastic processes in engineering, advanced theory of turbulence, and multiphase ow modelling.