PERSONAL EXPOSURE TO POLYCYCLIC AROMATIC
HYDROCARBONS DURING COOKING IN RWANDAN HOUSEHOLDS
By
Zoe Frolking
A technical report submitted to the faculty of the University of North Carolina at Chapel Hill in partial fulfillment of the requirements of the degree of Master of Science in Public
Health in the Department of Environmental Sciences and Engineering.
Abstract
Nearly three billion people, mostly in developing countries, rely on solid-fuel-burning
cookstoves to prepare food and heat their homes. The World Health Organization has
estimated that exposure to toxins and smoke emitted from cookstoves leads to 4.3 million
premature deaths annually. One of the primary sources of polycyclic aromatic
hydrocarbon (PAH) exposure is indoor cookstove use. We carried out a comprehensive
baseline exposure assessment survey in 180 households during in peri-urban Rwandan
households July-August 2015. In each household, the primary cook’s exposure to PAHs
was measured over a 24-h period. We also recorded kitchen ventilation and size as well
as fuel type, quantity, and moisture content. The aim of this study was to investigate the
type and concentrations of airborne PAHs in the breathing zone of the main cook and in
the cooking areas in a subsample of 16 households. The concentrations of PAHs
significantly exceeded the recommended exposure levels in both personal breathing
zones and cooking areas. PAHs analyzed were observed to be primarily in the gas phase.
Cooking location (indoors or outdoors) and lighting-fuel type (plastic or small sticks) had
no significant effect on PAH levels measured in the personal breathing zones or cooking
areas. Understanding the PAH exposure from traditional cooking methods will allow for
an accurate assessment of changes in PAH exposure after introduction of a more efficient
cookstove in future phases of this longitudinal study, and has the potential to improve the
Acknowledgments
First and foremost, I would like to thank my advisor, Leena Nylander-French, for
countless hours of support and strategizing throughout this project. Her positivity and
perseverance over the course of this research was an inspiration.
Special thanks also go out to my committee; Pam Jagger for crucial project reviews and
counsel, Joe Pedit for endless hours of lab support and advice, and Joachim Pleil for
technical report revisions and support during a busy time. This project would not have
been possible without the tireless work of the Rwandan project team, including Ipsita
Das, Sara Abdoulayi, Karin Yeatts, Sudhanshu Handa, and the entire field team.
This research was supported by grants from the National Institute for Occupational Safety
Table of Contents
LIST OF TABLES
4
LIST OF FIGURES
5
LIST OF ABBREVIATIONS
6
BACKGROUND
7
HEALTH EFFECTS OF PAH EXPOSURE
13
PROJECT AIMS AND OVERVIEW
18
STUDY DESIGN AND METHODS
20
RESULTS AND DISCUSSION
27
CONCLUSIONS
37
REFERENCES
40
APPENDIX
45
List of Tables
1. Recommended maximum permissible concentrations of PAHs (adapted from
Ravindra et al, 2008) Page 7
List of Figures
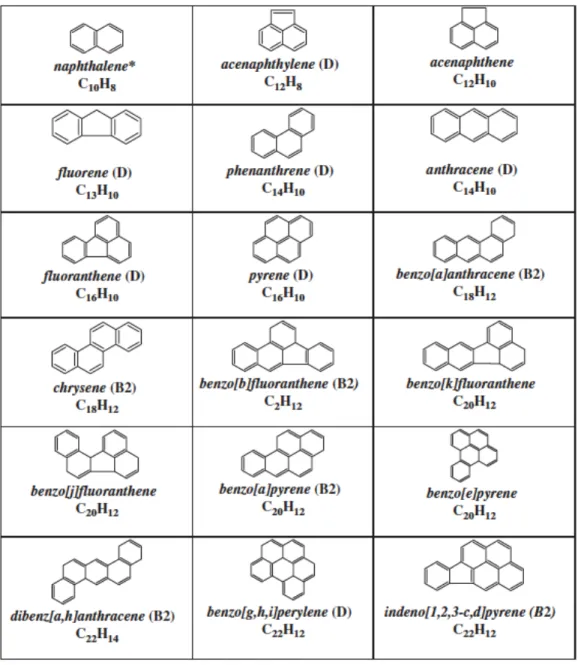
1. Chemical structures of the US EPA 16 Priority PAHs (compounds labeled B2 are classified as probably carcinogens by the EPA) - Page 11
2. Radical Formation of PAHs through pyrosynthesis (from Ravindra et al, 2008) – Page 12 3. Metabolism and activation of benzo[a]pyrene, a common PAH- Page 14
4. Mimi Moto cookstove – Page 19
5. The set-up for the test burn equipment – Page 21 6. Map of the study site (Gisenyi, Rwanda) – Page 22
7. Representative chromatogram of standards of the 16 US EPA priority PAHs – Page 25 8. A representative chromatogram of particulate-phase PAHs analyzed on a GFF pre-filter –
Page 26
9. A representative chromatogram of gas-phase PAHs analyzed on a PUF/XAD2 – Page 26 10.Total PAH concentrations measured in gas (PUF/XAD2) and particulate (GFF pre-filter)
phase when wood or pellets were used as fuel – Page 27
11.Cooking conditions and techniques used in the 180 Rwandan households – Page 28
12.Gas- and particulate-phase PAH concentrations measured in the 56 personal breathing-zone and 56 cooking-area samples (BZ = breathing zone, CA = cooking area, PP = particulate phase, GP = gas phase, T = PP + GP). – Page 29
13.Gas- and particulate-phase PAH concentrations measured in the personal breathing zone and cooking area when plastic or sticks/wood fuel were used to light the fuel (PP = particulate phase, GP = gas phase). – Page 30
14.The relationship between the measured personal breathing-zone and cooking-area gas-phase PAH concentrations. – Page 31
15.The relationship between the measured personal breathing-zone and cooking-area particulate-phase PAH concentrations. – Page 31
16.The relationship between the personal breathing-zone and cooking-area gas-phase PAH concentrations when plastic or sticks/wood fuel were used to light the fuel. – Page 32 17.The relationship between the personal breathing-zone and cooking-area particulate-phase
PAH concentrations when plastic or sticks/wood fuel were used to light the fuel. – Page 33 18.The relationship between the personal breathing-zone and cooking-area gas-phase PAH
concentrations when cooking is performed indoors or outdoors. – Page 33
19.The relationship between the personal breathing-zone and cooking-area particulate-phase PAH concentrations when cooking is performed indoors or outdoors. – Page 34
20.Median concentration of each of the particulate-phase PAHs extracted from GFF-pre-filter samples. Each line represents an individual PAH (shown as the ion mass) concentration measured in a single sample. – Page 35
21.Median concentration of each of the gas-phase PAHs extracted from GFF pre-filter samples. Each line represents an individual PAH (shown as the ion mass) concentration measured in a single sample. – Page 35
22.Median concentration of each of the gas-phase PAHs extracted from GFF pre-filters and
List of Abbreviations
CO
carbon monoxide
GC-MS gas chromatography-mass spectroscopy
GFF
glass-fiber filter
GP
gas phase
HAP household air pollution
PAH
polycyclic aromatic hydrocarbon
PP
particulate phase
PM
2.5particulate matter
≤
2.5
µ
m in diameter
PTFE
poytetrafluorethylene
PUF
polyurethane foam
TLUD
top-lit up-draft
Background
Nearly 3 billion people, mostly in developing countries, rely on solid-fuel-burning
cookstoves to prepare food and heat their homes (Lim et al, 2012). The use of solid fuels
such as wood, charcoal, dung, or agricultural residues for cooking and heating is linked to
high levels of household air pollution. The combustion of these fuels generates pollutants
such as carbon monoxide (CO), fine particulate matter (PM2.5), and polycyclic aromatic
hydrocarbons (PAHs). These pollutants have been linked to respiratory infections,
cardiovascular diseases, tuberculosis, cataracts, and lung cancer, among other diseases
(Lim et al, 2012). The World Health Organization has estimated that exposure to toxins
and smoke emitted from cookstoves leads to over 4 million premature deaths each year
(WHO, 2009). Concerns regarding PAH emissions are not limited to developing
countries. Residential wood combustion was determined to account for over 30 percent of
anthropogenic PAH emission in eastern North America in 1999, and studies have not
shown significant changes in this number in subsequent years (Oanh et al, 1999). An
estimated 4.5 percent of the global burden of disease can be attributed the household air
pollution created by the burning of solid fuels (Clark et al, 2013). While emissions of CO
and PM2.5 from cookstoves have been examined in many studies, there is less data
available regarding the formation of PAHs, despite the fact that 63 percent of global PAH
emissions are attributed to residential fuel combustion (Shen et al, 2015).
Globally, few efforts have been made to curb the emissions of PAHs, from residential or
monitoring programs have been put into place. Most of these guidelines are exceeded on
a regular basis, and few updates have been made to the standards to reflect current
technologies or the needs of the global population (Ravindra, 2008).
Table 1. Recommended maximum permissible concentrations of PAHs (adapted from Ravindra et al, 2008 and Skupinska et al, 2004).
Regulatory Body / Country Media Maximum Permissible
Concentration
Germany Ambient Air 10 ng/m3
Germany Oven Area 2 µg/m3
India Ambient Air 5 ng/m3
EU Ambient Air 1 ng/m3
USA Workplace Air 0.1 mg/m3
WHO Ambient Air 1 ng/m3
Polycyclic Aromatic Hydrocarbons
PAHs are composed of two or more fused rings of carbon and hydrogen, where at least
two of the rings present are benzenes (Ravindra, 2008). PAHs with seven or fewer rings
are considered to be the most environmentally prevalent, and thus are the subject of the
majority of PAH-related research (Bobak, 2010, Harvey, 1997; Boehm et al., 2002). Due
to their hydrophobic composition, most PAHs have low solubility in water. Low
volatile. These features explain the increased incidence of higher molecular weight PAHs
in the atmosphere; their lower vapor pressure and resistance to leaching make these
compounds much more recalcitrant in nature (Wick et al, 2011).
The United States Environmental Protection Agency (US EPA) has identified 16 priority
PAHs (Table 2, Figure 1). We focus our attention on these PAHs for four main reasons:
(1) availability of information on each compound, (2) relative toxicity, carcinogenicity, or
mutagenicity, (3) representativeness of the compounds present, and (4) high
concentrations and ubiquity throughout the environment (US EPA, 2000; Ravindra,
2008). In addition, these 16 compounds are among the most often investigated for
exposure and associated health effects.
PAHs are generated by the combustion of biomass and fossil fuels, but also during
volcanic events, combustion of tobacco products and other industrial intermediates
(Zhang et al, 2009). The formation of PAHs occurs when a fuel containing carbon and
hydrogen (such as coal, crude oil gas, wood, or other biomass) undergoes an incomplete
combustion process. Incomplete combustion generally occurs in a low temperature, low
oxygen setting. Several formation mechanisms have been proposed; the most widely
accepted among them is a radical formation mechanism through pyrosynthesis (Ravindra
et al, 2008). Free radicals found in the flames initiate the chemical synthesis of
hydrocarbons, and form the precursors of PAHs (Figure 2). This reaction requires high
temperatures (generally exceeding 500°C) to break the carbon and
similar product, which can then condense to form an aromatic ring. Aromatic rings are
highly stable and, thus, resistant to thermal degradation. They are able to remain in the
environment long enough to react with other alkyl-PAH intermediates, forming PAHs
(Ravindra et al, 2008; Richter et al, 2000).
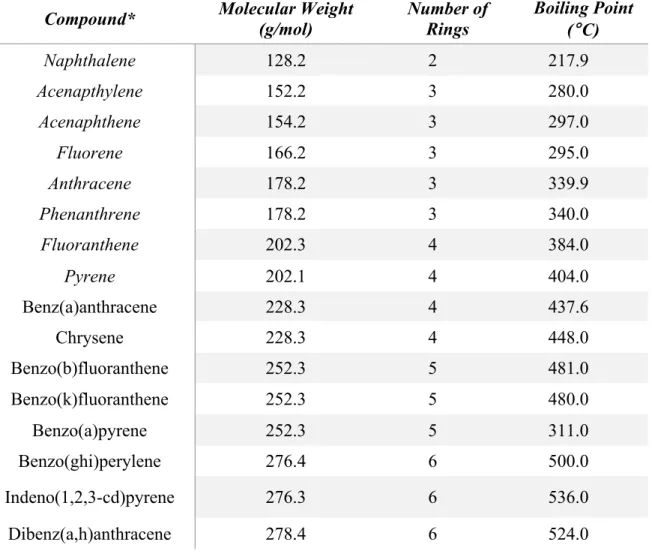
Table 2. Properties of the 16 PAHs identified by the US EPA as priority pollutants.
Compound* Molecular Weight (g/mol) Number of Rings Boiling Point (
°C)
Naphthalene 128.2 2 217.9
Acenapthylene 152.2 3 280.0
Acenaphthene 154.2 3 297.0
Fluorene 166.2 3 295.0
Anthracene 178.2 3 339.9
Phenanthrene 178.2 3 340.0
Fluoranthene 202.3 4 384.0
Pyrene 202.1 4 404.0
Benz(a)anthracene 228.3 4 437.6
Chrysene 228.3 4 448.0
Benzo(b)fluoranthene 252.3 5 481.0
Benzo(k)fluoranthene 252.3 5 480.0
Benzo(a)pyrene 252.3 5 311.0
Benzo(ghi)perylene 276.4 6 500.0
Indeno(1,2,3-cd)pyrene 276.3 6 536.0
Dibenz(a,h)anthracene 278.4 6 524.0
Figure 2. Radical Formation of PAHs through pyrosynthesis (from Ravindra et al, 2008).
Different fuels produce a different range of PAHs based on their composition, and thus
PAH composition in the atmosphere can indicate the source of the pollutants. If
concentrations of individual PAHs are known, ratios of these concentrations can be used
to postulate their source. For example, high concentrations of chrysene and
benzo[k]fluoranthene have been proposed to indicate a coal combustion origin (Khalili et
al., 1995; Smith and Harrison, 1998; Ravindra et al., 2007 and 2008), and the dominance
of volatile, lower molecular weight PAHs such as fluorene, fluoranthene, and pyrene are
suggested to be associated with oil combustion (Harrison et al., 1996; Ravindra et al.,
2006a).
Health Effects of PAH Exposure
Numerous studies have demonstrated the association between the prolonged or
significant exposure to PAHs and development of adverse health effects (Perera et al,
2012; Rohr et al, 2012; Dasgupta and Lahiri 1992; Hahon and Booth, 1986; Szczeklik et
al. 1994; Zhao 1990). As women and children are generally responsible for cooking and
household activities in many developing countries, their exposure to these toxins is
disproportionately high (WHO, 2009). Personal exposure to PAHs can occur through
several routes: inhalation of PAH-containing aerosols or particulates, absorption in the
gastrointestinal tract after the ingestion of contaminated food or water, and uptake
through the skin after contact with PAH-containing materials (Chao et al, 2005 and 2006;
Kim et al, 2007; reviewed in Casarett and Doull’s Toxicology, 2013).
Once PAHs enter the body, they are circulated in the blood and lymph, and are primarily
metabolized in the liver and kidney. Metabolism and activation of PAHs is a multi-step
process (Figure 3). Initially, cytochrome-1A1 activates the PAH, forming an epoxide, a
highly reactive cyclic ether. Epoxide hydrolase then converts the epoxide into
dihydrodiol derivatives (diol-epoxides) and phenols. Finally, these intermediates are
converted to glutathione, sulfate, or glucuronide conjugates, which can then be excreted
Figure 3. Metabolism and activation of benzo[a]pyrene, a common PAH.
Much of the toxicity of PAHs is due to their reactive intermediates and metabolites.
These compounds are only carcinogenic after they have been activated metabolically
(Mumtaz et al, 1996). Diol-epoxides are highly reactive compounds that can bind to
DNA and form adducts. These adducts have been shown to be mutagenic to DNA regions
critical for the regulation cell differentiation and growth (Mumtaz et al, 1996).
Unsurprisingly, PAH exposure has been linked to numerous cancers, including breast
cancer, lung cancer, skin cancer, and stomach cancer (reviewed in Casarett and Doull’s
Toxicology, 2013). These links are primarily based on research of the higher molecular
weight PAHs (e.g., benzo[a]pyrene, benzo[e]pyrene), which have been found to be
genotoxic, while less is known about the low molecular weight PAHs (reviewed in
Mumtaz et al, 1996).
PAH exposure has also been linked to respiratory infections (Likhachev et al, 1993).
Long-term exposure to PAHs has been connected to higher risk of asthma, chronic
obstructive pulmonary disease, chronic bronchitis, and emphysema (reviewed in Casarett
observed to increase the occurrence and duration of adverse effects on respiratory
systems during the first year of life (Mackenzie et al, 1991).
Cookstoves and PAH emissions
Researchers looking at PAH emissions from solid-fuel burning cookstoves have
examined several questions, including but not limited to the partitioning of gas and
particulate phase PAHs in emissions, the effect of fuel type and moisture on the PAH
emission spectrum, the overall concentration of PAH emissions from varying cookstove
designs, and the effect of various lighting techniques and fuels on PAH emissions (Baek
et al, 1991; Subramanyam et al., 1994; Van Jaarsveld, 1997; Lee and Jones, 1999; Shen
et al, 2011 and 2014).
Gas and particulate phase partitioning of PAH emissions has also been investigated due
to its significance on many factors affecting the transport and uptake of PAHs. In general,
the higher molecular weight PAHs tend to bind to the surface of particulate matter, while
the lower molecular weight PAHs are mainly found in gaseous phase. Other factors
reported to affect PAH partitioning are the vapor pressure of the PAH, the PAH
concentration, the ambient temperature and humidity, and the types of fine particles
present in the environment (Baek et al, 1991; Subramanyam et al., 1994; Van Jaarsveld,
1997; Lee and Jones, 1999). PAHs in the particulate phase (especially higher molecular
weight PAHs requiring relatively high temperatures for condensation) are generally
classified as low-mobility PAHs, and deposit relatively close to their sources (Wania and
gaseous counterparts, and are also easily inhalable, and thus pose a greater health risk
(Van Vaeck and Van Cauwenberghe, 1978; Nicolaou et al., 1984).
An understanding of the partitioning of PAHs is crucial for the modeling of PAH
transport, exposure, deposition, chemical transformation, and health effects. There is little
agreement between studies as to the partitioning ratio, demonstrating the potential of
environmental factors affecting the transformation and occurrence of these compounds in
different media. Shen and colleagues (2014) observed that 86.7 percent of PAHs were
associated with PM2.5 when wood was used as the primary fuel. This result is consistent
with an earlier study performed by the same group, wherein 80 percent of PAHs were
associated with PM2.5 (Shen et al, 2011). However, more recently the gas phase was
observed to contain 95 percent of PAHs, including 96 percent of toxic PAHs and 60
percent of mutagenic PAHs (Oanh et al, 2002).
While the temperature, humidity, and ambient particulate matter are exogenously
determined, stove and fuel type are variables that can be controlled. As was previously
discussed, PAHs are produced during incomplete combustion. For this reason, the design
of a cookstove, and the type of fuel used may have an effect on the level of PAHs emitted
during biomass burning. Controlled laboratory comparisons of multiple stove types have
shown that natural-draft cookstoves with a top-lit up-draft (TLUD) design have the best
combustion and thermal efficiencies (Jetter et al, 2012). Cookstoves with internal fans,
such as the forced-draft gasifying Philips stove, also showed high combustion and
observed to have the lowest level of PM2.5, CO, and ultrafine particle emissions, likely
due to their low rates of fuel usage per unit energy produced(Jetter, 2012). These
findings were confirmed by Shen and colleagues (2015), who found that gasifying stoves
had significantly lower emissions than traditional stoves. In addition, Wand and
colleagues (2016) observed that high-efficiency stoves significantly reduced emissions,
albeit only when high-maturity coal was used.
The fuel used for cooking is often reliant on local availability, but many studies have
shown a significant difference in emissions with differing fuel types. The general
consensus is that biomass fuels are associated with the highest emissions of PAHs
(Raiyani et al, 1993; Shen et al, 2013; Oanh et al, 1999). Highest PAH emissions have
been observed to originate from sawdust briquettes, while the highest concentrations of
genotoxic and mutagenic PAHs were observed when burning kerosene and wood fuel (40
mg/day), respectively (Oanh et al, 1999). Eucalyptus wood burning emitted higher
concentrations of PAHs than charcoal at the rate of 208 mg/h (957 µg/m3 average in
monitored households) (Oanh et al, 1999). While no fuel type has been associated with an
elimination of exposure and adverse health effects, pellet stoves have shown promising
trends of lowering emissions one field study (Shen et al, 2015). Fuel storage conditions
can also play a role in PAH emission rates. Shen et al (2014) found that the mass fraction
of fine PM associated with PAH emissions was positively correlated with increasing fuel
moisture, a result that was confirmed in a follow-up study (Shen et al, 2011 and 2013).
Project Aims
As recently as 2013, a report was published calling for increased field and laboratory
research on PAH emissions from household combustion (Clark et al, 2013). In this report,
the need to understand ‘How clean is clean enough?’ was discussed. Although the many
efforts to design and disseminate ‘clean’ cookstoves, without quantitative exposure
assessment and field studies to confirm the success of these stoves the progress will
inevitably be limited. Thus, research priorities have been declared, with exposure
assessment classified as a critical need area. This is the impetus for our research; to
design and perform a study that will accurately characterize and quantify priority PAHs
emitted from cookstoves in peri-urban Rwanda, both before and after a newer,
’improved’ cookstove is introduced. Our overall hypothesis is that PAH concentrations in
the breathing zones of the cooks and in the cooking areas will decrease significantly after
household adoption of the Mimi Moto cookstove (Figure 4), a cookstove designed to
increase the efficiency of both combustion and fuel use. The Mimi Moto is classified as a
International Workshop Agreement Tier 4 cookstove, the highest ranking a stove can
The research described in this report encompasses preliminary analysis of a sub-sample
of personal exposure data collected during the baseline survey for our five-year,
longitudinal study. We monitored cooks’ personal breathing-zone and ambient levels in
the cooking areas for 16 priority PAHs in 180 households in Gisenyi, Rwanda. In each
household, 24-hour samples of both gas- and particulate-phase PAHs were collected
along with quantitative information regarding the type, quantity, and moisture of fuel
used, the ventilation of the cooking area, stove lighting, and other exposures the primary
cook encountered during the monitoring period. We address two research aims:
Aim 1: Investigate the type and concentrations of airborne PAHs in the breathing zone of
the main cook and in the cooking areas in a subsample of 16 households.
Aim 2: Determine the impact of environmental factors and cooking techniques (e.g.,
lighting fuel, indoor or outdoor cooking location) on PAH concentrations in the breathing
zone of the main cook and in the cooking areas.
Study Design and Methods
Preliminary Emissions Analyses
Prior to the field-work phase in Rwanda, the exposure monitoring equipment was tested
using a field test set-up using a gasifying Phillips stove. Nine test burns were performed
in North Carolina over the course of several months. Biomass pellets supplied by
InyenyeriRwanda were used for the test burns. Dry pellets (600 g) were used and an
additional 100 g of pellets soaked in ethanol for 5 minutes was added immediately prior
to lighting to expedite ignition. During each burn, the fan on the stove was set to the
“low” setting.
During each test burn, air samples were collected using a sampler containing a glass-fiber
filter (GFF; 2 µm pore-size, 35-mm diameter; Whatman, Maidstone, UK) and a
PUF/XAD2 sampler (SKC Inc, Eighty Four, PA) connected to an air-sampling pump
(AirCheck XR5000, SKC Inc.) operating at 2 L/min for one hour. The PUF/XAD2
sampler contained three layers; a polyurethane foam (PUF) and Amberlite XAD-2 resin
followed by PUF. The samplers were located directly above the chimney. Because the
test burns were conducted outside, a cloth was used to cover the PUF/XAD2 sampler to
protect it from sun damage. The air was pumped through a condenser placed immediately
after the fire so as to avoid any moisture reaching the GFFs or sorbents. Equipment was
arranged as shown in Figure 5. After field testing this system, it was determined that a
GFF (19-mm diameter, 1-µm pore size; SKC Inc.) filter would be suitable due to its low
a pre-filter inside the PUF/XAD2 sampler tube to simplify the exposure monitoring
equipment.
Figure 5. The set-up for the test-burn equipment: 1. Phillips cookstove; 2. Metal chimney;
3. Ice bucket; 4. Condenser; 5. Glass-fiber Filter (35-mm diameter, 2-µm pore-size); 6.
PUF/XAD2 sampler; 7. Air-sampling pump. All pieces of the equipment were connected
using Teflon™ plastic tubing. A y-splitter was used after the condenser (#4) to ensure
duplicate samples were captured during the burn.
Study Population
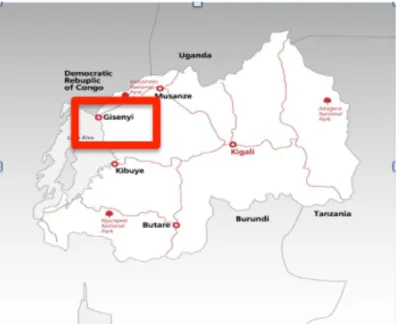
The field research was performed in the northwestern city of Gisenyi, Rwanda (Figure 6),
with a population of 106,000 (Rwanda Population Data, 2012). Gisenyi is considered a
peri-urban region with a temperate climate, including both a rainy and dry season.
Comprehensive exposure assessments were carried out in 180 households during
throughout the city to consent and interview the primary cooks in randomly selected
households, and to perform exposure assessment.
Figure 6. Map of the study site (Gisenyi, Rwanda).
Exposure Monitoring
In each household, the primary cook was asked to wear a small backpack (Camelbak,
Camelbak, Petaluma, CA) containing a PUF/XAD2 sampler fitted by a GFF pre-filter
(19-mm diameter, 1-µm pore size; SKC Inc.) fitted into the sampler above the
PUF-XAD2 layers to measure PAHs and a PEM2.5 monitor (MSP Inc., Minneapolis, MN) with
a 37-mm poytetrafluorethylene filter (PTFE, 2-µm pore size) to measure PM2.5. Both
samplers were connected to an air-sampling pump (AirCheck XR5000, SKC Inc.)
operating at 2 L/min. The backpack also held a Lascar carbon monoxide (CO) monitor
(EL-USB-CO, Erie, PA). All samplers were placed on the front straps of the backpack,
placed near the cook. The air-sampling pumps ran continuously for the entirety of the
sampling period.
Area sampling equipment was arranged on a lightweight tripod one meter away from the
primary cookstove. The tripod held a GFF-PUF/XAD2 sampler, PEM2.5 sampler, and a
CO monitor at a height of approximately 1.5 meters. The cooks were instructed to move
the tripod if their stove was moved, keeping the tripod one meter from the stove at all
times. Based on the assumption that the area samplers would collect greater particle
masses over the course of a day, to avoid overloading of the GFF pre-filters in the
PUF/XAD2 samplers, the area monitoring pumps were run on an intermittent schedule,
one minute on, five minutes off. After 24 hours, the sampling equipment was collected by
the field team, and the samples were packaged and stored at the field office (~20° C) for
shipment and later analysis at the University of North Carolina at Chapel Hill (UNC).
A brief questionnaire was designed to collect information on the cooking area and
cooking practices. The data collection sheet can be found in Appendix 1. The questions
included the quantity and type of fuel used for cooking, fuel moisture content, ventilation
of the cooking area, the type of stove used for cooking, stove lighting practices, and the
level of outside exposures such as trash burning, nearby traffic, or smoke from a
neighbor’s fire. The data collection sheet was designed to capture data on cooking
techniques and habits, as well as to provide information on other exposures that may
affect the data analysis and interpretation of the results. The data collection sheet was
accommodate local practices. The data collection sheet was performed in Kinyarwanda,
and answers were recorded and entered into the database in English.
Once samples from the baseline phase arrived at the UNC, they were immediately stored
at –20°C. For analysis, frozen samples were allowed to thaw at 4°C, standing upright to
avoid contamination from condensation. They were then moved to room temperature and
left for ten minutes prior to extraction. Both PUF sorbents and the XAD2 resin from each
tube were placed into a 40 mL glass jar containing 15 mL toluene and then sonicated for
40 minutes. Solvent (5 mL) was then collected using a PTFE syringe and filtered through
a 0.45 µm PTFE filter (VWR International, add town and state). The first 1 mL of sample
was discarded in a standard procedure to reduce any losses associated with the filter, and
the second 1 mL of sample was filtered directly into the gas-chromatography vial. A
mixture of two internal standards (chrysene d12 and naphthalene d8; add manufacture,
state, town) was added at a concentration of 0.5 µg/mL. The remaining 3 mL of sample
solution was stored –20°C for future use. The GFF pre-filters from the GFF-PUF/XAD2
samplers were extracted using the same procedure as described above using a 20-mL jar
with 5 mL of toluene. Samples were then analyzed using a gas chromatography-mass
spectrometry (GC-MS). The concentration of each of the 16 PAHs analyzed in both the
PUF/XAD2 and the GFF pre-filter samples was calculated using a 12-point standard
curve (0.03125 – 2 µg/mL) produced by spiking both the EPA 16-PAH standard mixture
(add manufacture, state, town) and the mixture of two deuterated internal standards,
chrysene d10 and phenanthrene d12. The sampled air volume was calculated using the
PAH Analysis Using Gas Chromatography-Mass Spectrometry
A GC-MS analysis method was developed to analyze 16 US EPA priority PAHs from a
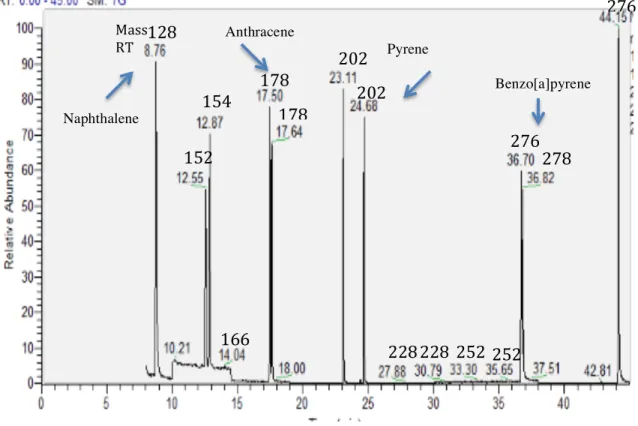
GFF-PUF/XAD2 sampler. A chromatogram of the stock standards of the 16 US EPA
priority PAHs (Sigma Aldrich) is presented in Figure 7. Representative chromatograms
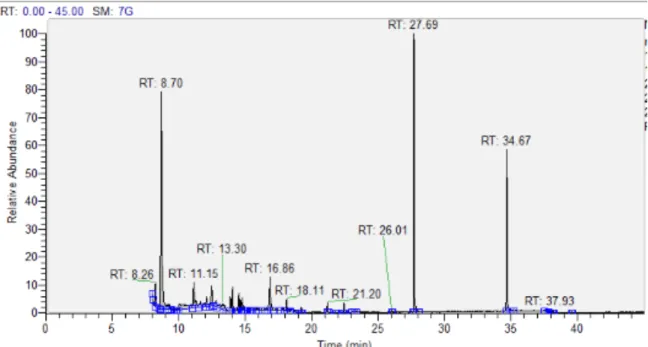
for particulate phase (i.e., GFF pre-filter) and gas phase (i.e., PUF/XAD2) PAHs are
shown in Figures 8 and 9, respectively.
Figure 7. Representative chromatogram of standards of the 16 US EPA priority PAHs. Compounds are labeled by mass.
128
152 154 Mass
RT
166
178 178
202
202
228 228 252 252
276
278
276 Anthracene
Pyrene
Figure 8. A representative chromatogram of particulate-phase PAHs analyzed on a GFF pre-filter.
Figure 9. A representative chromatogram of gas-phase PAHs analyzed on a PUF/XAD2.
Statistical Analysis
Statistical analyses were performed using both R (version 2.14.0) and Excel. Data was
Results and Discussion
Preliminary Emissions Analyses
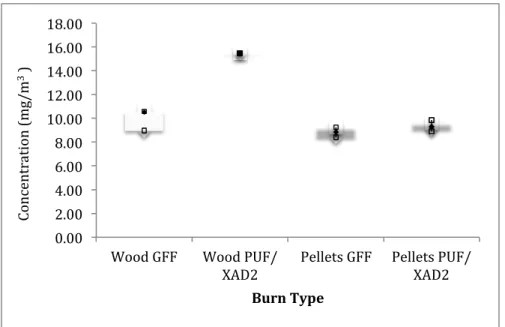
The preliminary emissions analyses showed high concentrations of PAHs after 1-hour
long test burns (Figure 10). This indicated that air pumps for the field samplers closest to
the cookstove should be run intermittently to avoid overloading of the filter and to
prevent subsequent pump failure. These results also alleviated concerns that the sampling
system would not collect sufficient concentrations for GC-MS analysis. Both fuel types
(pellets and wood) had similar concentrations in both the gas and particulate phases.
Figure 10. Total PAH concentrations measured in gas (PUF/XAD2) and particulate (GFF pre-filter) phase when wood or pellets were used as fuel.
Rwandan Field Sampling
Survey data from all 180 households was compiled and analyzed. During the seven days
prior to sample collection, 74 percent of the households surveyed cooked mainly indoors 0.00
2.00 4.00 6.00 8.00 10.00 12.00 14.00 16.00 18.00
Wood GFF Wood PUF/
XAD2 Pellets GFF Pellets PUF/XAD2
Co
nc
en
tr
at
io
n
(mg
/m
3 )
(Figure 11 A). The majority used charcoal stoves as their primary method of cooking; 70
percent used portable charcoal stoves, 18 percent used fixed charcoal stoves, and the
remaining 12 percent used a clay stove, three-stone fire, or other stove (Figure 11 B).
Charcoal was the primary cooking fuel source in 94 percent of the households (Figure 11
C). The majority of households used either small sticks and wood or plastic as lighting
fuel (Figure 11D).
Figure 11. Cooking conditions and techniques used in the 180 Rwandan households.
For the preliminary PAH exposure analysis from the field study, a subsample of twelve
households were chosen based on the fuel-lighting techniques and cooking location. In
these 12 households, 50 percent had cooked primarily inside in the seven days prior to
sample collection. In addition, all 12 households used charcoal stoves as their primary
method of cooking. From these households, a total of 48 personal and area PUF/XAD2
and GFF pre-filter samples were included in the analyses. From an additional four
A
B
both the gas and particulate phase (Figures 14 and 15). A total of 56 samples from 16
households were analyzed.
In the subset of 56 samples collected from both cook’s personal breathing zone and the
cooking area, the total PAH concentrations measured (1.98 ± 1.61mg/m3 and 3.65 ± 2.27
mg/m3, respectively) exceeded all published guideline values for PAH exposure (see
Table 1) by several orders of magnitude (Figure 12). In addition, both the particulate- and
gas-phase PAH concentrations alone exceeded all guideline values. These results clearly
demonstrate the severity of the exposure risk not only for the primary cooks but also for
any household members who resided in the immediate cooking area.
Figure 12. Gas- and particulate-phase PAH concentrations measured in the 56 personal breathing-zone and 56 cooking-area samples (BZ = breathing zone, CA = cooking area, PP = particulate phase, GP = gas phase, T = PP + GP).
Due to the logistical difficulties of monitoring personal exposures, the feasibility of using
area exposure measurements as a proxy for a measure of personal exposure has been 0.00
1.00 2.00 3.00 4.00 5.00 6.00 7.00 8.00
BZ PP CA PP BZ GP CA GP BZ T CA T
Co
nc
en
tr
at
io
n
(mg
/m
3 )
preliminary analysis, no significant difference in the measured total PAH concentration
(gas phase + particulate phase) was observed between the two lighting-fuel types (Figure
13). Further, only a weak relationship was observed between the PAH concentrations
measured in the personal breathing zones and cooking areas in the gas phase (Figure 14)
and in the particulate phase (Figure 15). The discrepancy between the two could be
explained by the amount of time spent cooking, ambient temperature, ventilation of the
cooking area, or other exposures encountered by the cook throughout the monitoring
period (trash burning, cooking at a neighbor’s house, etc.). Therefore, these results
indicate that PAH concentrations measured in a cooking area should not be used as a
proxy to enumerate personal exposure levels.
Figure 13. Gas- and particulate-phase PAH concentrations measured in the personal breathing zone and cooking area when plastic or sticks/wood fuel were used to light the fuel (PM = particulate matter phase, GP = gas phase).
0.00 0.50 1.00 1.50 2.00 2.50
128 152 154 166 178 178 202 202 228 228 252 252 252 276 276 278
Co
nc
en
tr
at
io
n
(mg
/m
3)
Ion Mass
PLASTIC-‐PM STICKS-‐PM
Figure 14. The relationship between the measured personal breathing-zone and cooking-area gas-phase PAH concentrations.
Figure 15. The relationship between the measured personal breathing-zone and cooking-area particulate-phase PAH concentrations.
The effect of lighting the fuel with plastic products or small sticks and wood on gas- and
particulate-phase PAH exposure are presented in Figures 16 and 17, respectively. As can
be seen in Figure 16, the correlation between personal and area exposure levels for
R² = 0.3604
0.00 1.00 2.00 3.00 4.00 5.00 6.00
4.00 4.50 5.00 5.50 6.00 6.50 7.00
Pe rs on al ( mg /m
3)
Area (mg/m3)
R² = 0.00275
0.00 0.20 0.40 0.60 0.80 1.00 1.20 1.40 1.60 1.80
0.90 1.40 1.90 2.40 2.90 3.40 3.90 4.40
Pe rs on al ( mg /m
3)
phase PAHs increased when plastic was used for lighting the fuel (R2 = 0.82) but not
when sticks and wood were used. However, the lighting-fuel type did not improve the
predictability of PAH exposure between personal breathing zone and area sampling for
the particulate-phase PAHs (Figure 17).
No significant difference between the PAH exposure levels was observed when cooking
indoors or outdoors (Figures 18 and 19). However, the correlation between the personal
and area exposure levels increases for gas-phase PAHs (R2 = 0.65; Figure 18) but not for
particulate-phase PAHs when cooking outdoors (Figure 19).
Figure 16. The relationship between the personal breathing-zone and cooking-area gas-phase PAH concentrations when plastic or sticks/wood fuel were used to light the fuel.
R² = 0.02998
R² = 0.81751
0.00 1.00 2.00 3.00 4.00 5.00 6.00
4.00 4.50 5.00 5.50 6.00 6.50 7.00
Personal
(g/m
3)
Area (g/m3)
Sticks/wood-‐GP
Figure 17. The relationship between the personal breathing-zone and cooking-area particulate matter phase PAH concentrations when plastic or sticks/wood fuel were used to light the fuel.
Figure 18. The relationship between the personal breathing-zone and cooking-area gas-phase PAH concentrations when cooking is performed indoors or outdoors.
R² = 0.08223
R² = 0.08576
0.40 0.60 0.80 1.00 1.20 1.40 1.60
1.00 1.50 2.00 2.50 3.00 3.50 4.00
Pe rs on al ( mg /m
3)
Area (mg/m3)
Sticks/wood-‐PM
Plastic-‐PM
R² = 0.08332
R² = 0.65312
0.00 1.00 2.00 3.00 4.00 5.00 6.00
1.80 2.80 3.80 4.80 5.80 6.80 7.80
Pe rs on al ( mg /m
3)
Area (mg/m3)
Figure 19. The relationship between the personal breathing-zone and cooking-area particulate matter phase PAH concentrations when cooking is performed indoors or outdoors.
A final analysis was performed to fully characterize and quantify the PAHs present in
each individual sample. Figures 17 and 18 show the concentration of each PAH measured
in the particulate (GFF pre-filter) and gas phases (PUF/XAD2), respectively. The results
are similar to the prior published studies (reviewed in Ravindra et al, 2008), with the
lower molecular weight PAHs seen primarily in the gas phase, particularly naphthalene
(Figure 20), mid-molecular weight PAHs observed in both the gas- and particulate phase,
and relatively few high molecular weight PAHs seen in either phase (Figures 20 and 21).
Overall, a majority of PAHs measured were observed in the gas phase, comprising about
60 percent of the total concentration (Figure 22). There is little agreement in prior studies
as to which phase is more abundant in cookstove smoke (Shen et al, 2014, Oanh et al,
2002). From a meta-analysis of the field and laboratory techniques as well as of
analytical techniques used to measure PAH levels, it was concluded that analyzed PAH
R² = 0.01035 R² = 3.4E-‐05
0.00 0.20 0.40 0.60 0.80 1.00 1.20 1.40 1.60 1.80
0.40 1.40 2.40 3.40 4.40
Pe rs on al ( mg /m
3)
Area (mg/m3)
Indoor-‐PM
conditions, although the analysis of the partitioning between gas- and particulate-phase
PAHs should be approached with some caution (Ravindra et al 2008). When using the
GFF-PUF/XAD2 sampler, low and mid-molecular weight compounds collected in the
particulate phase (i.e., onto the GFF pre-filter) can volatilize during sample storage and
then be absorbed into the PUF/XAD2 sorbent, and thus quantified in the gas phase.
Unfortunately, there is no solution to this issue currently known, however, it is generally
assumed to affect analyses only to a small extent (Ravindra et al, 2008).
Figure 20. Median concentration of each of the particulate-phase PAHs extracted from GFF pre-filter samples. Each line represents an individual PAH (shown as the ion mass) concentration measured in a single sample.
Figure 21. Median concentration of each of the gas-phase PAHs extracted from GFF pre-0.00
0.20 0.40 0.60 0.80 1.00 1.20
128 152 154 166 178 178 202 202 228 228 252 252 252 276 276 278
Co nc en tr at io
n
(mg
/m
3 )
Ion Mass
0.00 0.50 1.00 1.50 2.00 2.50 3.00 3.50
128 152 154 166 178 178 202 202 228 228 252 252 252 276 276 278
Co n ce n tr at io n ( m g/ m ^ 3 )
filter samples. Each line represents an individual PAH (shown as the ion mass) concentration measured in a single sample.
Figure 22. Median concentration of each of the gas-phase and particulate matter phase
PAHs extracted from GFF pre-filters and from PUF/XAD2.
0.00 0.20 0.40 0.60 0.80 1.00 1.20 1.40 1.60 1.80 2.00
128 152 154 166 178 178 202 202 228 228 252 252 252 276 276 278
Co
nc
en
tr
a)
on
(m
g/
m
^3
)
Ion Mass
Conclusions
The preliminary results presented here demonstrate the complexity encountered when
evaluating exposures from HAP in developing countries. We expected to observe lower
exposure levels in households in which outdoor cooking was primarily performed.
However, this was not the case. A variety of reasons could explain this, including the
sampling division of fuel lighting sources. In most households where plastic fuel lighting
was used, cooking was primarily done outdoors. As we would expect plastic lighting fuel
to produce higher concentrations of PAHs, the combination of outdoor cooking and the
use of plastic lighting fuel could lead to similar exposure levels as those in households
cooking indoors with a biomass-based lighting fuel. This exemplifies the need for
multivariate analysis to accurately assess exposure. In order to draw further conclusions
regarding the effects of either lighting-fuel type or cooking locations on exposure levels,
the personal and area samples collected in the 180 households must be analyzed and a
detailed assessment of personal and environmental factors potentially affecting the
exposure levels must be considered in statistical analyses.
This is not the only challenge seen in field studies of PAH emissions. Other hurdles
include the potential for different confounding factors (e.g., climate effects, other
exposures), the difficulties of setting up monitoring equipment at a field site, and/or the
storage and transport of samples. Discrepancies between laboratory and field
measurements have been reported. For example, Shen and colleagues (2011) observed
study (Shen et al, 2011). This is not unexpected and cautions us not to attempt to make
recommendations based solely on one method.
This study has demonstrated the clear need for further research and action on this topic,
as much greater concentrations of PAHs were seen in cooking areas and breathing zones
than is recommended by any regulatory body. This has been observed in prior research
(Shen et al, 2015; Oanh et al, 1999), and similar concentrations are seen in this study as
are in several others, including two studies by Raiyani and colleagues who reported PAH
concentrations just below 4.0 mg/m3 (Raiyani et al, 1994) and around 0.5 mg/m3 (Raiyani
et al, 2012). Our study also demonstrates the need for complex analyses involving
multiple variables that may affect exposure, such as cooking location, lighting fuel, and
fuel moisture, as has also been noted in prior studies (Raiyani et al, 1993; Shen et al,
2013; Oanh et al, 1999; Jetter 2012; Wand 2016).
While research on the toxic household air pollution exposures is of critical importance in
regions south as East Africa where a large proportion of the population is near a
cookstove for much of the day, it has implications in other, more developed countries as
well. Estimates have shown that in general, people spend more than 80 percent of their
time indoors, and therefore indoor air quality can play a large role in the health of the
average population. While most developed countries do not rely on biomass-burning
cookstoves for cooking purposes, there are large regions where woodstoves usage for
heating is widespread. In addition, the consequences of PAH exposure is not limited only
Oost et al, 2005). Thus, the reduction of PAHs produced by cookstoves could result in
overall improvement of health at many levels. This research also has the potential to aid
in the efforts to better understand and ameliorate climate change, as well as deforestation,
land-use, and other environmental air pollution and biomass-burning issues.
Primarily, this research aids in both understanding the relationship between the exposure
and adverse health effects of cookstove emissions, and the development of new, safer
methods for food preparation and home heating with the potential to improve the health
outcomes of millions of people globally.
References
Baek, S. O., et al. "A review of atmospheric polycyclic aromatic hydrocarbons: sources,
fate and behavior." Water, air, and soil pollution 60.3-4 (1991): 279-300.
Blanton, Robert H., et al. "Immunomodulation by polyaromatic hydrocarbons in mice
and murine cells." Cancer research 46.6 (1986): 2735-2739.
Blanton, Robert H., Michael J. Myers, and Peter H. Bick. "Modulation of
immunocompetent cell populations by benzo [a] pyrene." Toxicology and applied
pharmacology 93.2 (1988): 267-274.
Bobak, Deanna M. "Polycyclic Aromatic Hydrocarbon Characterization in Otter Creek, Northwest Ohio." (2010).
Boehm, P. D., et al. "Total organic carbon, an important tool in an holistic approach to
hydrocarbon source fingerprinting." Environmental Forensics 3.3-4 (2002): 243-250.
Bonner, Matthew R., et al. "Breast cancer risk and exposure in early life to polycyclic aromatic hydrocarbons using total suspended particulates as a proxy measure." Cancer Epidemiology Biomarkers & Prevention 14.1 (2005): 53-60.
Chao, Y-C.E.*; Gibson, R.L. and Nylander-French, L.A.: Dermal exposure to jet fuel (JP-8) in US Air Force personnel. The Annals of Occupational Hygiene 49(7):639-645, 2005.
Chao, Y-C.E.*; Kupper, L.L.; Serdar, B.: Egeghy, P.P.; Rappaport, S.M. and Nylander-French, L.A.: Dermal exposure to JP-8 significantly contributes to production of urinary naphthols in fuel-cell maintenance workers. Environmental Health Perspectives 114(2):182-185, 2006.
Clark, Maggie L., et al. "Health and household air pollution from solid fuel use: the need
for improved exposure assessment." Environmental health perspectives 121 (2013):
1120-1128.
Coleman, Peter J., et al. "Observations on PAH, PCB, and PCDD/F trends in UK urban
air, 1991-1995." Environmental Science & Technology 31.7 (1997): 2120-2124.
Dasgupta, Subham, et al. "Genotoxicity of oxy-PAHs to Japanese medaka (Oryzias
latipes) embryos assessed using the comet assay." Environmental Science and
Pollution Research 21.24 (2014): 13867-13876.
Harrison, Roy M., D. J. T. Smith, and L. Luhana. "Source apportionment of atmospheric polycyclic aromatic hydrocarbons collected from an urban location in Birmingham,
UK." Environmental Science & Technology 30.3 (1996): 825-832.
Harvey, Patricia J., et al. "Phytoremediation of polyaromatic hydrocarbons, anilines and
phenols." Environmental Science and Pollution Research 9.1 (2002): 29-47.
Jetter, James, et al. "Pollutant emissions and energy efficiency under controlled
conditions for household biomass cookstoves and implications for metrics useful in
setting international test standards." Environmental science & technology 46.19
(2012): 10827-10834.
Khalili, Nasrin R., Peter A. Scheff, and Thomas M. Holsen. "PAH source fingerprints for coke ovens, diesel and, gasoline engines, highway tunnels, and wood combustion
emissions." Atmospheric environment 29.4 (1995): 533-542.
Kim Oanh, Nguyen Thi, Lars Bætz Reutergårdh, and Nghiem Trung Dung. "Emission of polycyclic aromatic hydrocarbons and particulate matter from domestic combustion
of selected fuels." Environmental Science & Technology 33.16 (1999): 2703-2709.
Kim Oanh, Nguyen Thi, Le Hoang Nghiem, and Yin Latt Phyu. "Emission of polycyclic aromatic hydrocarbons, toxicity, and mutagenicity from domestic cooking using
sawdust briquettes, wood, and kerosene." Environmental science & technology 36.5
(2002): 833-839.
Kim, D.*; Andersen, M.E.; Chao, Y-C.E.*; Egeghy, P.P.; Rappaport, S.M. and
Nylander-French, L.A.: PBTK modeling demonstrates contribution of dermal and inhalation
exposure components to end-exhaled breath concentrations of naphthalene.
Environmental Health Perspectives 115(6):894-901, 2007. PMCID: PMC1892111
Klaassen, Curtis D., ed. Casarett and Doull's toxicology: the basic science of poisons.
Vol. 1236. New York (NY): McGraw-Hill, 2013.
Likhachev, A. J., et al. "Biomarkers of individual susceptibility to carcinogens:
Application for biological monitoring." International archives of occupational and
environmental health 65.1 (1993): S155-S158.
Liu, Liang, et al. "Effect of biochar amendment on PAH dissipation and indigenous
degradation bacteria in contaminated soil." Journal of Soils and Sediments 15.2
(2015): 313-322.
Lim, Jeng Shiun, et al. "A review on utilisation of biomass from rice industry as a source
of renewable energy." Renewable and Sustainable Energy Reviews 16.5 (2012):
3084-3094.
Malmgren, R. A., and B. E. Bennison. "Effect Of Carcinogens And Cancer
Vol. 12. No. 4. Po Box 11806, Birmingham, Al 35202: Amer Assoc Cancer Research, 1952.
Mumtaz, M. M., et al. "ATSDR evaluation of health effects of chemicals. IV. Polycyclic
aromatic hydrocarbons (PAHs): understanding a complex problem." Toxicology and
industrial health 12.6 (1996): 742-971.
Nicolaou, K., Masclet, P., Mouvier, G., 1984. Sources and chemical reactivity of PAH in the atmosphere—a critical
eview. Science of the Total Environment 32, 103–132.
Perera, Frederica P., et al. "Prenatal polycyclic aromatic hydrocarbon (PAH) exposure
and child behavior at age 6-7 years." Environmental health perspectives 120.6
(2012): 921.
Raiyani, C. V., et al. "Characterization and problems of indoor pollution due to cooking
stove smoke." Atmospheric Environment. Part A. General Topics 27.11 (1993):
1643-1655.
Ravindra, Khaiwal, Ranjeet Sokhi, and Rene Van Grieken. "Atmospheric polycyclic aromatic hydrocarbons: source attribution, emission factors and regulation." Atmospheric Environment 42.13 (2008): 2895-2921.
Ravindra, Khaiwal, et al. "Assessment of air quality after the implementation of compressed natural gas (CNG) as fuel in public transport in Delhi, India." Environmental monitoring and assessment 115.1-3 (2006): 405-417.
Ravindra, Khaiwal, Eric Wauters, and René Van Grieken. "Poster 34 Spatial and temporal variations in particulate Polycyclic Aromatic Hydrocarbon (PAH) levels
over Menen (Belgium) and their relation with air mass trajectories." Developments in
Environmental Science 6 (2007): 838-841.
Richter, Henning, et al. "Formation of polycyclic aromatic hydrocarbons and their
radicals in a nearly sooting premixed benzene flame." Proceedings of the
Combustion Institute 28.2 (2000): 2609-2618.
Rohr, Annette C., and Ronald E. Wyzga. "Attributing health effects to individual
particulate matter constituents." Atmospheric Environment 62 (2012): 130-152.
Rwanda population data, 2012. Accessed 19 March 2016.
Shen, Guofeng, et al. "Emissions of PAHs from indoor crop residue burning in a typical
rural stove: emission factors, size distributions, and gas− particle partitioning."
Wick, Abbey F., et al. "Remediation of PAH-contaminated soils and sediments: a
literature review." Virginia Polytechnic Institute and State University, USA 102
(2011).
Shen, Huizhong, et al. "Global atmospheric emissions of polycyclic aromatic
hydrocarbons from 1960 to 2008 and future predictions." Environmental science &
technology 47.12 (2013): 6415-6424.
Shen, Huizhong, et al. "Global lung cancer risk from PAH exposure highly depends on
emission sources and individual susceptibility." Scientific reports 4 (2014).
Smith, D. J. T., and R. M. Harrison. "Polycyclic aromatic hydrocarbons in atmospheric
particles." Atmospheric Particles (1998): 253-294.
Subramanyam, V., et al. "Gas-to-particle partitioning of polycyclic aromatic
hydrocarbons in an urban atmosphere." Atmospheric Environment 28.19 (1994):
3083-3091.
Szczeklik, Andrzej, et al. "Humoral immunosuppression in men exposed to polycyclic aromatic hydrocarbons and related carcinogens in polluted environments."
Environmental health perspectives 102.3 (1994): 302.
USEPA. Toxic Release Inventory Public Data Release. Washington, D.C.: Office of Environmental Information, United States Environmental Protection Agency; 2000
Van der Oost, Ron, Jonny Beyer, and Nico PE Vermeulen. "Fish bioaccumulation and
biomarkers in environmental risk assessment: a review." Environmental toxicology
and pharmacology 13.2 (2003): 57-149.
Van Jaarsveld, J.A., Van Pul, W.A.J., De Leeuw, F.A., 1997. Modelling transport and deposition of persistent organic pollutants in the European region. Atmospheric Environment 31, 1011–1024.
Van Vaeck, L., and K. Van Cauwenberghe. "Cascade impactor measurements of the size distribution of the major classes of organic pollutants in atmospheric particulate
matter." Atmospheric Environment (1967) 12.11 (1978): 2229-2239.
WHO and UNDP. 2009. Global health risks: mortality and burden of disease attributable
to selected major risks. World Health Organization. Geneva.
Wang, Yan, et al. "Influence of different types of coals and stoves on the emissions of parent and oxygenated PAHs from residential coal combustion in China."
Environmental Pollution 212 (2016): 1-8.
Wania, Frank, and Donald Mackay. "Peer reviewed: tracking the distribution of persistent
Yasuhira, Kimio. "Damage to the thymus and other lymphoid tissues from
3-methylcholanthrene, and subsequent thymoma production, in mice." Cancer
research 24.4 Part 1 (1964): 558-569.
Zhang, Q., et al. "Modeling of soot aggregate formation and size distribution in a laminar ethylene/air coflow diffusion flame with detailed PAH chemistry and an advanced
sectional aerosol dynamics model." Proceedings of the Combustion Institute 32.1
(2009): 761-768.
Zhao, Zhen-Hua, Wen-Yi Quan, and De-Hai Tian. "Urinary 1-hydroxypyrene as an indicator of human exposure to ambient polycyclic aromatic hydrocarbons in a
Appendix
IN OFFICE BEFORE DEPLOYMENT:
A. ID
# Question Response key Response
A1 Interviewer Name
A2 Interviewer code
A3 Date of interview dd:mm:year
A4 Household ID
A5 Primary cook ID
A6 Name of primary cook
A7 Type of monitoring Personal only=1
Area and personal=2
A8 Survey round 0, 6, 12, 18 or 24
A9 Is this household selected for Area
Monitoring
Yes=1 No=2
.
IF NOT SELECTED FOR AREA MONITORING, CROSS OUT
AREA SECTIONS
B1 Area PEM number
B2 Area PEM Filter number
B3 Area PEM Pump number
B4 Area PEM Battery number
B5 Area PEM Pump flow rate
pre-deployment (2 lpm)
LPM
B6 Area PUF Tube number
B7 Area PUF Pump number
B8 Area PUF Battery number
B9 Area PUF Pump flow rate
(pre-deployment) (2 lpm)
LPM
B10 Area CO data logger number
B11 Personal PEM number
B12 Personal PEM Filter number
B13 Personal PEM Pump number
B14 Personal PEM Pump flow rate
(pre-deployment) (2 lpm)
LPM
B15 Personal PUF Tube number
B16 Personal PUF Pump number
B17 Personal PUF Pump flow rate
(pre-deployment) (2 lpm)
LPM
B18 Personal CO data logger number
START OF EXPOSURE MONITORING PERIOD IN FIELD
C. Ventilation of cooking area*
# Question Response key Response
C1 During the past 7 days has your household cooked mainly
inside or outside?
Inside=1 Outside=2
C2 Is the household’s primary cooking area partially or
completely indoors (e.g. kitchen, shelter, room in house)?
Yes =1 No=2
D. Stove Type
# Question Response key
D1 What type of stove is the most commonly used stove in this
household during the past 7 days? (Labjack #1 goes here)
CHOOSE ONE
1=Traditional three stone/brick 2=Canarumwe (clay firewood)
3=Portable charcoal stove (clay or metal) 4= Fixed charcoal stove (clay or metal) 5=Forced draft gasifying stove (like Philips) 6=Paraffin / kerosene
7=Gas Cooker 8= Electric stove 9=Other (specify)
D2 How many of this type of stove do you have (number of stoves
or burners)?
#
D3 Percent of cooking, heating, water heating done with the most
commonly used stove during past 7 days?
Percent (0-100)
D4 What fuel is usually used in this stove? (most common during
past 7 days)
1=Charcoal 2=Fuelwood 3=Biomass pellets 4=Crop residues 5=Reeds/straw/shurbs/grass/urubingo 6=Kerosene/paraffin 7=Electricity 8=LPG/Natural gas 9=Biogas 10=Other, specify
D5 How do you usually light this stove? 1=small sticks/fuel wood
2=grass/reeds/straw 3=plastic bag or flip flop 4=kerosene
5=matches 6=neighbors fire 7=other, specify
D6 What type of stove is the second most commonly used stove in
this household during the past 7 days? (Labjack #2 goes here)
CHOOSE ONE, can be the same type as C1
0=Only one stove in household 1=Traditional three stone/brick 2=Canarumwe (clay firewood)
8= Electric stove 9=Other (specify)
D7 How many of this type of stove do you have (number of stoves
or burners)?
#
D8 Percent of cooking, heating, water heating done with the
second most commonly used stove during past 7 days?
Percent (0-100)
D9 What fuel is usually used in this stove? (most common during
past 7 days)
1=Charcoal 2=Fuelwood 3=Biomass pellets 4=Crop residues 5=Reeds/straw/shurbs/grass/urubingo 6=Kerosene/paraffin 7=Electricity 8=LPG/Natural gas 9=Biogas 10=Other, specify
D10 How do you usually light this stove? 1=small sticks/fuel wood
2=grass/reeds/straw 3=plastic bag or flip flop 4=kerosene
5=matches 6=neighbors fire 7=other, specify
E. Quantity of fuel to be used for cooking during 24 hour exposure monitoring period
# Question Response key Response
E1 Charcoal Kgs
E2 Fuelwood Kgs
E3 Biomass pellets Kgs
E4 Crop residues Kgs
E5 Reeds/straws/shrubs/grass/urubingo grass Kgs
E6 Kerosene/paraffin Liters
E7 Electricity kWh (if metered)
E8 LPG/Natural gas Liters
E9 Biogas NA
E10 Other, specify Specify units
DON’T FORGET TO ASK FOR A LITTLE BIT EXTRA FUEL
TO MEASURE
F. Fuel moisture content
# Question Response key Response
F1 Does your household dry wood/fuel near your cooking
fire or in the sun?
Yes=1 No=2
Only rainy season=3
F2 Does the household usually store fuel? Yes=1
No=2
G. Personal monitoring
# Question Response key Response
G1 Time started PEM hh:mm
G2 Time started PUF hh:mm
ASK COOK WHERE SHE WOULD LIKE AREA TRIPOD
TEACH COOK HOW TO MOVE TRIPOD (HAVE HER TRY PICKING IT UP)
TELL COOK SHE CAN RESUME NORMAL ACTIVITIES
H. Area monitoring
# Question Response key Response
H1 Monitor placed indoors or outdoors 1=Outdoor
2=Indoor
3=Partially indoor
H2 Distance from stove Cm
H3 Height of monitor Cm
H4 Time started PEM hh:mm
H5 Time started PUF hh:mm
ONLY IF KITCHEN IS INDOORS:
I1 Is there a gap of more than 5 cm between the top of the walls
and the roof in the cooking area?
Yes=1 No=2
I2 What are the dimensions of the doorway? HxW (cms)
I3 What are the dimensions of the windows? --- ---
13.1 Window 1 HxW (cms)
I3.2 Window 2 HxW (cms)
I3.3 Window 3 HxW (cms)
I3.4 Window 4 HxW (cms)
I3.5 Window 5 HxW (cms)
I4.2 Window 2 Cm
I4.3 Window 3 Cm
I4.4 Window 4 Cm
I4.5 Window 5 Cm
I4.6 Window 6 Cm
I5 How many ventilation holes are there? #
I6 Is there a soot line in the cooking area? Yes=1
No=2
I7 If yes, at what height does the soot line begin? cm
I8 What is the approximate area of the kitchen
cm2
I9 Average Height of walls Cm
I10 Height of ceiling (highest point) Cm
I11 Does the kitchen have an active chimney? Yes=1
No=2
I12 Notes about kitchen
design, layout, etc.
J. Stove use monitoring (SUMS) Labjack deployment
# Question Response key Response
Labjack #1 --- ---
J1 Labjack serial number
J2 Description of stove Labjack is assigned to 1=Traditional three stone/brick
2=Canarumwe (clay firewood)
3=Portable charcoal stove (clay or metal) 4= Fixed charcoal stove (clay or metal) 5=Forced draft gasifying stove (like Philips) 6=Paraffin / kerosene
7=Gas Cooker 8= Electric stove 9=Other (specify)
J3 Distance from Labjack to stove Cm
J4 How is Labjack secured? Brick=1
Stove=2 Other=9
J5 Is the Labjack in the sun? Yes=1
No=2
J7 Description of stove assigned to 1=Traditional three stone/brick 2=Canarumwe (clay firewood)
3=Portable charcoal stove (clay or metal) 4= Fixed charcoal stove (clay or metal) 5=Forced draft gasifying stove (like Philips) 6=Paraffin / kerosene
7=Gas Cooker 8= Electric stove 9=Other (specify)
J8 Distance from Labjack to stove Cm
J9 How is Labjack secured Brick=1
Stove=2 Other=3
J10 Is the Labjack in the sun? Yes=1
No=2
END OF EXPOSURE MONITORING PERIOD IN FIELD.
_____________________________________________________________________________
EQUIPMENT PICK UP IN FIELD:
TAKE BAG OFF COOK, STOP PERSONAL PUMPS IF NOT
STOPPED
K1 Minutes indicated remaining on PEM pump
K2 Minutes indicated remaining on PUF pumps
K3 Was the area exposure monitoring unit moved since it
was installed yesterday?
(Ask cook)
Yes=1 No=2
K4 Was the personal exposure monitoring unit taken off
since yesterday for any reason other than bathing or sleeping?
(Ask cook)
Yes=1 No=2
L. Other exposures
# Question Response key Response
L1 Since the monitors were placed yesterday, have you burned
garbage or brush?
CHOOSE ONLY ONE 3=Biogas 4=Generator 5=Kerosene/paraffin 6=Firewood 7=Candle 8=Solar 9=Batteries/bulb 10=Other, specify
L3 Since you started wearing the monitor yesterday, have you
been around fires for any reason other than cooking for your own household? (e.g., brick burning; restaurant; neighbor’s kitchen while fire was on etc.)
Yes=1 No=2
M. Quantity of fuel used for cooking during 24 hour exposure monitoring period How much fuel is left of the 24 hr. amount?
M1 Charcoal Kgs
M2 Fuel wood Kgs
M3 Pellets Kgs
M4 Crop residues Kgs
M5 Reeds/straws/shrubs/grass Kgs
M6 Kerosene/paraffin Liters
M7 Electricity kWh (if metered)
M8 LPG/Natural gas Liters
M9 Biogas NA
M10 Other, specify Specify units
M11 Was any extra fuel burned in the 2 stoves
in past 24 hours?
Yes = 1 No =2
Type Amount
M12 Collect 100 gram sample of fuel used in
household (only if biomass) for moisture
content analysis** (only for households
with area monitoring
Yes=1 No=2
PUT PERSONAL PUF IN JAR, PUT PERSONAL PEM IN BAG
STOP AREA PUMPS IF NOT STOPPED

![Figure 3. Metabolism and activation of benzo[a]pyrene, a common PAH.](https://thumb-us.123doks.com/thumbv2/123dok_us/8335940.2212745/15.918.174.730.122.229/figure-metabolism-activation-benzo-pyrene-common-pah.webp)