ABSTRACT: Lacking the power of purse and sword, the judiciary does not possess the coercive force afforded to the legislative and executive branches, leaving it dependent upon institutional legitimacy for effective functioning. However, due to rising campaign finance in increasingly political state judicial elections, many have questioned the integrity, independence and legitimacy of elected judicial officials. These questions came to a head in Williams-Yulee v. Florida Bar (2015), where the Supreme Court ruled that the personal solicitation of campaign finance by a judicial candidate was unconstitutional because “the public may lack confidence in a judge’s ability to administer justice without fear or favor if he [the campaign donor] comes by the [judges] office asking for favors” (Pg. 9). While this claim seems to have sound theoretical foundations, empirical evidence on how personally solicited campaign finance affects public trust is quite sparse. Through the presentation of experimental vignettes, this study presents the
I. INTRODUCTION
Limitations on the power of the judiciary have been noted for centuries. As Alexander Hamilton stated in Federalist 78 “The Executive not only dispenses the honors, but holds the sword of the community. The legislature not only commands the purse, but prescribes the rules by which the duties and rights of every citizen are to be regulated. The judiciary, on the
contrary...may truly be said to have neither FORCE nor WILL, but merely judgment.” Lacking the power of the purse or the sword to coerce compliance, the judiciary does not possess the force afforded to the legislative and executive branches. As a result, the judiciary is dependent upon institutional legitimacy for effective functioning.
selection” (O’Connor 2009, 565). Some empirical research has supported this claim—indicating that citizens who live in states with appointed courts have higher levels of confidence in the court system (Benesh, 2006). This evidence is built upon a normative agreement that judicial
independence confers judicial legitimacy.
A challenge to this this normative agreement emerged via the 2015 Supreme Court Case Williams-Yulee v Florida Bar. The case dealt with prospective Judge Lanell Williams-Yulee campaigning for a seat on a county court in the state of Florida. Williams-Yulee sent out an email personally appealing for campaign contributions, while simultaneously posting the letter on her campaign website. The judicial candidate was then sanctioned by Florida’s Supreme Court for violating the state’s code of judicial conduct due to her personal solicitation of campaign funds (Epps). Williams-Yulee protested the state bar’s decision, arguing that her right to solicit campaign funding was protected as free speech under the first amendment, and the case was appealed all the way up to the Supreme Court. In their finding, the majority in Williams-Yulee v Florida Bar case ruled against the potential judge. Justifying the decision, Chief Justice John Roberts wrote that “Simply put, the public may lack confidence in a judge’s ability to administer justice without fear or favor if he [the campaign donor] comes by the [judges] office asking for
Justice Scalia’s critique raises a particularly intriguing question: Does banning personal solicited campaign contributions improve public trust in members of the judiciary? While scholars have frequently analyzed the impact of campaign contributions and elections upon the behavior of the judiciary, little research exists on the specific issues of campaign finance and judicial legitimacy. Through experimental survey research, this paper aims to fill that void by providing the empirical data to address Scalia’s concern.
II. CAMPAIGN FINANCE IN JUDICIAL ELECTIONS
Prior to any investigation of claims regarding campaign finance and judicial legitimacy, it is necessary to evaluate the present state of judicial selection. Currently there are three primary methods of judicial selection used by the States: (1) Partisan Elections, where judges are elected by the citizens with party affiliation listed on the ballot, (2) Non-Partisan Elections, where judges are elected by the citizens without party affiliation listed, and (3) Merit Selection otherwise known as the “Missouri Plan”, where a commission submits a list of names to the governor, who then appoints a judge from that list. In assisted appointed the Judge is then confirmed by the citizens in a referendum “retention” election in each election cycle after the completion of their first term. Thirty-nine states use some variation of either merit selection, partisan or non-partisan elections (Methods of Judicial Selection 2015). This means that a vast majority of states rely upon their electorate to determine the makeup of the judicial branch.
2015, 2). But because this ban is particularly narrow in scope, money has flowed into judicial elections. Recent analysis of state election data found that $18 million was spent on State Supreme Court elections alone in 2014 (O’Brien 2015). In fact the scope of this ban on personal solicitations is so limited that judicial candidates may discuss their legal philosophies,
qualifications and even send signed thank you notes to donors (O’Brien 2015). “The only thing a judge can’t say is ‘Please give me money,’” writes Matthew Menendez of the Brennan Center for Justice (O’Brien 2015). Menendez’s statement supports a more general claim that the ban on personal solicitation of funds in judicial elections is less about independence, and far more about perceived independence. Were the ultimate concern judicial impartiality and independence, campaign contributions to prospective members of the judiciary would not be permitted at all. It is for this reason that the focus of this study is not on how campaign finance affects the behavior of judges, but rather how campaign finance affects public perception of the judiciary.
III. LITERATURE REVIEW
sentencing, and fully supports the claim that elections do affect the decision making of a judiciary (Huber and Gordon 2004, 248).
Literature has shown that the independence of judges is compromised by elections, and scholarship on campaign finance in judicial elections shows a similar trend. Joanna Shepherd, a Law Professor at Emory, conducted analysis for the American Constitution Society for Law and Policy on campaign contributions and judicial decisions. Shepherd analyzed the influence that businesses have on judicial decision making by determining whether the amount of money a member of the judiciary received from businesses was at all correlated with more pro-business rulings from that member. Shepherd found a statistically significant relationship between campaign contributions from businesses and justices making pro-business rulings. An elected justice who receives only 1 percent of their campaign contributions from the business sector, rules pro-business about 46 percent of the time. On the other hand, an elected justice who receives 25 percent of their campaign contributions from the business sector rules pro-business about 62 percent of the time (Shepherd 2013, 13). While questions about the directionality of this relationship are valid - it could certainly be that a business wants to spend money to support candidates who are already business, rather than their money making a candidate pro-business - the significance of Shepherd’s findings are not lost. There is a strong relationship between campaign finance and judicial decision-making, one that helps shape expectations for the results in this study.
Further research confirms Shepherd’s findings. Chris Bonneu and Damon Cann analyzed the relationship between attorney campaign contributions and judicial behavior in Nevada,
and the same is true for conservative contributions (Bonneau and Cann 2009, 18). This literature seems to suggest that judicial integrity and independence is compromised by campaign finances presence in judicial elections. But it remains to be seen if the public perceives this to be the case.
Though research identifying the impact of campaign finance upon public confidence in the judiciary is limited, tangentially related scholarship is present. Charles Gardner Geyh posited the axiom of eighty to help explain the relationship between the electorate and the state judiciary. Gardner Geyh argued “Eighty percent of the public favors electing their judges; eighty percent of the electorate does not vote in judicial races; eighty percent is unable to identify the candidates for judicial office; and eighty percent believes that when judges are elected, they are subject to
influence from the campaign contributors who made the judges’ election possible” (Gardner Geyh 2003, 52). These claims have poignancy for the theoretical foundations of this study. The
electorate may believe that campaign contributions influence judges, but this belief need not preclude the electorate from a preference for elected judges.
Further research seems to echo the findings of Gardner Geyh. Research conducted by Nathan Persilly and Kelli Lammie of Penn found numerous examples of the Supreme Court themselves citing polling data that indicated the electorate views campaign finance as a corrupting agent. In Carver v Nixon the court wrote “An overwhelming 74 percent of the voters of Missouri determined that contribution limits are necessary to combat corruption,” and cited similar polling data stating “78 percent of Montana voters thought money was “synonymous with power” and that 69 percent of Montana residents believed “elected officials g[a]ve special treatment” to large contributors,” in Montana Right to Life Assistance v Eddleman (Persilly and Laramie 2004, 133).
24 different experimental vignettes, with variation based upon (1) the type of campaign
contribution, and whether it was accepted by the candidate (2) the size of contribution (3) whether the judge recused himself and (4) the case outcome. The vignettes were based upon existing litigation that took place in West Virginia, where a judge refused to recuse himself from hearing a case in which one of the litigants contributed more than three million dollars to his electoral campaign. Gibson and Caldeira found that 78.5% of those surveyed believe that a hypothetical judge can be fair and impartial when he rejects the offered campaign contribution, while only 46.1% of those sampled believe that the judge can be fair and impartial when he accepts the campaign contribution(s) (Gibson and Caldeira 2013, 17).
Further research by Gibson, has arrived at similar conclusions. He conducted research on the influence of campaigns on institutional legitimacy by producing comparative experimental vignettes for the legislative and judicial branches. Gibson found that yet again “when candidates for public office receive campaign contributions from those with direct business interests before the institution, many (if not most) citizens perceive policy making as biased and partial and the policy-making institution as illegitimate” (Gibson 2008, 72).
IV. THEORETICAL FOUNDATION
Most prior scholarship has arrived at similar conclusions - campaigning has a negative effect upon both perceived and actual impartiality and independence for the courts. In fact this line of research indicates that the judiciary is directly impacted by whom they receive funds from, and the amount they receive. But most of this scholarship is limited in two particular areas: (1) salience and (2) context. A vast majority of research regarding judicial legitimacy and
“elected officials gave special treatment to large contributors” or presenting an extended vignette solely about a potential conflict of interest regarding campaign contributions can provide insight into how the public thinks about the issues of campaign finance and judicial integrity, but only when the issues are salient.
This priming effect may particularly affect results because a host of literature shows that the public simply knows very little about the judiciary. An impactful 2006 survey conducted by the Annenburg center found that only 15% of Americans were able to name the Chief Justice of the Supreme Court, while 66% could name at least one American Idol judge. The same survey found that approximately ¾ of Americans failed to distinguish the role of state legislators from the state judiciary (Jamieson and Hennessy 2006). This lack of knowledge certainly has an impact on results: when particular issues are made salient through surveying, a respondent's lack of knowledge on the judiciary may cause them to overweight this new information.
A particularly strong piece of evidentiary support for the contextual argument comes from a study conducted in Pennsylvania by James Gibson, Jeffrey A. Gottfried, Michael X. Delli Carpini, and Kathleen Hall Jamieson. The quartet examined the effects of campaign activity on the support Pennsylvanians extended to their state Supreme Court, using survey data before, during and after the election to test their hypothesis. While the researchers found that any
exposure to politicized campaign activity led to lower growth in institutional support, they found that no amount of exposure to campaign activity created a net loss in judicial legitimacy. “Indeed, those viewing the worst form of campaign content still increased their support for the
Pennsylvania Supreme Court,” the foursome wrote (Gibson et. al 2010, 10). This finding is in conjunction with prior scholarship that states that campaign activity reduces perceptions of judicial legitimacy - but this finding differs by showing that this drop in legitimacy is not enough to offset the increase in legitimacy elections afford the judiciary. There are no elections without campaigning, and the inherent tie between the two makes this study of particular consequence.
V. HYPOTHESES
H1: Survey respondents will rate elected judges and an elected judiciary as more impartial, fair and legitimate than an appointed judge and judiciary.
As extant research has shown, the public prefers accountability, and elections are the proverbial carrot and stick that allow the electorate control over their judiciary. While two of the three conditions in which judges are elected include the presence of campaign finance, the “net positive effect” that elections provide will outweigh the negative effects on legitimacy and impartiality associated with campaign finance.
As discussed above, the amount of knowledge that the average citizen has about their state judiciary is quite low. I find it unlikely that the public has the level of expertise to know the different methods of raising campaign funding in state judicial elections without each being explicitly mentioned.
VI. METHODOLOGY AND EXPERIMENTAL DESIGN
In order to test this theory and properly address the gap within existing literature, this study uses experimental survey vignettes. The vignette design is contrastive vignette technique (CVT). In this vignette design, the researcher systematically varies the information within each vignette in order to determine the effect of particular components. For this study, four
experimental vignettes will be presented. These vignettes aim to determine the relationship between campaign contributions, judicial elections, and judicial legitimacy, presenting an
opportunity to glean critical information on the electorate without priming survey respondents. In the subfield of public opinion and the judiciary, vignettes are not uncommon, with some of the research discussed above incorporating the use of these short stories (Gibson & Caldeira 2008, Gibson et. al. 2007).
Participants
characteristics of survey respondents by condition. The covariates listed below (age, gender, race, ideology, political involvement, SES) appear to be essentially the same across the experimental groups. When I regress the treatment upon each of these factors, the β value is not statistically significant. This indicates that the random assignment done by Qualtrics was sound.
Table 1. Demographic/Political Characteristics of Participants by Condition (%)
Control Treatment 1 Treatment 2 Treatment 3
Gender
Male 46.27 37.21 38.27 34.25
Female 53.73 62.79 61.73 65.75
Race
White 73.13 71.26 71.95 69.33
Black 7.46 8.05 7.32 8.00
Hispanic 4.48 3.45 7.32 2,67
Non-‐White 14.93 17.24 13.41 20.00
Age
18 & Under 48.41 46.98 47.55 60.27 19 – 21 50.00 45.77 46,35 36.99
22+ 1.59 7.22 6.10 2.74
Ideology
Very Liberal 16.42 17.44 14.63 10.81
2 32.84 32.56 41.46 43.24
3 13.43 10.47 23.17 9.46
4 32.84 37.21 15.85 28.38
Very Cons. 4.48 2.33 4.88 8.11 Political
Involvement
High (8 <) 1.49 2.35 1.22 2.70 Mid (9 – 12) 20.90 25.89 50.00 45.95 Low (12 – 15) 77.61 71.76 48.78 51.35
SES
Upper Class 5.97 15.12 8.54 13.51
2 41.79 40.70 53.66 28.38
3 38.81 30.23 25.61 44.59
4 10.45 6.98 6.10 10.81
Lower Class 2.99 6.98 6.10 2.70
Procedure
This study obtained Institutional Review Board approval (IRB Study #16-2023) and was placed in the UNC-CH political science subject pool. Access to the class rosters of introductory American Government course at UNC-CH was granted, and each student enrolled received an email with a link to the survey and a consent form. This email and the consent form can be found in the appendix below. After participants provided electronic consent, they were directed to the questionnaires, which were hosted on Qualtrics. Students were randomly assigned to one of four conditions by Qualtrics and then completed the questionnaire. Upon completion of questionnaire, they entered identifying information to receive class credit for taking this survey.
Experimental Design
These vignettes present a hypothetical state Supreme Court candidate profile. The profile lists the hypothetical candidate’s qualifications, education, experience, endorsements and
affiliation are obscured. This was done to help the internal and external validity of the results, by preventing biases against race, gender or party affiliation from skewing the results.
The four vignettes, available in full in appendix 1, differ in small fashion. Table 2, below, indicates the manipulation and text changed in each condition. The first vignette presents Yu’s candidate profile, but makes no mention of campaign finance. This condition is the control – it allows us to determine if elections actually have a “net positive” effect. The second vignette presents Yu’s candidate profile, but mentions that: “This justice is up for re-election this year, but received no campaign funding of any kind as it is barred in this state.” By having this justice elected but not receive campaign finance, it is possible to isolate the value of an election as legitimacy conferring. The third vignette presents Yu’s candidate profile, and mentions that: “This justice is up for re-election this year, and personally solicited $480,427 in campaign contributions. These contributions came from a variety of sources, including businesses, interest groups and attorneys.” This condition allows for an understanding of how the presence of personally solicited campaign finance in an election can alter judicial legitimacy. The fourth vignette is identical to the third, only this candidate’s money was raised through a campaign committee, not personal solicitations. This vignette can clarify whether the public views personally solicited campaign finance any differently than campaign finance raised through a campaign committee. The amount of $480,427 was chosen because it was average amount raised by an incumbent candidate in a contested Supreme Court election (“Fundraising for 2014
Table 2. Manipulation of Vignette
Condition/Manipulation Text Included In Vignette N
1: No campaign finance, Judge is Appointed (Control)
This justice was appointed by the governor, and will serve
on the court for life 67
2: No campaign
finance, judge is elected (Treatment I)
This justice is up for re-election in 2016, but received no campaign funding of any kind as it is constitutionally barred
in this state
87 3: $480k in campaign
finance – all personally solicited. Judge is elected (Treatment II)
This justice is up for re-election in 2016, and personally solicited $480,427 in campaign contributions. These contributions came from a variety of sources including
businesses, interest groups and attorneys.
82
4: $480k in campaign finance through a campaign committee, Judge is elected (Treatment III)
This justice is up for re-election in 2016, and received $480,427 in campaign contributions through a campaign
committee. These contributions came from a variety of sources including businesses, interest groups and attorneys.
75
heightened understanding of how elections, appointments, personally solicited and committee raised campaign finance each relate to judicial legitimacy.
After completing the vignette, the bottom of the page contains three questions - common among all four conditions. These questions measure the perceived trust or integrity respondents have in the hypothetical candidate presented. The questions are taken from Gibson and Caldeira’s 2011 study on judicial impartiality and campaign contributions and slightly altered to fit this survey. Table 3 displays these questions and answer choices.
Table 3. Measures of Judicial Legitimacy
(#) Question Responses
(#1) Based upon this candidates profile, rate your feelings about this candidates ability to serve as a judge in your state
I strongly believe this candidate can serve as a fair and impartial judge I somewhat believe this candidate can be a fair and impartial judge I have no belief on whether this candidate can or cannot be fair and
impartial
I somewhat believe this candidate cannot be a fair and impartial judge I strongly believe this candidate cannot be a fair and impartial judge (#2) How likely are
you to accept decisions made by this judge as impartial, fair and legitimate
Very likely Somewhat likely
Not very likely
(#3) Assume for the moment that all judges on the North Carolina Supreme Court were selected in the same way as this judge. Rate your agreement with the following statement. The North Carolina Supreme Court is Legitimate Institution.
Responses to question 1, are scored from 1 (strongly believe this candidate cannot be a fair and impartial judge) to 5 (I strongly believe this candidate can serve as a fair and impartial judge). Responses to question 2 are scored from 1 (Not very likely) to 3 (Very likely). Finally, responses to question 3 are scored from 1 (Strongly Disagree with NC Supreme Court being a legitimate institution) to 4 (Strongly Agree with NC Supreme Court being a legitimate
institution). Responses to these three questions can be summed together to create a single variable that measures the index of judicial legitimacy. This variable will have values that range from 3 (lowest possible legitimacy) to 12 (highest possible legitimacy). Because each of these responses are scored on a modified Likert scales, they can be treated as interval level variables.
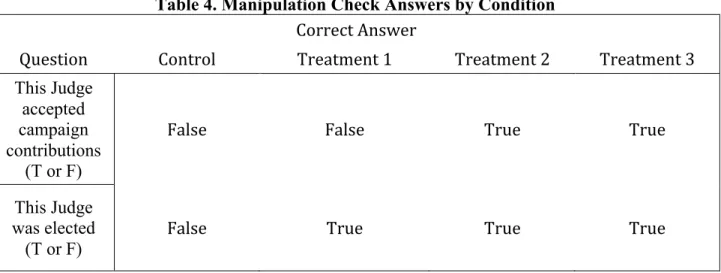
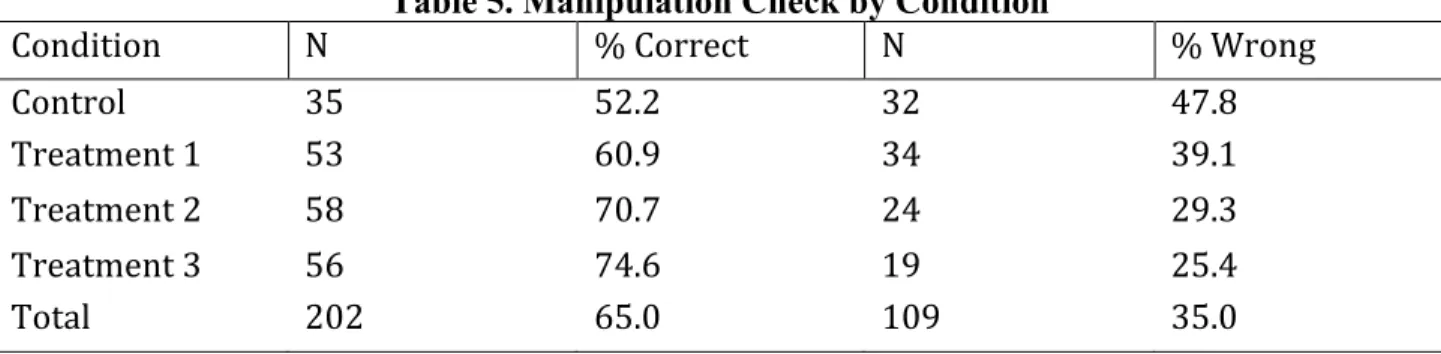
Next, respondents are asked a pair of true and false questions about the candidate (question numbers four and five) that serve as manipulation checks. Because campaign finance and elections are only mentioned in a single line of the vignette to prevent priming respondents, change in the dependent variable is subtle. The questions and answers for the manipulation check are listed below in table 4. Table 5, also below, shows how often survey respondents correctly recognized changes in the dependent variable.
Table 4. Manipulation Check Answers by Condition Correct Answer
Question Control Treatment 1 Treatment 2 Treatment 3 This Judge
accepted campaign contributions
(T or F)
False False True True
This Judge was elected
Table 5. Manipulation Check by Condition
Condition N % Correct N % Wrong
Control 35 52.2 32 47.8
Treatment 1 53 60.9 34 39.1
Treatment 2 58 70.7 24 29.3
Treatment 3 56 74.6 19 25.4
Total 202 65.0 109 35.0
35% of those sampled answered at least one of the manipulation check questions incorrectly. This number was exceptionally high in the first condition, when nearly half of all respondents answered one of the two questions incorrectly.
After the completion of the vignette, survey questions, and manipulation checks, survey respondents answered a set of demographic questions, listed below in Appendix III. These questions ask about a respondent’s age, race, gender, citizenship status, socioeconomic status, political party affiliation, political ideology, year in school, and religious affiliation. Also
included are questions regarding the respondent’s level of political involvement. These questions ask whether the respondent voted in the last election, has ever donated money to a political
candidate, has ever worked or volunteered for a political campaign, or has ever publicly displayed support of a political candidate.
The independent variable in this experimental survey is campaign finance, represented by condition. The presence of campaign finance here is a binary, but with some conditions.
campaign committee. The dependent variable here is judicial legitimacy, as measured by the omnibus variable that combines the responses of the three questions listed in table 3.
Based upon my hypotheses, I expected that the highest ratings of judicial legitimacy would occur in the second vignette - where the justice is elected, but any solicitation of campaign finance is barred. Existing scholarship indicates that the public prefers an elected judiciary, but recognizes the demands of campaigning and campaign finance compromise judicial integrity (Gibson & Caldeira 2011, Gibson et. al, 2010). The second vignette strikes a perfect balance between these two conditions. I anticipate that the second highest ratings of judicial integrity will occur in the third and fourth vignettes if my theoretical foundation is sound. In the third condition the justice is elected, and personally solicited campaign finance. In the fourth condition the justice is elected, and received campaign funding through a campaign committee, but personally solicited no funds. As prior research above has indicated, the public views the judicial accountability that elections provide as outweighing the drawback of compromised judicial impartiality that
appointed, will then have the lowest ratings of judicial integrity. The public prefers judicial accountability to some level of compromised impartiality, as some prior scholarship suggests (Gibson et. al, 2010).
VII. RESULTS
To maintain the principles of random assignment, all respondents are included in the analysis unless otherwise noted (n = 311). Some analysis of only those who answered the
manipulation check questions correctly is also presented (n = 202). More weight must be assigned to analysis that includes all survey respondents because this analysis maintains the principles of randomness and random assignment. Because this data has a categorical IV (Condition) and interval DV (Judicial Legitimacy Index), a one-way ANOVA was conducted to determine if ratings of Judicial Legitimacy were different depending upon the campaign finance and method of selection for this hypothetical judicial candidate. The Judicial Legitimacy Index is the omnibus variable that sums responses to the three questions listed in table 2. This variable ranges from 3 (lowest possible rating of legitimacy) to 12 (highest possible rating of legitimacy). For this hypothesis testing:
H0: µ1 = µ2 = µ3 = µ4
Ha: The population means are not all equal
The results of this one-way ANOVA are presented below in table 5 and 6. Table 5
result we cannot reject the null hypothesis that the population means for each condition are equal. Because the results of this one-way ANOVA are not statistically significant, no post-hoc tukey testing was required. The group means and standard deviations are displayed below in table 7.
Table 5. One-Way ANOVA For Judicial Legitimacy Index, Manipulation Check Correct Sum of Squares df Mean Square F Sig (P > F)
Between Groups 5.59 3 1.86 0.92 0.4298
Within Groups 399.22 198 2.02
Total 404.82 201 2.01
Table 6. One-Way ANOVA For Judicial Legitimacy Index, All Respondents Sum of Squares df Mean Square F Sig (P > F)
Between Groups 10.63 3 3.54 1.37 0.2515
Within Groups 792.86 307 2.58
Total 803.49 310 2.59
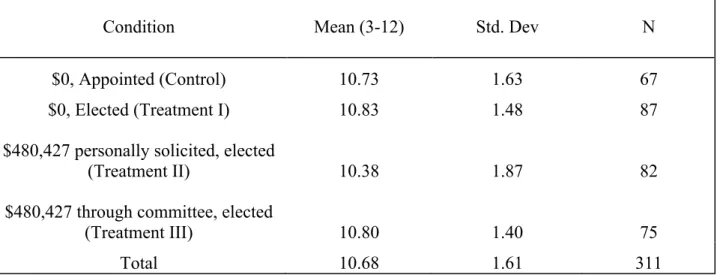
Table 7. Judicial Legitimacy (Index) By Conditions, All Respondents
Condition Mean (3-12) Std. Dev N
$0, Appointed (Control) 10.73 1.63 67
$0, Elected (Treatment I) 10.83 1.48 87
$480,427 personally solicited, elected
(Treatment II) 10.38 1.87 82
$480,427 through committee, elected
(Treatment III) 10.80 1.40 75
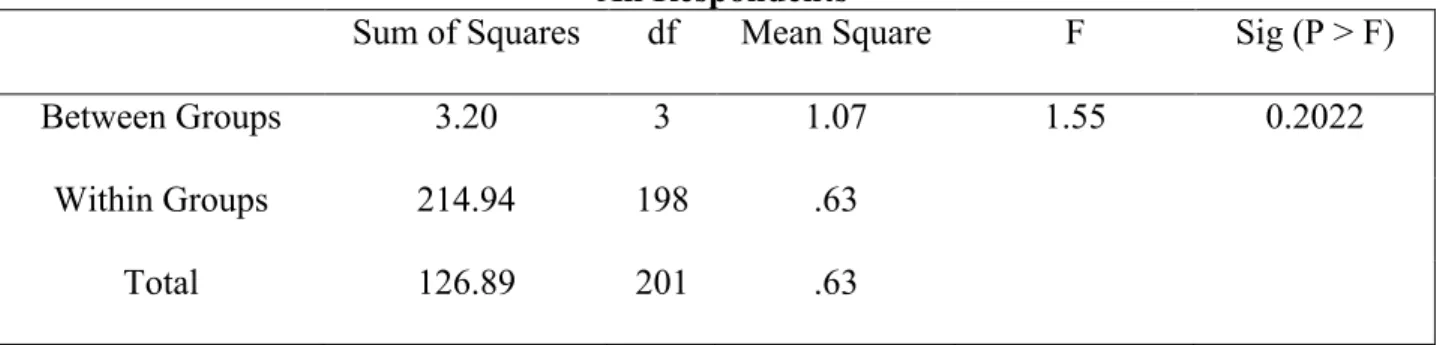
One-way ANOVA was also conducted on each of the individual questions measured in table 3. Just as before the IV (Condition) here is categorical, and the DV (each individual question used to measure judicial legitimacy) is interval. Our Ho and Ha remain the same as well. Results for the one-way ANOVA on question one (Candidate Fairness/Impartiality) for all respondents
are displayed below in table 7. There was not a statistically significant difference in ratings of candidate impartiality between each condition as determined by the one-way ANOVA (F(3, 307) = 1.55, p = 0.2022) at an α level of 0.05. Even when analysis only included those respondents that answered the manipulation check correctly, there was not a statistically significant difference in ratings of candidate impartiality between each of the groups as determined by the one-way ANOVA (F(3,198) = 1.03, p = 0.3798) at an α level of 0.05 (see table A.11). As a result we cannot reject the null hypothesis that the population means for each condition are equal. Because the results of these one-way ANOVA’s are not statistically significant, no post-hoc tukey testing was required. The group means and standard deviations are displayed in the appendix.
Table 8. One-Way ANOVA For Candidate Rating of Fairness/Impartiality (Question #1), All Respondents
Sum of Squares df Mean Square F Sig (P > F)
Between Groups 3.20 3 1.07 1.55 0.2022
Within Groups 214.94 198 .63
Total 126.89 201 .63
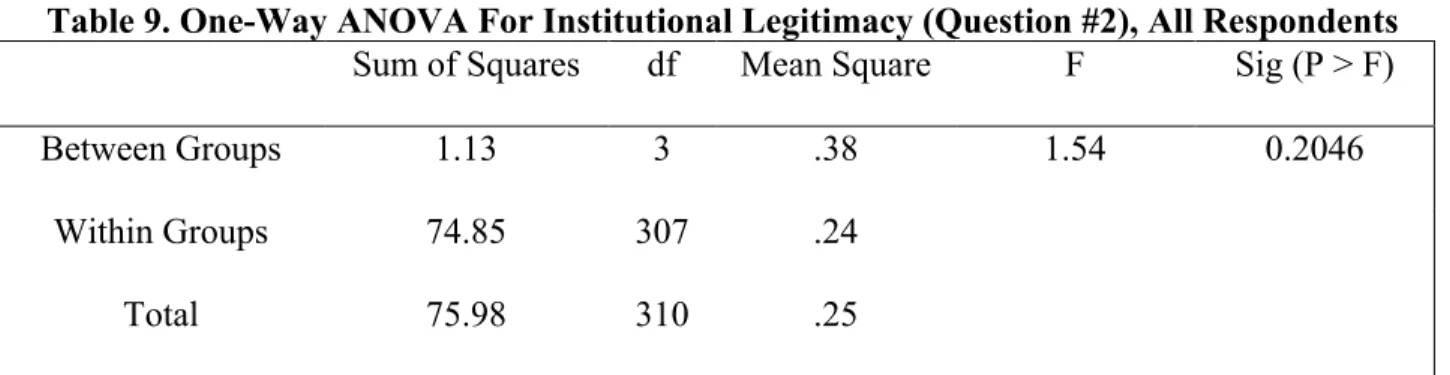
Results for the one-way ANOVA test on question two (Institutional Legitimacy) are
significant difference in ratings of institutional legitimacy between each of the groups as
determined by the one-way ANOVA F(3,198) = 0.90, p = 0.4411) at an α level of 0.05 (see table A.12) As a result we cannot reject the null hypothesis that the population means for each
condition are equal. Because the results of these one-way ANOVA’s are not statistically
significant, no post-hoc tukey testing was required. The group means and standard deviations are displayed in the appendix.
Table 9. One-Way ANOVA For Institutional Legitimacy (Question #2), All Respondents Sum of Squares df Mean Square F Sig (P > F)
Between Groups 1.13 3 .38 1.54 0.2046
Within Groups 74.85 307 .24
Total 75.98 310 .25
Results for the one-way ANOVA test on question three (Likelihood of Accepting Judicial
Decision/Ruling) are displayed below in table 10. There was not a statistically significant
Table 10. One-Way ANOVA For Likelihood of Accepting Decisions as Legitimate (Question #3), All Respondents
Sum of Squares df Mean Square F Sig (P > F)
Between Groups .86 3 .29 0.59 0.6212
Within Groups 149.54 307 .49
Total 150.40 310 .49
To further test my hypothesis I present the following linear model for regression: YI= B0+B1X1 +B2X2 +B3X3+B4X4
Where B0 is a constant, X1is a dummy variable that equals one when the judge is elected, but receives no campaign finance (treatment one), X2 is a dummy variable that equals one when the judge is elected and receives $480k in personally solicited campaign finance (treatment two), X3 is a dummy variable that equals one when the judge is elected and receives $480k in campaign finance from a campaign committee (treatment three), and X4 represents possible covariates. The reference category for multiple regression analysis is the control condition, where the hypothetical judicial candidate is appointed and receives no campaign finance. If my hypothesis is correct, we should see the following:
B1+B0 > B3 +B0 ==B2 +B0 > B0.
The Null and Alternate Hypothesis for multiple regression is listed below. H0: β1 = β2 = ... = βk = 0
Table 11: Effect of treatments on Judicial Legitimacy All Respondents
With Covariates Included in Regression
DV: Judicial Legitimacy Index (3 = No Legitimacy, 12 = High Legitimacy)
Coef. Std. Err. T P-value
Treatment One -.040 .129 -0.31 .756
Treatment Two -.203 .136 -1.49 .137
Treatment Three .118 .137 0.86 .392
SES -.069 .063 -1.09 .278
Race (White = 0)
Female .090 .072 .292 .095 0.31 .76 .757 .450
Ideology -.076 .029 -2.67 **.008
Political Involvement
.028 .030 0.94 .347
SES*Race -.116 .099 -1.17 .244
Constant 11.617 1.05 11.10
N = 306 F(9, 296) = 3.15 Prob > F = .0012 R-Squared =.0596 Note: ** Designates P ≤ 0.01, * Designates P < 0.05
Table 11, above, presents a multiple linear regression to predict judicial legitimacy ratings based upon treatment for all respondents. This table includes covariates in the regression as well as the IV’s. The regression equation found was not significant (F(9,296) = 3.15, p =.0012), with an R2 of .0596 for all respondents. The participants predicted rating of judicial legitimacy is equal to 11.617 - .040 (Treatment One) - .203 (Treatment Two) + .118 (Treatment Three) -.069 (SES) + .090 (Race) + .072 (Female) - .076 (Ideology) + .028 (Political Involvement) -.116 (SES*Race). Treatment One, Two and Three are each dummy variables that take on the value of 1 or 0 based upon the condition. SES is an ordinal variable that ranges from 1 (Upper Class) to 5
(Most Involved) to 15 (Least Involved). SES*Race is an interaction term that multiplies SES by race, ranging from 0 to 5. Ideology was the only statistically significant independent variable, with a significant negative effect on ratings of judicial legitimacy at the α = 0.01 level. This means that the more conservative a respondent is, the less legitimacy they assigned the judiciary.
Table 12: Effect of treatments on Judicial Legitimacy With Covariates Included in Regression
Respondents Who Answered Manipulation Check Correctly
DV: Judicial Legitimacy Index (3 = No Legitimacy, 12 = High Legitimacy)
Coef. Std. Err. T P-value
Treatment One -.199 .310 -0.64 .521
Treatment Two -.525 .324 -1.62 .106
Treatment Three -.222 .320 -0.70 .487
SES -.142 .141 -1.01 .315
Race (White = 0) Female .568 .057 .620 .213 0.36 0.27 .361 .790
Ideology -.079 .064 -1.24 .218
Political Involvement
.007 .066 0.10 .922
SES*Race -.200 .213 -0.94 .349
Constant 11.171 1.04 11.45
N = 201 F(9,191) = 1.12 Prob > F = .3757 R-Squared =.0038 Note: ** Designates P ≤ 0.05, * Designates P < 0.10
covariates or independent variables had a statistically significant effect on mean ratings of judicial legitimacy.
Table 13: Effect of treatments on Judicial Legitimacy No Covariates Included
All Respondents
DV: Judicial Legitimacy Index (3 = No Legitimacy, 12 = High Legitimacy)
Coef. Std. Err. T P-value
Treatment One .096 .261 0.37 .713
Treatment Two -.353 .265 -1.33 .183
Treatment Three .069 .270 0.25 .800
Constant 10.731 .196 54.66 -
N = 310 F(3,307) = 1.37 Prob > F = .2515 R-Squared = 0.0036 Note: * DesignatesP ≤ 0.05
A multiple linear regression was also conducted to predict judicial legitimacy ratings based upon treatment for all respondents, without using covariates. The results of this regression can be found in Table 13, above. The regression equation found was not significant (F(3,307) = 1.37, p =.2515), with an R2 of 0.0036. The participants predicted rating of judicial legitimacy is equal to the equation 11.171 + .096 (Treatment One) - .353 (Treatment Two) + .069 (Treatment Three). None of the conditions had a statistically significant effect on mean ratings of judicial legitimacy.
Table 14, below, presents the results of a multiple linear regression used to predict ratings of judicial legitimacy based upon treatment. This multiple linear regression only includes
mean ratings of judicial legitimacy for respondents who answered the manipulation check correctly.
Table 14: Effect of treatments on Judicial Legitimacy Respondents Who Answered Manipulation Check Correctly
DV: Judicial Legitimacy Index (3 = No Legitimacy, 12 = High Legitimacy)
Coef. Std. Err. T P-value
Treatment One -.190 .309 -0.62 .539
Treatment Two -.482 .304 -1.59 .115
Treatment Three -.314 .306 -1.03 .306
Constant 11.171 .240 46.54 -
N = 202 F(3,198) = .92 Prob > F = .4298 R-Squared = 0.0138 Note: * DesignatesP ≤ 0.05
Tables A.5 through A.16, found in the appendix, display the results of multiple regression analysis on each of the individual questions measured in table 3. Tables A.5 through A.7 display the results of multiple regression analysis without covariates when only including respondents who answered manipulation checks correctly. The second treatment condition ($480,427
personally solicited, elected judge) had a statistically significant (negative) effect on mean ratings of individual candidate legitimacy (question #1 in table 3) at the α level of 0.10. All other
socioeconomic status, which had a statistically significant negative effect on the likelihood that a respondent will accept decision made by the judiciary as legitimate at the α = 0.10 level.
Tables A.8 through A.10 displays the results of multiple regression analysis without covariates including all respondents. All treatment conditions did not have a statistically significant effect on mean ratings of candidate legitimacy, and institutional legitimacy, and likelihood of respondent to accept decisions made by the judiciary. Tables A.14 through A.16 display the results of multiple regression analysis including all respondents with covariates. All treatment conditions remained not statistically significant at the individual question level when controlling for the effects of covariates. The only covariate that had a statistically significant effect on mean ratings was ideology. Ideology had a significant positive effect on mean ratings of candidate impartiality (question #1) at the α = 0.01 level, and a significant negative effect on mean ratings of institutional legitimacy (question #2) at the α = .01 level. This means that the more conservative a respondent is, the higher they rated the judicial candidates impartiality, and the lower they rated the legitimacy of a court made up of members like this candidate.
Because multiple regression analysis found that the treatment did not have a statistically significant effect on ratings of judicial legitimacy, we are not able to reject the null hypothesis that H0: β1 = β2 = ... = βk = 0.
IX. DISCUSSION
campaign committee (u = 10.80), and then the control condition with an appointed judge who received no campaign finance (u = 10.73). The lowest rating of judicial legitimacy was found in treatment condition number three, where the judge was elected and personally solicited $480, 427 (u = 10.38). While this ordering fits partially with our theoretical expectations, the differences in mean ratings of judicial legitimacy between conditions was not statistically significant, and this ordering of ratings has a very high likelihood of occurring due to chance.
This refutes H1: That Survey respondents will rate elected judges and an elected judiciary as more impartial, fair and legitimate than an appointed judge and judiciary. Because the
difference in mean ratings of judicial legitimacy between conditions is not statistically significant, we can’t reject the null hypothesis that the four mean ratings are identical. This flies in the face of extant literature that suggests that elections are legitimacy conferring for the judiciary (Gibson 2009, Gibson 2008). Here, elected judges were not rated as significantly more impartial, fair and legitimate than appointed judges.
Because the data suggests that no relationship exists between campaign finance, judicial elections and judicial legitimacy, the data provides support for H2 -- That survey respondents will rate elected judges who personally solicit campaign finance no differently than elected judges who receive campaign finance through other sources. The difference of means between these two treatment conditions (Condition 2 and Condition 3) was not statistically significant. This does suggest that the source of campaign finance does not affect the way the public views the
ruling will not have the intended effect. Either the Court ought to ban all campaign finance from judicial elections, or they ought to permit all types of campaign finance because the public fails to distinguish between methods of raising campaign finance
In many respects, the results of this study ought to be refreshing for those concerned with the future of the judiciary in the United States. If the concern with judicial elections is that the presence of campaign finance will compromise the perceived impartiality and legitimacy of the courts, this study is particularly comforting. The results of this study indicate that the presence of campaign finance in judicial elections does not compromise perceived impartiality and legitimacy for state courts. Experimental design allows for a great deal of confidence in causal inferences and ensures a high level of internal validity, and these results provide support for the idea that unlike other American political institutions, the Court has a “reservoir of goodwill” which it can use to protect its institutional legitimacy from the negative effects of traditional legitimacy depleting actions (Gibson and Caldeira, 2007).
If, as this study suggests, elections do not confer legitimacy for the judiciary, state courts can use this to their advantage. As discussed earlier, a vast body of research indicates the electoral process compromises judicial decision-making (Bonneau 2007, Huber and Gordon 2004). Judges are more likely to rule in favor of litigants who donated money to their campaigns, and are harsher on crime in election years (Shepherd 2013). If we know that elections actually
suggests that appointing judges will not deplete the reservoir of goodwill the judiciary possesses, instead leading to judges that are actually able to serve impartially.
Further this research challenges scholarly understanding of how the public thinks about judicial legitimacy and impartiality when they are not primed to think about traditionally legitimacy-depleting information. Existing experimental research on judicial legitimacy has involved showing survey respondents attack ads (Gibson 2008, Gibson et. al 2011), or presented an extended vignette about a conflict of interest arises for a judicial official (Gibson 2009). This study, on the other hand, presents only one to two lines in a three-paragraph candidate profile about campaign activity and campaign finance, subtly manipulating the variable of interest to present the more properly contextualized information. This study does directly contrast existing research, finding that campaign finance and campaign activity do not have any significant positive or negative effect on judicial legitimacy and impartiality. It may be the case that when campaign activity and campaign finance are contextualized within the profile of a well-rounded candidate with qualifications and experience, survey respondents no longer over-weight this information about campaign activity when determining candidate impartiality and legitimacy. Research within the discipline ought to investigate this question of salience and judicial legitimacy further. For example, a study in which attack ads, a bio and a speech from the candidate are presented can allow scholars to understand how the salience of particular information affects legitimacy.
uncover a relationship between ideology and institutional legitimacy, finding that ideology had a statistically significant negative effect on the omnibus measure of judicial legitimacy. This finding can add to the body of research on ideology and judicial legitimacy that has often reached conflicting findings. The hypothetical candidate profile presented to survey respondents was devoid of any overtly partisan indicators and stripped of party affiliations. Still, political ideology influenced the way respondents assigned legitimacy to the courts. Further research on how ideology frames the way publics think about political institutions can show if this finding is a harbinger of a fundamental ideological divide, or a mere coincidence. .
IX. FUTURE INQUIRY / CONCLUSIONS
The first limitation of any findings from this study is its confinement to an experimental setting. While utilizing an experimental vignette allows for better control over the influence of exogenous factors that are rife in any actual election, one must question the external validity of results arriving from an experimental setting. The sample of largely 18-22 year old college students enrolled in Poli100 at UNC Chapel Hill is in no way representative of the general electorate, limiting the generalizability of the findings of this study.
manipulation checks incorrectly, the fundamental incentive problem is one that must be considered when analyzing the results of this study.
It is also unclear if the three questions used to measure judicial legitimacy are the best measures of this DV. While these questions and responses were used in previous research (Gibson 2009) to measure judicial legitimacy and perceived impartiality, no measure of test-retest
reliability or internal consistency is provided. It is possible that these questions measure different things. For example, question one (rate your feelings about this candidates ability to serve as a judge in your state) asks about candidate impartiality, rather than institutional legitimacy. On the other hand, question three asks about the NC Supreme Court, directly asking about institutional legitimacy. If these two measurements are of distinct DV’s, they should not be put together to create a single index variable of judicial legitimacy.
While most research within the subfield of judicial legitimacy has made campaign finance and campaigning too salient by priming survey respondents, it is possible that the manipulation of the DV in this study was too subtle to get accurate measures of judicial legitimacy and
Additionally, it is possible that the effects of the manipulation were dampened by the qualifications of this judicial candidate. Justice Mary Yu, whose profile was used for this
hypothetical candidate vignette, has a long list of qualifications, awards and experience that seems to rather clearly qualify them for judicial office. It might be the case that campaign finance and elections only alter judicial legitimacy in the case of less qualified candidates. If this is the case, then this hypothetical candidate was so qualified that the effects of campaign finance and
elections upon legitimacy would not be noticeable. Further research within this subfield would be wise to present the same conditions but across a wider range of qualifications in hypothetical candidate profiles.
A plausible theory that explains the non-significant differences in mean ratings of judicial legitimacy across the treatment conditions comes from the low level of knowledge that the public has about the state judiciary. Research on public understanding of the judiciary has found that the electorate knows alarmingly little about the role of the Supreme Court, let alone state courts (Jamieson and Hennessy 2006). Because the public generally has such a low level of knowledge about the judiciary, it is entirely possible that survey respondents simply were unaware of
alternative methods of selection for justices. For example, a respondent may not know that judges
can be both elected and appointed – and they certainly may not know the different methods, rules
and regulations surrounding campaign finance in judicial elections. This may have led to a status
quo bias for survey respondents. Because no other alternatives were ever listed in the
questionnaire, respondents may have assumed that the information about method of selection and
sources of campaign finance listed in the survey were the only possible options for a state
Supreme Court judge. As a result, they may not have considered whether the method of selection
research within this subfield can more definitely provide an answer to this theory by including
questions about political and judicial knowledge within these survey experiments.
On the other end of the spectrum, exceptionally knowledgeable respondents may have also made assumptions based upon prior knowledge that altered results. Only the fourth vignette makes explicit references to each of the two methods of raising campaign finance in judicial elections. This was done to prevent priming the survey respondent of the issues being measured, and to limit making a particular topic too salient. But, still a knowledgeable respondent may recognize this omission and be forced to make some assumptions about the method of campaign finance not explicitly mentioned. For example, vignette three reads: “This justice is up for re-election this year, and personally solicited $480,427 in campaign contributions. These
contributions came from a variety of sources, including businesses, interest groups and attorneys.” But this vignette makes no mention of the presence of campaign funds raised through a campaign committee. It would not be unreasonable for a knowledgeable respondent to assume that further money was raised through this method, altering their perceived impartiality rating for this candidate. This level of uncertainty could cause variance amongst the survey respondents and cause validity complications.
Finally, the realism of these vignettes may be under some question. For example, condition 2, the first treatment condition, states that the candidate is up for ‘re-election, but receives no campaign finance as it is constitutionally barred in their state”. This treatment condition is valuable because it allows us to isolate the effect, of campaign finance, from the effect of elections. But this treatment is also unrealistic – no state exists where a judge is elected but is barred from receiving any campaign finance. Further, it is quite difficult to isolate the exact source of all campaign finance. It seems unlikely that a candidate would receive $480k in
campaign finance and all of that money be directly identified as the product of personal solicitations. This limits the generalizability and external validity of the results of this study.
In sum, this study provides empirical evidence to begin answering the question that Antonin Scalia asked in Williams-Yulee v. Florida Bar (2015): Does (personally solicited) campaign finance negatively affect judicial legitimacy. The answer, according to this study, is a resounding no. Through experimental survey research with embedded vignettes, this study used One-Way ANOVA and multiple regression tests to find a non-statistically significant relationship between judicial legitimacy and campaign finance. However, these findings are directly in
contrast with most existing scholarship, and questions remain about the external validity and generalizability of this study. To help answer these questions, and better understand the
References
American Judicature Society. 2015 "Methods of Judicial Selection."
http://www.judicialselection.com/
Baird, Vanessa A., and Amy Gangl. 2006. "Shattering the Myth of Legality: The Impact of the
Media’s Framing of Supreme Court Procedures on Perceptions of Fairness." Political
Psychology 27: 597-614.
Ballotpedia "Fundraising for the 2014 Supreme Court Elections." Ballotpedia.
<https://ballotpedia.org/Fundraising_for_the_2014_supreme_court_elections>
Bartels, Brandon L., and Christopher D. Johnston. 2014. “On the Ideological Foundations of Supreme Court Legitimacy in the Mass Public." American Journal of Political Science 57 (1): 184-199.
Benesh, S. C. (2006). Understanding public confidence in American courts. Journal of
Politics, 68(3), 697-707.
Bonneau, Chris. 2007. “The Effects of Campaign Spending in State Supreme Court Elections.” Political Research Quarterly 60 (September): 489-499.
Bonneau, Chris W., and Melinda Gann Hall. 2009. In Defense of Judicial Elections. New York: Routledge.
Breyer, Stephen. 2006 "Judicial independence: remarks by Justice Breyer." Geo. LJ95: 903
Cann, Damon M. 2007. “Justice for Sale? Campaign Contributions and Judicial Decisionmaking.” State Politics and Policy Quarterly 7 (Fall): 281-297.
Epps, Garrett. "A Campaign-Finance Victory That Is Less Than It Seems." The Atlantic. 2015.
Geyh, Charles Gardner. 2008. “Methods of Judicial Selection and Their Impact on Judicial Independence.” Daedalus 137: 86-101.
Geyh, Charles Gardner. 2003. "Why judicial elections stink." Ohio St. LJ 64: 43.
Gibson, James L., and Gregory A. Caldeira. 2013. "Judicial Impartiality, Campaign
Contributions, and Recusals: Results from a National Survey." Journal of Empirical Legal
Studies 10.1: 76-103.
Gibson, James L., and Gregory A. Caldeira. 2009a. “Confirmation Politics and the Legitimacy of the U.S. Supreme Court: Institutional Loyalty, Positivity Bias, and the Alito Nomination.” American Journal of Political Science 53: 139–55
Gibson, James L., and Michael J. Nelson. 2015. "Is the US Supreme Court's legitimacy grounded
in performance satisfaction and ideology?." American Journal of Political Science 59L
162-174.
Gibson, James L., et al. 2010. "The effects of judicial campaign activity on the legitimacy of
courts: A survey-based experiment." Political Research Quarterly: 1065912910370684.
Gibson, James L. 2008. "Challenges to the impartiality of state supreme courts: Legitimacy theory
and “new-style” judicial campaigns." American Political Science Review 102.01: 59-75.
Hamilton, Alexander. 1788 "Federalist 78: The Judicial Department." The Independent Journal
[New York, NY]
Huber, Gregory, and Sanford C. Gordon. 2004. "Accountability and coercion: Is justice blind
when it runs for office?." American Journal of Political Science 48.2: 247-263.
In re Raab, 100 N.Y.2d 305, 315-316, 763 N.Y.S.2d 213, 218 (2003).
Jamieson, Kathleen Hall, and Michael Hennessy. 2006. "Public understanding of and support for
Klerman, Daniel M. 2006. "Legal Infrastructure, Judicial Independence, and Economic
Development." Pac. McGeorge Global Bus. & Dev. LJ 19: 427
Melton, James, and Tom Ginsburg. 2014. "Does De Jure judicial independence really matter? A
reevaluation of explanations for judicial independence." Working Paper.
<http://chicagounbound.uchicago.edu/law_and_economics/179/>
O'Brien, Reity. 2015. U.S. Supreme Court to Rule on Judicial Campaign Contributions. Center
for Public Integrity.
O’Connor, Sandra Day. 2010. Keynote Address, 33 SEATTLE U. L. REV. 559
Persily, Nathaniel, and Kelli Lammie. 2004. "Perceptions of corruption and campaign finance:
When public opinion determines constitutional law." University of Pennsylvania Law
Review: 119-180.
Shepherd, Joanna. 2013. Justice at Risk. Washington, DC: American Constitutional Society.
<http://www.acslaw.org/ACS%20Justice%20at%20Risk%20(FINAL)%206_10_13.pdf>
Voting For Judges "Mary Yu." <http://votingforjudges.org/16gen/supreme/1my.html>
Appendix I – Data and Tables
A.1 Judicial Legitimacy (Index) Rating By Conditions, Manipulation Check Correct Condition Mean (3-‐12) Std. Dev N
$0, Appointed 11.17 .92 35
$0, Elected 10.98 1.58 53
$480,427 personally solicited,
elected 10.69 1.58 58
$480,427 through committee,
elected 10.86 1.34 56
Total 10.90 -‐ 202
A.2 Ratings of Candidate Impartiality By Conditions, Manipulation Check Correct Condition Mean (1-‐5) Std. Dev N
$0, Appointed 4.83 .38 35
$0, Elected 4.60 .88 53
$480,427 personally solicited,
elected 4.53 .94 58
$480,427 through committee,
elected 4.64 .72 56
Total 4.63 -‐ 202
A.3 Likelihood of Accepting Decisions By Conditions, Manipulation Check Correct Condition Mean (1-‐3) Std. Dev N
$0, Appointed 2.77 .43 35
$0, Elected 2.75 .43 53
$480,427 personally solicited,
elected 2.67 .51 58
$480,427 through committee,
elected 2.76 .47 56
A.4 Institutional Legitimacy By Conditions, Manipulation Check Correct Condition Mean (1-‐4) Std. Dev N
$0, Appointed 3.57 .56 35
$0, Elected 3.62 .63 53
$480,427 personally solicited,
elected 3.48 .60 58
$480,427 through committee,
elected 3.44 .66 56
Total 3.52 -‐ 202
Table A.5: Multiple Regression: Condition & Candidate Impartiality Manipulation Check Correct
Effect of treatments on Candidate Impartiality
DV: Candidate Impartiality (1 = Not Very Fair, Not Impartial, 5 = Very Fair, Impartial)
Coef. Std. Err. T P-value
Treatment One -.225 .173 -1.30 .195
Treatment Two -.294 .170 -1.73 *.085
Treatment Three -.186 .171 -1.09 .279
Constant 4.828 .134 35.96 -
N = 202 F(3,198) = 1.03 Prob > F = .3798 R-Squared = 0.0154 Note: ** DesignatesP ≤ 0.05, * Designates P < 0.10
Table A.6: Multiple Regression: Condition & Likelihood of Accepting Decision Manipulation Check Correct
Effect of treatments on Likelihood of Accepting Decision
DV: Likelihood of Accepting Decision (1 = Not Very Likely, 3 = Very Likely)
Coef. Std. Err. T P-value
Treatment One -.016 .101 -0.17 .869
Treatment Two -.099 .099 -1.00 .321
Treatment Three -.004 .100 -0.04 .972
Constant 2.771 .0785 35.29 -
Table A.7: Multiple Regression: Condition & Institutional Legitimacy Manipulation Check Correct
Effect of treatments on Institutional Legitimacy
DV: Institutional Legitimacy (1 = Not Very Legitimate, 4 = Very Legitimate)
Coef. Std. Err. T P-value
Treatment One -.051 .134 0.38 .703
Treatment Two -.088 .132 -0.67 .503
Treatment Three -.125 .133 -0.94 .348
Constant 3.571 .104 34.25 -
N = 202 F(3,198) = 0.90 Prob > F = .4411 R-Squared = 0.0135 Note: * DesignatesP ≤ 0.05
Table A.8: Multiple Regression: Condition & Candidate Impartiality All Respondents
Effect of treatments on Candidate Impartiality
DV: Candidate Impartiality (1 = Not Very Fair, Not Impartial, 5 = Very Fair, Impartial)
Coef. Std. Err. T P-value
Treatment One -.037 .135 -0.28 .783
Treatment Two -.222 .137 -1.62 .106
Treatment Three .041 .140 0.30 .767
Constant 4.61 .101 45.46 -
N = 311 F(3,198) = 1.55 Prob > F = .2022 R-Squared = 0.0149 Note: * DesignatesP ≤ 0.05
Table A.9: Multiple Regression: Condition & Likelihood of Accepting Decision All Respondents
Effect of treatments on Likelihood of Accepting Decision
DV: Likelihood of Accepting Decision (1 = Not Very Likely, 3 = Very Likely)
Coef. Std. Err. T P-value
Treatment One .034 .080 0.43 .671
Treatment Two -.104 .081 -1.28 .202
Treatment Three .045 .083 0.54 .587
Constant 2.70 .060 44.78 -
Table A.10: Multiple Regression: Condition & Institutional Legitimacy All Respondents
Effect of treatments on Institutional Legitimacy
DV: Institutional Legitimacy (1 = Not Very Legitimate, 4 = Very Legitimate)
Coef. Std. Err. T P-value
Treatment One .099 .113 0.88 .382
Treatment Two -.028 .114 -0.24 .819
Treatment Three -.018 .117 -0.15 .879
Constant 3.42 .085 40.09 -
N = 311 F(3,307) = 0.59 Prob > F = .6212 R-Squared = 0.0057
Note: * DesignatesP ≤ 0.05
Table A.11: Multiple Regression: Condition & Candidate Impartiality Manipulation Check Correct
Effect of treatments on Candidate Impartiality With Covariates Included in Regression
DV: Candidate Impartiality (1 = Not Very Fair, Not Impartial, 5 = Very Fair, Impartial)
Coef. Std. Err. T P-value
Treatment One -.237 .164 -1.44 .151
Treatment Two -.324 .172 -1.89 *.061
Treatment Three -.112 .170 -0.66 .443
SES -.072 .055 -0.96 .340
Race
Female .410 .130 .200 .110 1.25 1.15 .214 .252
Ideology -.056 .034 -1.64 .102
SES*Race -.160 .113 -1.41 .159
Political
Involvement .011 .036 0.32 .751
Constant 4.86 .555 8.76
N = 201 F(9,191) = 1.90 Prob > F = .0536 R-Squared =.0823
Table A.12: Multiple Regression Condition & Likelihood of Accepting Decision Effect of Treatments on Candidate Impartiality
Manipulation Check Correct With Covariates Included in Regression
DV: Likelihood of Accepting Decision (1 = Not Very Likely, 3 = Very Likely)
Coef. Std. Err. T P-value
Treatment One -.001 .104 0.01 .992
Treatment Two -.083 .108 -0.77 .444
Treatment Three -.027 .106 0.25 .801
SES -.079 .047 -1.88 *.097
Race Female -.144 -.082 .207 .071 -1.67 -1.18 .487 .250
Ideology -.015 .021 -0.57 .566
SES*Race .037 .071 0.52 .601
Political
Involvement .016 .022 0.73 .469
Constant 2.927 .3496 8.337
N = 201 F(9,191) = 0.84 Prob > F = .5774 R-Squared =.0382
Note: * DesignatesP ≤ 0.10 ** DesignatesP ≤ 0.05 *** DesignatesP ≤ 0.01
Table A.13 Multiple Regression Condition & Institutional Legitimacy Effect of Treatments on Institutional Legitimacy
Manipulation Check Correct With Covariates Included in Regression
DV: Institutional Legitimacy (1 = Not Very Legitimate, 4 = Very Legitimate)
Coef. Std. Err. T P-value
Treatment One .037 .138 0.27 .789
Treatment Two -.118 .143 -0.82 .416
Treatment Three -.137 .143 -0.96 .339
SES .008 .063 0.13 .898
Race Female .302 .009 .278 .093 1.09 0.10 .277 .922
Ideology -.011 .029 -0.39 .698
SES*Race -.077 .095 -0.81 .418
Political
Involvement -.019 .030 -0.62 .537
Constant 3.825 .468 8.17
F(9,191) = 0.52 Prob > F = .8556 R-Squared =.0241
Table A.14: Multiple Regression: Condition & Candidate Impartiality All Respondents
Effect of treatments on Candidate Impartiality With Covariates Included in Regression
DV: Candidate Impartiality (1 = Not Very Fair, Not Impartial, 5 = Very Fair, Impartial)
Coef. Std. Err. T P-value
Treatment One -.040 .129 -0.31 .756
Treatment Two -.203 .136 -1.49 .137
Treatment Three .118 .137 0.86 .392
SES -.069 .063 -1.09 .278
Race Female .090 .072 .292 .095 0.31 0.76 .757 .450
Ideology .028 .029 -2.67 **.008
Political
Involvement .028 .030 0.94 .347
SES*Race -.116 .099 -1.17 .244
Constant 4.624 .476 9.70
N = 306 F(9, 296) = 3.15 Prob > F = .0012 R-Squared =.0087
Note: * DesignatesP ≤ 0.05 ** DesignatesP ≤ 0.01
Table A.15: Multiple Regression Condition & Likelihood of Accepting Decision All Respondents
Effect of Treatments on Candidate Impartiality With Covariates Included in Regression
DV: Likelihood of Accepting Decision (1 = Not Very Likely, 3 = Very Likely)
Coef. Std. Err. T P-value
Treatment One .037 .081 0.45 .652
Treatment Two -.076 .085 -0.89 .375
Treatment Three .072 .086 0.93 .406
SES -.050 .040 -1.25 .211
Race Female -.258 -.086 .183 .059 -1.41 -1.45 .159 .148
Ideology -.020 .018 -1.09 .276
Political
Involvement .022 .019 1.18 .241
Constant 2.77 .299 9.27 N = 306
F(9,296) = 1.66 Prob > F = .0984 R-Squared =.0480
Note: * DesignatesP ≤ 0.05 ** DesignatesP ≤ 0.01
Table A.16: Multiple Regression Condition & Institutional Legitimacy All Respondents
Effect of treatments on Institutional Legitimacy With Covariates Included in Regression
DV: Institutional Legitimacy (1 = Not Very Legitimate, 4 = Very Legitimate)
Coef. Std. Err. T P-value
Treatment One .091 .115 0.79 .429
Treatment Two -.033 .122 -0.27 .788
Treatment Three -.016 .122 -0.13 .896
SES .031 .057 0.55 .582
Race Female .192 .005 .261 .085 0.74 0.05 .462 .957
Ideology -.055 .025 -2.17 **.031
Political
Involvement .019 .026 -0.04 .967
SES*Race -.095 .089 -1.07 .287
Constant 3.54 .426 8.32
N = 306 F(9,296) = 0.89 Prob > F = .5320 R-Squared =.0264
Note: * Designates P ≤ 0.05 ** Designates P ≤ 0.01
Table A.17 One-Way ANOVA For Candidate Rating of Fairness/Impartiality (Question #1) Manipulation Check Correct
Sum of Squares df Mean Square F Sig (P > F)
Between Groups 1.95 3 .65 1.03 0.3798
Within Groups 124.94 198 .63
Total 126.89 201 .63
Table A.18 One-Way ANOVA For Institutional Legitimacy (Question #2) Manipulation Check Correct
Sum of Squares df Mean Square F Sig (P > F)
Between Groups 1.03 3 .34 0.90 0.4411
Within Groups 75.35 198 .38
Total 76.38 201 .38
Table A.19. One-Way ANOVA For Likelihood of Accepting Decisions as Legitimate (Question #3)
Manipulation Check Correct
Sum of Squares df Mean Square F Sig (P > F)
Between Groups .35 3 .12 0.55 0.6517
Within Groups 42.74 198 .22
Figure II – Mean Judicial Legitimacy Ratings By Condition, Respondents Who Answered Manipulation Check Correctly
Appendix II – Vignettes
Condition 3 (Treatment Group 2) - Elected Justice, Personal Solicitation of $480,427 In
Condition 4 (Treatment Group 3) - Elected Justice, Campaign Committee Raised $480,427 in