OPTIMIZATION OF AMBIENT IONIZATION MASS SPECTROMETRIC METHODS TO DETECT LOW CONCENTRATIONS OF COMMON AGRICULTURAL CHEMICALS,
ATRAZINE AND S-METOLACHLOR By
Sneha Gadi
Honors Thesis Department of Chemistry University of North Carolina
April 25, 2014
Approved:
________________________________
Optimization of Ambient Ionization Mass Spectrometric Methods to Detect Low Concentrations of Common Agricultural Chemicals, Atrazine and S-metolachlor
Gadi, S. Reeber, S. Glish, G.
Abstract
Methods of ambient ionization mass spectrometry such as paper spray ionization (PSI) and low-temperature plasma ionization (LTPI) allow for real-time analysis of crude samples that require virtually no prior preparation.[1][2][3] Although extensive optimization is necessary in order to achieve accurate and reliable results, the ease of analysis coupled with the quality of attained results make ambient ionization techniques such as PSI and LTPI valuable.[1][3][4] One important application of such methods is the detection and analysis of common pesticides and herbicides, which are routinely monitored for regulatory and environmental protection purposes. This paper aims to focus especially on one particular herbicide, atrazine, which is of specific interest due to contamination effects and its resilience in environmental systems.[5] PSI of atrazine proved to be effective, with sufficient optimization resulting in reduction of background signal and detection of concentrations in the nanogram range. Deuterated atrazine was used as an internal standard to develop a quantitative method for the measurement of atrazine. The herbicide metolachlor was also analyzed via PSI and showed reliable signal with minimal noise down to the picogram range. LTPI of metolachlor showed similar promising results but was not as successful in low-concentration samples due to high levels of noise and quick sample depletion.
Introduction
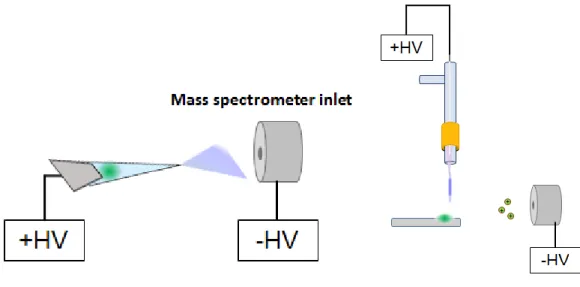
analysis time.[1] Paper spray ionization and low-temperature plasma ionization are two recent advances that have allowed for quick and accurate analysis of crude samples, which were more cumbersome to characterize prior to the development of these methods due to long preparation and analysis time.[4] Samples for PSI and LTPI are prepared as solutions and dried on either paper or a metal plate, from which gas phase ions are produced by an external applied voltage and a low-temperature plasma generated from a designated probe respectively.[3][4] These gas phase ions travel to the inlet of the mass spectrometer where they are subsequently collected and analyzed. A schematic diagram of the ion flows in PSI and LTPI is shown in Figure 1.
Figure 1. On left, the schematic diagram of the gas phase ion flow in PSI is shown. On right, the schematic diagram of the gas phase ion flow in LTPI is shown.
These methods have previously been applied to numerous environmental and biological samples.[3][4] In this paper, atrazine, a widely used herbicide that is of concern due to its
persistence in aquatic and terrestrial ecosystems as well its contamination of groundwater with potentially harmful effects to humans with long-term exposure, was investigated.[6] The
mg/L).[10] Deuterated atrazine was also studied for its use in quantitative experiments as an isotopically labeled internal standard for detecting atrazine levels.[7] The herbicide metolachlor, a common pesticide which draws environmental scrutiny for groundwater contamination was also investigated.[8] Although there are no set maximum contaminant level goals for human drinking water, the US EPA standard for maximum human consumption of metolachlor is 0.15 mg/kg/day and the health advisory level for drinking water is 0.525 mg/L.[11]
Methods
For PSI analysis, samples of atrazine, mix of atrazine and deuterated atrazine or s-metolachlor of varying volumes and concentrations (1-100 µL, 25-50 µM or 1-100 ppm) were deposited and dried on circular sample areas on Whatman #903 dried blood spot collection paper. Triangular strips were then cut from the circles with height and base width of 1 cm that were washed three times with Optima-grade methanol. Initially, an alligator clip sample holder was used to hold the strip. However, a custom metal plate sample holder was created in order to improve the
consistency of the obtained spectra. A new rectangular strip with a triangular end was also employed. The sample holder was placed so that the tip of the paper was approximately 0.5 cm from the inlet of the mass spectrometer. It was connected to an external voltage supply of + 0-5 kV which was set to 3.5 kV (unless otherwise stated). Paper strips were initially wetted
immediately manually with 50 µL of various solvents (most commonly 99/1 methanol/glacial acetic acid) and allowed to automatically get replenished by a 0.5-mL syringe pump dispensing the solvent at 1200 µL/hour (unless otherwise stated) connected to the sample holder.
deposited and dried. An LTPI probe was connected to an external voltage supply of +0-5 kV set to 3.5 kV (unless otherwise stated) and used to generate low-temperature plasma that would ionize the sample.
All experiments were run on a Bruker Esquire HCT ion trap mass spectrometer.
Results
Solvent selection for atrazine detection in PSI
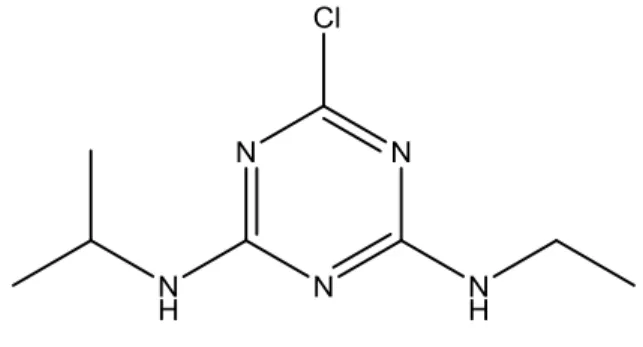
The preliminary step in the investigation of atrazine (Figure 2; MW of 215.68 g/mol) was the determination of the solvent that resulted in the most consistent and accurate spectra. Based on the solubility properties of atrazine four solvents were tested: methanol, ethanol, isopropanol, and acetonitrile, each with 1% glacial acetic acid added to enhance protonation.
Figure 2. The structure of atrazine observed at 216 m/z when protonated.
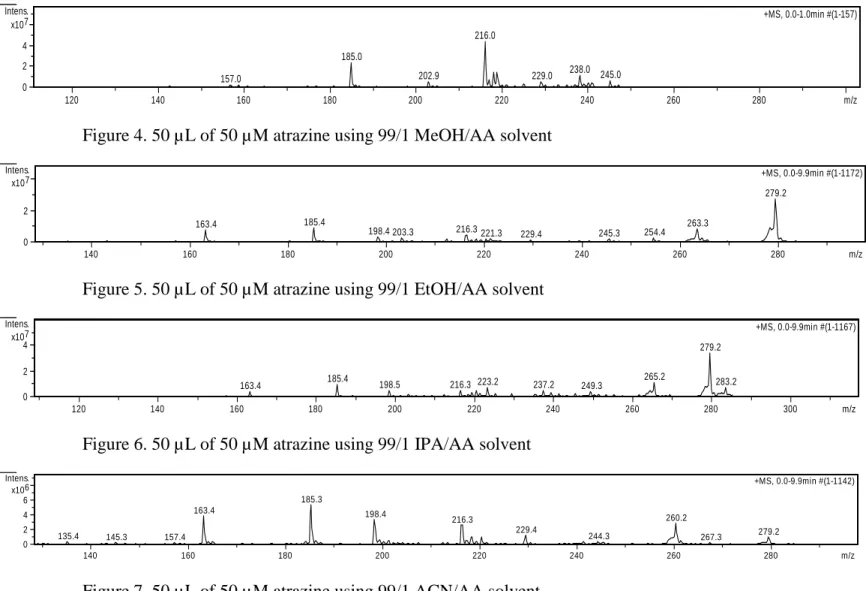
In order to test the solvents, a sample of atrazine dissolved in ethanol and diluted to 50 µM was prepared. Fifty microliters of the 50 µM sample were deposited on the strips and allowed to dry completely. Immediately prior to application of the voltage, 50 µL of the solvent were deposited on the strip and the experiment was started. A flow rate of 800 µL/hr to replenish the solvent and 2 kV applied to the sample holder were used in these experiments. Results attained are displayed in Figures 4-7. The peak observed at 216 m/z represents protonated atrazine.
Figure 4. 50 µL of 50 µM atrazine using 99/1 MeOH/AA solvent
Figure 5. 50 µL of 50 µM atrazine using 99/1 EtOH/AA solvent
Figure 6. 50 µL of 50 µM atrazine using 99/1 IPA/AA solvent
Figure 7. 50 µL of 50 µM atrazine using 99/1 ACN/AA solvent. 157.0
185.0
202.9
216.0
229.0 238.0 245.0
+MS, 0.0-1.0min #(1-157)
0 2 4 7 x10 Intens.
120 140 160 180 200 220 240 260 280 m/z
163.4 185.4
198.4 203.3 216.3 221.3 229.4 245.3 254.4 263.3
279.2
+MS, 0.0-9.9min #(1-1172)
0 2 7 x10 Intens.
140 160 180 200 220 240 260 280 m/z
163.4 185.4 198.5 216.3 223.2 237.2 249.3 265.2
279.2 283.2
+MS, 0.0-9.9min #(1-1167)
0 2 4 7 x10 Intens.
120 140 160 180 200 220 240 260 280 300 m/z
135.4 145.3 157.4
163.4 185.3 198.4 216.3 229.4 244.3 260.2 267.3 279.2
+MS, 0.0-9.9min #(1-1142)
0 2 4 6 6 x10 Intens.
Instrument parameter optimization
After determination of methanol as the solvent of choice, instrument parameters were
extensively optimized for the compound of interest and saved as methods for continued later use. Trap drive voltage, the voltage set on the mass spectrometer ion trap, was shown to be an
important factor that affected the sensitivity and quality of the spectra obtained and
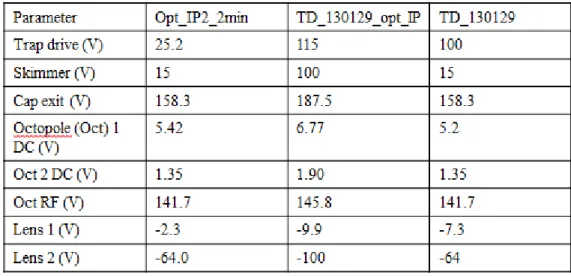
experimentation was done in order to find the optimum range. The values of the parameters for three of the most used methods are displayed below in Table 1. Of the three, method TD_130129 was initially the most commonly used.
Table 1. The values of the parameters constituting the most used methods to detect atrazine.
Low concentration samples of atrazine in varying matrices
Figure 8. 50 µL of 1 µM atrazine in tap water using 99/1 MeOH/AA, 3 kV and 1000 uL/hr
Figure 9. 50 µL of 1 nM atrazine in tap water using 99/1 MeOH/AA, 3 kV and 1000 uL/hr
Deuterated atrazine sampling
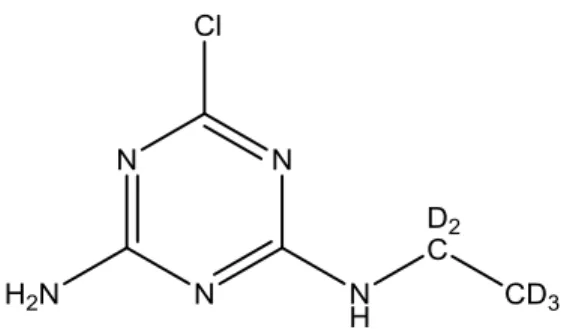
In conjuction with low concentrations of atrazine, deuterated atrazine (atrazine_D5) displayed in Figure 10 was also studied as an internal standard for detecting low levels of atrazine in crude samples such as groundwater or soil. Higher concentrations of deuterated atrazine were run to characterize the analyte prior to lower concentrations. Figure 12-14 below show the spectra obtained of 50 µL of 50 µM deuterated atrazine in MeOH using 99/1 MeOH/AA, 3 kV, and a flow rate of 1000 µL/hr.
Figure 10. The structure of deuterated atrazine observed at 221 m/z.
104.9
109.0 117.0
135.0 148.9
154.9 162.9
166.9 173.9 198.0 204.9 210.9
215.9
222.9 241.0
+MS, 0.2-2.0min #(8-101)
0.0 0.5 1.0 4 x10 Intens.
100 120 140 160 180 200 220 240 260 m/z
122.9 134.9
148.8 154.9
162.8
173.8 197.9 210.9 215.8 238.9
+MS, 0.0-2.0min #(2-177)
0 2 5 x10 Intens.
Figure 11. The structure of the most common fragmentation ion of deuterated atrazine observed at 179 m/z.
Figure 12. 50 µL of 50 µM deuterated atrazine in MeOH using 99/1 MeOH/AA, 3 kV, 1000 µL/hr. 216 m/z is also observed indicating some undeuterated atrazine in the sample.
Figure 13. MS/MS spectrum of protonated atrazine (216 m/z) with isolation width of 1.00 and fragmentation voltage of 0.90 V.
104.9 135.0 148.9 162.9 178.9
220.9
+MS, 0.0-2.0min #(1-182)
0 1 6 x10 Intens.
100 150 200 250 300 350 400 m/z
173.9
215.9
+MS2(216.0), 0.1-1.0min #(1-25)
0 2 4 x10 Intens.
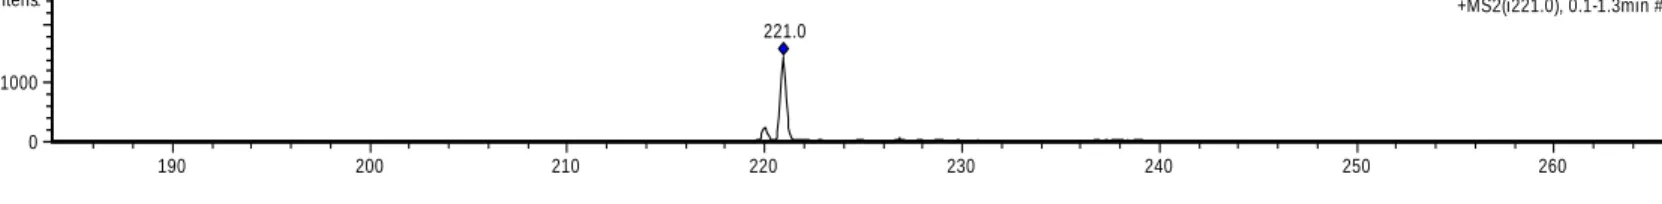
Figure 14. MS/MS spectrum of atrazine_D5 (221 m/z) with isolation width of 1.00 and fragmentation voltage of 0.90 V.
Optimization of the sample holder in PSI and re-optimization of instrument parameters
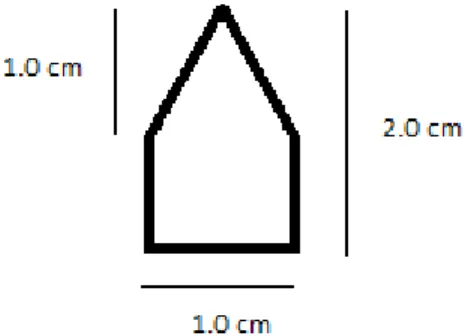
The relative instability and inconsistency of the alligator clip sample holder resulted in the creation of a new custom metal plate holder displayed in Figure 15. Strips were clasped between two metal plates on the top and bottom and secured with a paperclip so that their position
remained constant. The bottom plate was held in place with a metal screw to which external voltage was applied during experimentation. The top plate was free to move and bore down on the strip once it was in place. To replace an old strip, the paperclip was removed and the top plate was carefully set aside. A new strip was placed along the back edge of the bottom plate and the top plate was again secured with the paper plate. The shape of the strip was also changed. Shown in Figure 15, strips measured 2 cm total in height with 1 cm from the tip to the base of the triangle, and 1 cm in width.
178.9
220.9
+MS2(221.0), 0.1-0.9min #(1-26)
0 2 4 4 x10 Intens.
Figure 15. The custom metal plate sample holder created for paper spray analysis. Strips were placed against the flat back and clasped down with the removable top plate.
Figure 16. The hybrid rectangular-triangular paper strip shape used for the custom metal plate sample holder.
Table 2. The values of the parameters of the standard method for atrazine analysis using the new sample holder.
Detection of trace atrazine and deuterated atrazine levels
With re-optimization resulting in better quality spectra, lower concentrations of atrazine and deuterated atrazine were tested. Figures 17-22 below illustrate 1 µL of 10 ppm each atrazine and atrazine_D5 solution diluted in MeOH, and 5 µL of 1 ppm each atrazine and atrazine_D5 solution diluted in MeOH.
Figure 17. 1 µL of 10 ppm atrazine/atrazine_D5 in MeOH using 99/1 MeOH/AA, 3.5 kV, 1200 µL/hr.
175.2 191.1 203.2 216.2
219.1 221.1
229.1232.0 236.9
240.9 250.9 261.0
+MS, 0.0-2.0min #(2-155)
0 2 5 x10 Intens.
Figure 18. Isolation spectrum of protonated atrazine (216 m/z) with isolation width of 3.00.
Figure 19 Isolation spectrum of D5 atrazine (221 m/z) with isolation width of 3.00.
Figure 20. 5 µL of 1 ppm atrazine/D5 atrazine in MeOH using 99/1 MeOH/AA, 3.5 kV, 1200 µL/hr. Low signal intensity of 2300 counts is observed with protonated atrazine.
Figure 21. Isolation spectrum of protonated atrazine (216 m/z) with isolation width of 3.00 resulting in background peak of 215 m/z.
215.9
+MS2(i216.0), 0.0-0.7min #(1-22)
0 2000 4000 6000 Intens.
160 180 200 220 240 260 m/z
221.0
+MS2(i221.0), 0.0-0.5min #(1-15)
0 2000 4000 Intens.
160 180 200 220 240 260 m/z
191.2 199.2 203.2 217.2 219.1 221.1 233.1 236.9 240.9 250.9 262.9 +MS, 0.0-3.0min #(1-225)
0 1 5 x10 Intens.
190 200 210 220 230 240 250 260 m/z
215.0
+MS2(i216.0), 0.1-0.3min #(1-7)
0 1000 2000 Intens.
Figure 22. Isolation spectrum of D5 atrazine (221 m/z) with isolation width of 3.00.
Other agrochemicals: s-metolachlor
Metolachlor (Figure 23; MW of 283.79 g/mol) is a commonly used herbicide due to its high effectiveness but has come under scrutiny due to its resilient nature in environmental systems, with concentrations of up to 5 ppb detected in ground water, making low-concentration detection of this compound important.[9] The active stereoisomer s-metolachlor, depicted below in Figure 23, was analyzed via both PSI and LTPI mass spectrometry and 1 µL of 1ppm was detected in PSI while 100 µL of 10 ppm was detected in LTPI. In PSI, samples of s-metolachlor were deposited onto the strip and allowed to dry completely prior to the application of 50 uL of solvent. A voltage of 3.5 kV and flow rate of 1200 µL/hr were used, with data collected using two different methods: S-metolahclor was first analyzed using the standard method optimized for atrazine, and then using a method optimized for s-metolachlor, the parameters of which are observed below in Table 3. Two solvents were tested, 99/1 MeOH/AA as well as 99/1 ACN/AA.
221.0
+MS2(i221.0), 0.1-1.3min #(1-38)
0 1000 Intens.
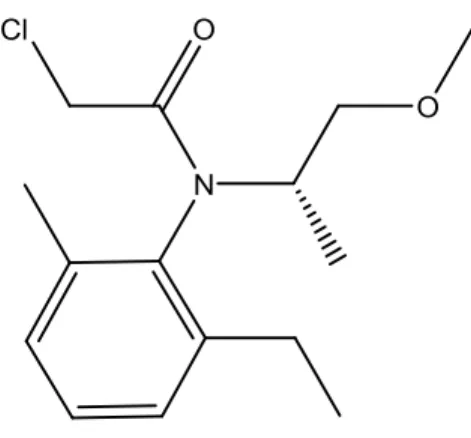
Figure 23. The structure of s-metolachlor observed at 284 m/z when protonated.
The most common fragmentation ion for s-metolachlor is observed at 252 m/z, which is likely a loss of methanol.
Table 3. The values of the parameters of the method optimized for s-metolachlor.
Figure 24. 1 µL of 1 ppm s-metolachlor in MeOH using 99/1 MeOH/AA, 3.5 kV, 1200 µL/hr and method 130810_NH_OPT-3.
241.0 247.0 251.0 255.1 265.0 269.1
279.0
287.0289.1 293.0 297.0299.1 305.1 313.0315.0
+MS, 0.0-5.0min #(1-413)
0 2 4 4 x10 Intens.
Figure 25. Isolation spectrum of 1 µL of 1 ppm s-metolachlor in MeOH with isolation width of 3.00. Isolation was done on 287 m/z in order to correct an instrument calibration offset of 3 m/z.
Figure 26. MS/MS of s-metolachlor (284 m/z) showing primary daughter ion 252 m/z using isolation width of 3.00 and fragmentation voltage of 1.00 V.
Figure 27. 1 µL of 1 ppm s-metolachlor in MeOH using 99/1 AcN/AA, 3.5 kV, 1200 µL/hr and method s-metolachlor_OPT-3_131016.
Figure 28. Isolation spectrum of 1 µL of 1 ppm s-metolachlor in MeOH with isolation width of 3.00.
284.0
+MS2(i284.6), 0.1-0.8min #(1-26)
0 2000 4000 Intens.
240 250 260 270 280 290 300 310 m/z
251.9
268.8
284.1
298.8 301.8
+MS2(284.6), 0.1-0.4min #(1-12)
0 2000 Intens.
240 250 260 270 280 290 300 310 m/z
241.3 247.3 251.3 255.3 260.2 269.2271.3 275.3
279.3
287.3
293.3 297.3 301.2303.3 307.2 313.2
+MS, 0.0-3.0min #(1-237)
0 2 5 x10 Intens.
240 250 260 270 280 290 300 310 m/z
284.2
+MS2(i284.0), 0.0-3.0min #(1-156)
0.0 0.5 4 x10 Intens.
Figure 29. MS/MS of s-metolachlor (284 m/z) showing primary daughter ion 252 m/z using isolation width of 3.00 and fragmentation voltage of 1.00 V.
In LTPI, 100 µL of 10 ppm s-metolachlor in MeOH were deposited onto the tip of a metal plate and allowed to dry completely prior to ionization via plasma. A voltage of 2 kV applied to the LTPI probe and a helium flow rate of approximately 2.01 L/min were used in order to generate the plasma that ionizes the sample. A peak at 284 m/z representing s-metolachlor is observed. Low-mass noise was prominent in most data collected using LTPI.
Figure 30. 100 µL of 10 ppm s-metolachlor in MeOH.
Figure 31. Isolation spectrum of 100 µL of 10 ppm s-metolachlor in MeOH with isolation width of 3.00.
247.2 252.1
266.2
284.3
+MS3(i284.0->284.1), 0.0-2.3min #(1-82)
0 500 1000 Intens.
240 250 260 270 280 290 300 310 m/z
150.9 162.9168.9 191.0 208.0 216.9222.9 231.0
284.0
298.0304.1 313.0 329.9 363.1 374.1 +MS, 0.0-0.9min #(1-62)
0 2 4 4 x10 Intens.
150 175 200 225 250 275 300 325 350 375 m/z
283.9
+MS2(i284.0), 0.0-5.0min #(1-181)
0 2 4 x10 Intens.
Figure 32. MS/MS of s-metolachlor (284 m/z) showing primary daughter ion 252 m/z using isolation width of 3.00 and fragmentation voltage of 1.00 V.
Discussion
Solvent selection for atrazine detection in PSI
Preliminary optimization for PSI of atrazine was done with the selection of the solvent in which to dissolve the sample as well as the solvent used for experimentation. Analysis of 50 µL of 50 µM atrazine with four different solvents (methanol, ethanol, isopropanol, and acetonitrile, each with 1% glacial acetic acid added to enhance protonation) showed 5•107 signal intensity (Figure 3) of protonated atrazine (216 m/z) in methanol, 5•106 signal intensity (Figure 4) in ethanol, 4•106
signal intensity (Figure 5) in isopropanol, and 2•106 signal intensity (Figure 6) in acetonitrile. The peak resolution of 216 m/z as well as background signal was also improved with methanol and spectra obtained were more consistent, further making 99/1MeOH/AA the more optimal solvent for analysis. Fragmentation of atrazine primarily produced a daughter ion at 174 m/z, which was determined to be a loss of C3H6 leaving behind an amine group in the meta position to the chlorine on the ring structure, as shown in Figure 7.
Instrument parameter optimization
Instrument parameters also had to be optimized in order to generate the best spectra. A target mass of 216 m/z was set and extensive optimization was performed with several methods tested and saved for continued later use. Optimization for each instrument parameter was done both
251.9 283.9
+MS2(284.0), 0.1-4.9min #(1-146)
0.0 0.5 4 x10 Intens.
manually and automatically, with automatically derived settings being more effective. Trap drive voltage proved to be a significant factor that affected the quality of the spectra produced.
Methods with high trap drive voltage (100 V, 80 V) were compared with those of lower trap drive voltage (30 V, 40 V). Higher trap drive voltages were shown to reduce background signal and low-mass noise in the full spectra; however, lower trap drive voltages were preferred during MS/MS analysis because signal intensity was preserved. This observation is due to the fact that high trap drive voltage decreases low-mass noise by ejecting low-mass ions, but the higher energy induces fragmentation of the ions of interest which reduces overall signal intensity. However, because the change in signal intensity was not as drastic as the change in background signal, higher trap drive voltage was preferred after optimization of instrument parameters was complete.
Low concentration samples of atrazine in varying matrices
Sampling of lower concentrations of atrazine was done, and varying concentrations from 25 µM down to 1 nM were analyzed. Figure 8 depicts 50 µL of 1 µM atrazine which shows 216 m/z signal intensity of around 5000. Low-mass background signal is observed as well as the primary daughter ion of 174 m/z, which was likely induced due to higher trap drive voltage. Figure 9 shows 50 µL of 1 nM atrazine with a 216 m/z signal intensity of around 3500 but with much poorer resolution and greater background signal, which can be expected due to the trace concentration of atrazine. Fragmentation is again observed.
Deuterated atrazine sampling
protonated atrazine. It is important to note the deuterated end of atrazine was not the primary loss to fragmentation, which makes this compound an especially suitable isotopically driven internal standard.
Figure 12 shows 50 µL of 50 µM atrazine_D5 with a 221 m/z signal intensity of 1.5•106. It is important to note that 216 m/z is also observed in this spectrum. MS/MS analysis of both protonated and deuterated atrazine done with isolation width of 1.00 and fragmentation voltage of 0.90 V shows expected daughter ions of 174 and 179 m/z respectively, confirming the presence of atrazine and atrazine_D5.
Optimization of the sample holder in PSI and re-optimization of instrument parameters
holder. Reoptimization of instrument parameters with the new sample holder then resulted in a new standard method for atrazine, with a trap drive voltage of 44 V, which helped preserve signal intensity.
Detection of trace atrazine and deuterated atrazine levels
Sampling of trace amounts of atrazine and deuterated atrazine was done, and concentrations down to 10 and 1 ppm were analyzed, with volumes of 1-50 µL. Figures 17-19 show 1 µL of 10 ppm of each atrazine and atrazine_D5 in MeOH with 216 and 221 m/z signal intensities at approximately 4000 and 6000 respectively on the full spectrum in Figure 17. The isolation spectra depict different signal intensities, likely due to instrument settings. An isolation width of 3.00 was used in order to increase the range of sampling due to the trace concentrations tested, which resulted in signals from other ions. Figures 20-22 show 5 µL of 1 ppm of each atrazine and atrazine_D5, the lowest concentration tested (nanogram range), in MeOH. As expected, background peaks overpower the 216 and 221 m/z peaks, at 2300 and 3000 signal intensities respectively, on the full spectrum. It is important to note the difficulty of isolation of these peaks due to low signal intensity. Higher isolation width was used, which introduced unwanted
background signal in the final spectra.
Other agrochemicals: s-metolachlor
standard method optimized for atrazine with the new sample holder and a new method optimized for s-metolachlor, were tested. Concentrations as low as 1 ppm with a volume of 1µL (picogram range) were applied. For the picogram range, the solvent 99/1 MeOH/AA and the atrazine-optimized method showed 284 m/z signal intensity of 4000 and poor isolation, while the solvent 99/1 AcN/AA and metolachlor-optimized method showed 284 m/z signal intensity of 6000 and improved isolation. With this spectral analysis, it was determined that the method optimized for metolachlor and 99/1 AcN/AA were more optimal for the detection of low-concentration s-metolachlor in PSI.
LTPI of s-metolachlor was also done. A multipurpose steel spatula cleaned with methanol and acetone washes mounted to a sample holder via a clamp was used as the metal plate for sampling. Greater levels of low-mass background signal were observed, likely due to the less stable sample holder and greater potential for contaminants from the metal plate, which unlike the paper strips, was used generally in the laboratory setting. This necessitated in the sampling of higher concentrations of analyte compared to PSI. Figures 30-32 show 284 m/z signal intensity of 3•104
on the full spectrum, with MS/MS analysis yielding clean results with the expected daughter ion at 252 m/z. However, optimization of the set-up, which included application of 2 kV external voltage, and 2.01 L/min helium flow, helped increase signal intensity and peak resolution.
Conclusion
respectively. Solvent choice and trap drive voltage proved to be significant factors in the overall quality of spectra obtained in both PSI and LTPI, while a double metal plate sample holder and hybrid triangular paper strip shape showed the most promising results in PSI. Continuing to improve upon set-up methods as well as instrument sensitivity is valuable based on these results in order to detect even lower concentrations, especially in crude environmental samples.
References
[1] Weston, D.J. Ambient ionization mass spectrometry: current understanding of
mechanistic theory; analytical performance and application areas. Analyst. 2010, 4, 661-668.
[2] Liu, J.; Wang, H.; Manicke, N.E.; et al. Development, Characterization, and Application of Paper Spray Ionization. Anal. Chem. 2010, 82, 2463-2471.
[3] Harper, J. D.; Charipar, N. A.; et al. Low-Temperature Plasma Probe for Ambient Desorption Ionization. Anal. Chem.2088, 80, 9097-9104.
[4] Manicke, N. E.; Yang, Q.; Wang, H.; et al. Assessment of paper spray ionization for quantitation of pharmaceuticals in blood spots. International Journal of Mass Spectrometry.
2011, 300(2-3), 123-129.
[6] Solomon, K. R.; Baker, D. B.; Richards, P. R.; et al. Ecological risk assessment of atrazine in North American surface waters. Environmental Toxicology and Chemistry. 1996, 15(1), 31-76.
[7] Aga, D. S.; Thurman, E. M. Coupling solid-phase extraction and enzyme-linked immunosorbent assay for ultratrace determination of herbicides in pristine water. Anal. Chem.1993, 65(20), 2894-2898.
[8] Chesters, G.; Simsiman, G. V.; et al. Environmental Fate of Alachlor and Metolachlor. Reviews of Environmental Contamination and Toxicology. 1989, 110, 1-74.
[9] Pothuluri, J. V.; Evans, F. E.; et al. Metabolism of Metolachlor by the Fungus
Cunninghamella elegans. Archives of Environmental Contamination and Toxicology. 1997, 32(2), 117-125.
[10] Atrazine. United States Environmental Protection Agency. http://www.epa.gov/ (accessed March 7, 2014).