Measuring the Accuracy of
Bus Rapid Transit Forecasts
An analysis of cost and ridership estimates for bus
rapid transit projects
Abstract
The research of Dr. Bent Flyvbjerg in the 1990s and early 2000s showed that urban rail
projects often cost more than estimated and carried fewer riders, a troubling trend suggesting that
the planning forecasts for urban rail projects were too optimistic. Inspired by that research, this
analysis seeks to extend that work to analyze bus rapid transit projects.
A study of forecasted versus actual costs and ridership was conducted for eighteen bus
rapid transit projects in the United States, Canada, the United Kingdom, Australia, and New
Zealand. Of the seventeen projects for which cost data could be found, the cost projections for
seven were within 5% of the actual cost, illustrating that the cost projections for these projects
tended to be more accurate than the urban rail forecasts Flyvbjerg studied. However, these
projects still leaned towards under estimating the final cost, with eight exceeding the projected
cost by at least 5%, compared to only two that underestimated it by at least 5%. Ridership
projections were evenly distributed between those that over or under estimated the actual
ridership, but tended to be far more inaccurate than the cost projections; of the fourteen projects
for which ridership data could be found, the actual ridership for only four of those projects came
within 10% of what was forecast. Further research would be necessary to see if these trends hold
true for other bus rapid transit projects as it becomes a more popular technological choice for
rapid transit investment around the world, but this analysis suggests that current forecasting
methods may leave much to be desired.
Introduction
When it was published, the research of Dr. Bent Flyvbjerg illustrated a consistent
inaccuracy of urban rail transit project forecasts in regards to cost and ridership. Compared to
rail projects were consistently projected under the actual cost and with overly optimistic
ridership predictions. Based on these findings, Flyvbjerg called for greater accountability over
forecasts of large-scale transportation projects (Flyvbjerg, 2005).
My analysis poses a related question: do bus rapid transit projects have similarly
inaccurate projections? In the past several years, bus rapid transit (BRT) has become an
increasingly popular option for city and local governments when investing in rapid transit. At a
time when many transit agencies are experiencing budget cuts and service reductions, the
relatively low capital costs of BRT make it an attractive option for agencies looking to expand
their rapid transit services. In North America alone, there will be 32 BRT projects completed or
under construction in 2014 (Freemark, 2014).
Much has been written about the characteristics of BRT and the current state of BRT
development, and there is a substantial body of research regarding the economic and
development impacts of a BRT system, but there is much less research regarding BRT ridership
and cost forecasts. And while there is a large body of work on travel forecasts, most obviously
Flyvbjerg’s research, most of it pertains specifically to freeway or urban rail projects. Given the
growing interest in bus rapid transit systems among local governments and transportation
professionals, this is a gap in the current research that I decided to explore.
Literature review
There is a large and growing body of research on bus rapid transit, most of which
generally fits into one of three categories: 1) the basic characteristics of BRT, 2) the current state
of BRT development, and 3) the economic and development impacts of BRT. Additionally, in
each of these categories there is much research comparing the characteristics and impacts of
A substantial amount of work has been written about the service characteristics of urban
transportation modes, including BRT, and this work offers useful parameters for defining BRT
systems and the opportunities for its development. This research attempted to define the level of
service characteristics at which point a system can be considered “bus rapid transit” and found
that BRT is growing in popularity due to its cost effectiveness and the fact that it can be adapted
for use in conventional bus systems (Vuchic, 1992) (Jarzab, Lightbody, and Maeda, 2002)
(Levinson, Zimmerman, Clinger, and Rutherford, 2002). Additionally, the Institute for
Transportation Policy (ITDP), a non-profit organization that provides technical assistance on
public transportation projects and advocates for BRT development, has developed a ranking
system for comparing BRT systems and determining whether a system meets their standards for
what can be considered “true” BRT, and argues that the state of BRT development in the United
States is behind many other countries due to the relatively few high-quality “true” BRT systems
in the U.S. (Weinstock, Hook, Replogle, and Cruz, 2011). This research proved useful for
understanding the characteristics of BRT and what could, even nominally, be considered as such.
Another aspect of BRT that has seen a lot of analysis is the land use and economic
development impacts of BRT projects. In general, this work found that BRT systems had the
potential to generate significant impacts on the built environment and local economy. In some
instances, studies have found that close proximity and accessibility to BRT stations have
generated higher property values, most notably in Seoul, South Korea (Cervero and Kang, 2011),
Beijing, China (Nelson and Deng, 2010), and Bogota, Columbia (Rodriguez and Mojica, 2009).
Even within the United States, BRT systems in Cleveland and Pittsburgh have spurred
significant investment in the communities along the BRT corridor (Hook, Weinstock, and
address, being the accuracy of BRT forecast models, so unfortunately it proved to be of little
assistance in my research.
As the inspiration for my proposed research, Flyvbjerg’s work was naturally very
important as a model for my research. Building on a body of work from the 1990s and early
2000s, this research examined the accuracy of cost and ridership forecasts for large
transportation projects, particularly urban rail and road projects, and found that urban rail
projects frequently exhibited large cost overruns and typically presented very optimistic ridership
forecasts compared with road projects, due in part to poor forecasting methods and also due to
biases on part of the forecasters to promote rail projects (Flyvbjerg et al., 1997, 2002, 2003,
2005, 2007). However, none of this work dealt with bus transit projects, hence the gap in the
current literature I hoped to address.
Methodology
Data was collected over a three month period on BRT systems in the United States,
Canada, the United Kingdom, Australia, and New Zealand. In large part, I was dependent on a
contact at the transit agency operating the BRT system to supply me with information on cost
and ridership estimates for these projects. While funding and ridership information is collected
by federal government agencies, such as the Federal Transit Agency in the United States, most of
this information deals with transit agencies as a whole rather than individual BRT projects. Many
of the transit agencies I contacted did not respond to my requests for information; of the nearly
thirty agencies I contacted, only eleven provided me with the necessary information. In a few
instances where the agency did not respond, I was able to find the necessary information through
media articles or government reports, but in most of these instances I was unable to find reliable
five countries that are not included in this analysis. In total, eighteen BRT projects are included
in the final analysis.
The methodologies Flyvbjerg employed in his research served as a guide for this analysis.
Many projects go through multiple forecasts which change as a project moves forward through
the design and construction phases. In his research, Flyvbjerg used the project forecasts from the
time of the decision to build, arguing that this is the information available to decision makers
when they agree to move forward on a project, and thus the most influential in determining the
worthiness of a project. These figures were then compared to the actual figures from the
completion of the project to determine their accuracy (Flyvbjerg, 2005). This is, in brief, what I
attempted to do in my analysis.
Given the small number of “true” BRT systems in these countries – that is, systems
which have nearly all or all of the features of bus rapid transit, such as dedicated lanes,
pre-boarding payment, limited stops, and branded service – this analysis also included some
“BRT-lite” systems – systems with only a few of the features of bus rapid transit – and some busway
projects to produce a statistically significant sample of BRT projects. While not all these systems
are what would be deemed “true” BRT, they do all represent significant investments in public
transit for each of the cities included here, so their value in an analysis of large-scale
transportation projects shouldn’t necessarily be dismissed.
Hypothesis
Due to BRT being a less prestigious transit mode compared to urban rail, as well as being
less expensive in terms of capital costs, I predicted that the cost estimates for BRT projects
would generally be more accurate than those for the urban rail projects that Flyvbjerg studied. In
also prove to be more accurate than those for the urban rail projects that Flyvbjerg studied due to
the generally shorter time horizons for BRT construction, which could translate to more accurate
predictions of ridership. Indeed, I came to see the ridership question as the more important issue
my research could address, given that I had no clear expectations from the outset and hoped my
research could fill a gap in the existing literature.
Individual case studies
Auckland, New Zealand
The Northern Busway, a dedicated busway that links Auckland City with the suburbs of
the North Shore, was New Zealand’s first dedicated busway when it officially opened in
February 2008. Built as a joint venture between Transit New Zealand, the North Shore City
Council, the Auckland City Council, and the Auckland Regional Transport Authority, the project
consists of a 6.2 km (3.9 miles) dedicated two-lane busway running parallel to a major highway
and five large stations that serve bus operations along the route.
Estimates for the project significantly underestimated the project cost, and a major
reevaluation of the costs of the project had to be taken during the detailed design and
procurement phases of the project. This was due primarily to significant increases in property
acquisition costs for the busway stations, the fact that the design cost estimates for the stations
lacked reliable civil engineering estimates, and changes in Transit New Zealand’s project
estimation practices. All told, the initial busway project estimates of NZD $120 million in capital
costs, or NZD $30.77 million per mile (USD $29.89 million in 2014), fell far below the actual
capital costs of NZD $180 million upon completion of the busway (S. Paton, personal
communication, January 29, 2014), or NZD $46.15 million per mile in 2008 (USD $44.77
Despite the added expenses, reports indicate that ridership on the Northern Busway has
far exceeded expectations (S. Paton, personal communication, January 29, 2014), and a second
busway is currently planned for the Auckland region. Unfortunately, I was unable to acquire
exact ridership estimates for the Northern Busway project, so I have chosen not to include it in
my final ridership analysis.
Cambridgeshire, United Kingdom
The Cambridgeshire Guided Busway is a guided bus system that connects the city of
Cambridge with the communities of Huntingdon and St Ives in the English county of
Cambridgeshire. The longest guided busway in the world, it opened in August 2011 and is made
up of two guided sections which have a combined length of 16 miles. The busway serves
specially adapted buses which are guided by the busway’s track, thus eliminating the need for the
operator to steer the bus (Cambridgeshire County Council, 2012).
Cost overruns were a significant problem with the project, with the busway going £36
million over budget (Havergal, 2013). When approved in 2005, the project was projected to cost
£116 million, or £7.25 million per mile (USD $13.84 million in 2014) when completed, but
delays, rising construction costs, and a lawsuit between the Cambridgeshire County Council and
the private contractor caused construction costs to rise to £152 million (Havergal, 2013), or £9.5
million per mile (USD $12.55 million in 2014). However, ridership has been very strong on the
busway, exceeding expectations: forecasts had predicted 1.75 million passenger trips on the
busway in the first year, but actual ridership was more than 40% above this number, reaching 2.5
million passenger trips in the first year (Cambridgeshire County Council, 2012).
The HealthLine, operated by the Greater Cleveland Regional Transit Authority
(GCRTA), is a 7.1 mile bus rapid transit line that serves Euclid Avenue between Downtown
Cleveland and East Cleveland, linking two of the region’s largest employment centers. Opened
in October 2008, the system was named following the purchase of naming rights by a consortium
of the Cleveland Clinic and University Hospitals, two major health care institutions in the Euclid
corridor. The Institute for Transportation & Development Policy gave the HealthLine the highest
ranking of any BRT system in the United States, indicating that they consider it the most
complete example of bus rapid transit in the U.S. (Weinstock, Hook, Replogle, and Cruz, 2011).
4.4 miles of the line utilize exclusive bus lanes in the median of Euclid Avenue, while the
remaining 2.7 miles are operated in mixed-traffic curb lanes serving sidewalk stops. All stations
and stops have distinctive structures, off-board fare equipment, and other amenities, and
HealthLine vehicles have signal priority at traffic intersections (FTA, 2012).
Capital costs for the HealthLine were $197.2 million in 2008 dollars ($27.77 million per
mile in 2008, or $30.28 million in 2014), which was actually far below initial estimates. A 1995
estimate set the budget at $273.4 million when adjusted to 2008 dollars, or $38.51 million per
mile ($41.99 million in 2014), but further revisions set estimates ranging from $248.2 million to
$317.4 million in 2008 dollars. Due to cost effectiveness requirements to receive federal funding,
GCRTA trimmed costs for design elements and vehicle procurement, and utilized management
tools to monitor the project budget. In the end, they were able to complete the project below any
of their estimates (GCRTA, 2012).
Early ridership forecasts anticipated 21,100 average weekday trips on the HealthLine, but
this would be later revised to 13,500 (FTA, 2012). However, neither of these forecasts
subsequent drop in area-wide transit ridership, which fell by 22% between 2007 and 2010 (FTA,
2012). Actual average weekday ridership on the HealthLine as of 2012 was 14,300 trips, and
ridership in the corridor has steadily grown since introduction of the HealthLine service, despite
the system-wide reduction in ridership (FTA, 2012).
Escondido, California
Launched in June 2011 by the North County Transit District (NCTD), the Breeze Rapid
service is a “BRT-lite” system that utilizes newly-built queue jump lanes at congested
intersections, traffic signal priority for buses, and bus station improvements to provide a six-mile
long branded rapid service in north San Diego County, California. In a 2006 concept study,
NCTD estimated a capital cost of $2.42 million using 2005 dollars, or $2.79 million in 2011
dollars when taking inflation into account. This translates to $0.47 million per mile in 2011, or
$0.49 million in 2014. However, upon opening, the project had a capital cost of $4.21 million
($0.7 million per mile in 2011, or $0.73 in 2014), due in large part to an expansion of the scope
of traffic improvements at one intersection, where a proposed queue jump lane that would have
extended a partial receiving lane at the far end of an intersection was expanded into a full block
widening (D. Veeh, personal communication, December 30, 2013).
No formal ridership projection for the service was conducted. Being the first instance of a
rapid bus service in the region, the San Diego Association of Governments, the regional planning
agency for San Diego County, treated it as a technology and concept demonstration that
upgraded an existing local bus route rather than a project to significantly boost ridership (D.
Veeh, personal communication, December 30, 2013). Data shows that ridership on the Breeze
Rapid increased 19% during the first year after the launch, compared to the 11% increase on the
30, 2013).Unfortunately, without a ridership estimate, I can’t count this system in my ridership
analysis.
Eugene, Oregon
The Lane Transit District (LTD), the public transit authority serving Lane County,
Oregon, initiated a bus rapid transit service called the Emerald Express (EmX) with the opening
of a four mile line between the downtowns of Eugene and Springfield, Oregon in January 2007.
The system has been noted as a BRT success story by the ITDP (Weinstock, Hook, Replogle,
and Cruz, 2011), constructed within budget and with ridership far exceeding stated expectations.
A 7.8 mile extension of the original line from Springfield to Gateway Mall opened in January
2011, and more EmX lines are currently planned for the Eugene region.
The EmX has so far consistently been implemented within budget. The initial four mile
line was estimated to cost $24.6 million ($6.15 million per mile in 2007, or $6.96 million in
2014), and this estimate proved to be accurate. The Gateway extension was estimated to cost
$43.1 million or $5.53 million per mile in 2011 ($5.77 million in 2014), but actually came in
under budget at $41.3 million, or $5.29 million per mile ($5.53 million in 2014) (A. Vobora,
personal communication, February 8, 2014). Prior to the opening of the first segment, ridership
was estimated to increase by 40% in the corridor over 20 years of service. Instead, it exceeded
that level within the first year, with ridership in the corridor rising from 2,700 average weekday
boardings to over 4,400 within the first year, peaking at 6,000 just prior to the opening of the
Gateway extension in 2011. Ridership estimates for the Gateway extension were estimated to
increase ridership along the entire EmX line by 3,700 additional weekday boardings. Within one
year of the opening of the Gateway extension, ridership had reached 80% of this estimate, and
year and exceeds 11,000 in some months, 135% of the estimate predicted for the line after
completion of the Gateway extension (A. Vobora, personal communication, February 8, 2014).
Kansas City, Missouri
Following the successful implementation of a bus rapid transit line in Kansas City,
branded the Metro Area Express (MAX), in July 2005, the Kansas City Area Transportation
Authority began pursuing implementation of a 13-mile second line along Troost Avenue,
roughly one mile west and parallel to the existing Main Street MAX line. As of 2007, the Main
Street MAX line had resulted in a 20% growth in ridership along the Main Street corridor, and
planners expected similar results from the new Troost Avenue line (FTA, 2007). The line was
ultimately completed and opened for service in January 2011 (KCATA, 2012), slightly behind its
original schedule of completion in late 2010 (FTA, 2007). Both lines utilize dedicated bus lanes,
traffic signal prioritization, and branded buses and stations to provide a faster service than typical
local bus service.
As of 2007, the capital costs for the Troost line were estimated at $30.73 million in year
of expenditure dollars (FTA, 2007), or $2.36 million per mile ($2.46 million in 2014). This
proved to be slightly above the actual cost of $30.6 million (KCATA, 2010), or $2.35 million per
mile ($2.45 million in 2014), meaning that the Troost line came in under budget. However,
ridership fell slightly below expectations: in 2007, it was predicted that the new line would have
9,000 average weekday boardings in its first year of service (FTA, 2007), but following one year
of service, the Troost line had only 8,500 average weekday boardings (KCATA, 2012).
London, United Kingdom
Transport for London (TfL) implemented the first phase of a bus rapid transit project
improvements along the bus corridor between Ilford and Dagenham Dock via The Thames View
Estate through East London, and involved the replacement of an existing route with two new
routes, branded EL1 and EL2, service level enhancements, new bus-only sections, and a new
service to Dagenham Dock station. The final capital cost of the project was £27.79 million
(Jacob, G., personal communication, March 4, 2014); unfortunately, cost estimates for the
project were not found.
As of summer 2007, the “business case” justifying the project estimated that annual
ridership would rise from 4.1 million on the existing bus route (as of FY 2007) to 6.2 million on
the combined two new routes following completion of the project. In FY 2011, ridership on the
two new routes was 6 million, and rose to 6.4 million in FY 2012 and FY 2013 (Jacob, G.,
personal communication, March 4, 2014), indicating that ridership has modestly exceeded
expectations.
Los Angeles, California
Los Angeles’ primary public transit agency, the Los Angeles County Metropolitan
Transportation Authority (Metro for short), operates two bus rapid transit lines: the Orange Line
and the Silver Line. Metro also operates a rapid bus service called the Metro Rapid, which has
some features of BRT, such as limited stop service and traffic priority at intersections, but for
this analysis I will focus on the Orange and Silver Lines, as they are a more fully-fledged
realization of “true” BRT.
The Orange Line, regarded as one of the first “true” BRT systems in the United States,
opened on October 29, 2005 and was constructed along a former Southern Pacific Railroad
Hollywood and Woodland Hills, a four mile extension to Chatsworth began construction in 2009
and was completed in June 2012.
Costs of construction for the Orange Line were generally within budget, though ridership
was far above what was projected. The initial 14-mile stretch, which included a bikeway, cost
$323.6 million (Callaghan and Vincent, 2007), or $23.11 million per mile ($27.78 million in
2014), which was actually under the original $340.4 million announced by Metro (Metro, 2003),
or $24.31 million per mile ($29.22 million in 2014). An additional $26 million was spent on an
additional station on the line, which opened in December 2006 (Callaghan and Vincent, 2007).
The Canoga extension, on the other hand, came in over the original announced budget. When
first announced in 2006, it was projected to cost $135 million (Guccione, 2006) (Callaghan and
Vincent, 2007), or $33.75 million per mile ($34.51 million in 2014), but at the start of
construction that estimate was changed to $215.6 million. Following completion, however,
Metro announced that it had cost $154 million, or $38.5 million per mile ($39.37 million in
2014), far below their previous estimate but still above the originally announced number
(Bloomekatz, 2012).
Ridership on the Orange Line has consistently exceeded expectations. For the initial
segment, Metro had projected 5,000 to 7,500 average weekday boardings for the first year of
service, and 22,000 average weekday boardings by 2020. But in May 2006, only seven months
after the start of service, the Orange Line carried 21,828 average weekday boardings, very close
to their stated 2020 goal (Callaghan and Vincent, 2007). Ridership continued to grow, reaching
nearly 24,000 average weekday boardings in October 2010 and 26,614 average weekday
boardings in October 2011 (Hymon, 2012). The extension to Chatsworth was projected to
entire line including the extension would carry 45,000 daily riders by 2030 (Anderson, 2012).
Whether this goal will be met remains to be seen, but initial results are promising: Orange Line
ridership rose from 26,670 in May 2012, one month prior to completion of the extension (D.
Mieger, personal communication, December 18, 2013), to 32,069 in October 2012 (Hymon,
2012) and 31,780 in October 2013 (D. Mieger, personal communication, December 18, 2013).
The Silver Line, by contrast, is not a full-featured BRT system, instead utilizing
high-occupancy toll lanes rather than dedicated bus lanes for most of its length between El Monte and
the Harbor Gateway area via Downtown Los Angeles. Additionally, the Silver Line lacks the
off-board fare collection system that the Orange Line has. Rather than being built all at once like the
Orange Line, the Silver Line was incrementally developed from pre-existing bus services and
utilized two existing transitway facilities: the El Monte Busway, which opened in 1973, and the
Harbor Transitway, which opened in 1996. As a branded BRT service, the Silver Line only dates
back to 2009 and was a consolidation of bus services that previously served these corridors.
Following the start of service, Metro implemented the Metro ExpressLanes Demonstration
Program in 2013, which converted the high-occupancy vehicle lanes on both transitways to the
current high-occupancy toll lanes and included expansion of transit stations, purchase of new
Silver Line buses, and installation of bus priority signals on surface streets in Downtown Los
Angeles where the Silver Line operates.
Because of these factors, there are no clear start and completion dates for implementation
of the existing Silver Line service, and even when cost figures for the transitways are available it
would be very difficult to isolate the Silver Line service from other bus services that utilize these
ridership figures I would have hoped to acquire have no useful beginning and end dates in the
case of the Silver Line, so I have chosen to exclude it from my final analysis.
Minneapolis, Minnesota
Opened on June 22, 2013, the METRO Red Line is a new 11-mile bus rapid transit
service that utilizes bus-only shoulders along Cedar Avenue/State Highway 77 between the Twin
City suburbs of Bloomington and Apple Valley, Minnesota, with plans for a further extension
south to the community of Lakeville. Development of the project began with a study of the
corridor in 1998 and construction began in 2011 before being completed in the summer of 2013.
The project was faced with construction setbacks and the phasing of the project changed
over time. The original plan was to implement the full Bloomington-Lakeville project in 4
phases with various elements of capital and operating investment in each phase. However, the
most recent plan switched the investment strategy to 3 phases and altered the timing of the
elements included in each stage. Under this revised plan, the capital cost of the first phase of the
project from Bloomington to Apple Valley was planned to be $118 million, or $10.73 million per
mile ($10.81 million in 2014) and ended up costing $112 million, or $10.18 million per mile
($10.26 million in 2014) (C. Hiniker, personal communication, December 17, 2013).
However, while the construction costs came in under budget, operational costs for the
system were cut back during construction, causing the initial roll-out of the system to be scaled
back to a less frequent service than originally planned. The original planning forecast for
opening day ridership was about 2,250 daily riders, but a new analysis taking into account the
reduction in service revised the figure to about 960 average daily riders for the first year.
revised annual projections for the first year, and only 37% of the original projections (C. Hiniker,
personal communication, December 17, 2013).
Pittsburgh, Pennsylvania
The Port Authority of Allegheny County, the public transportation agency for the
Pittsburgh region, owns and operates three separate bus-only highways. Rather than serving
branded bus rapid transit service, Pittsburgh’s busways serve mostly local and suburban feeder
bus routes that utilize the busways to bypass congested corridors to and from Downtown
Pittsburgh. The first busway constructed, the South Busway, was completed in 1977 to serve the
southern portions of Pittsburgh. The Martin Luther King Jr. East Busway, which connects
Downtown Pittsburgh to the borough of Wilkinsburg, was constructed in 1983, with a 2.3 mile
extension to the borough of Swissvale completed in 2003. The newest busway, the West
Busway, connects Pittsburgh to the borough of Carnegie and was completed in 2000. Each of the
three busways has several stations to serve the neighborhoods located along the route. Based on
the availability of information, my analysis will focus on the most recent developments of the
Pittsburgh busway system.
A Federal Transit Administration evaluation of the West Busway, released in April 2003,
found that the West Busway project came within the projected cost for the project, but only after
significant changes to the proposal were made. Construction of the project, which includes six
stations, was originally estimated at $328.8 million, or $40.59 million per mile ($55.34 million in
2014), but the estimate rose to $515 million following issues with land acquisition from freight
rail company CONRAIL and problems in the development of a proposed new HOV bridge over
the Monongahela River into Downtown Pittsburgh. Ultimately, the CONRAIL land acquisition
revised project down to $326.8 million, close to the original estimate. However, the project only
remained within budget due to this significant scaling back of the original proposal, which was
originally 8.1 miles but was scaled back to 5 miles (FTA, 2003), bringing the final cost per mile
to $65.36 million ($89.11 million in 2014). Ridership on the West Busway, however, did meet
expectations. The initial estimate of nearly 7,000 riders per day upon opening did prove to be
accurate (FTA, 2003), and daily ridership on the busway reached a peak of 10,000 in 2004
(Vincent, 2004) before leveling off in later years.
The extension of the East Busway to Swissvale in 2003 was projected to cost $62.8
million in year of expenditure dollars (FTA, 1998), or $27.3 million per mile ($34.83 million in
2014), but this figure rose to $68.5 million by completion (TRB, 2001), or $29.78 million per
mile ($38 million in 2014). It was also projected to add an additional 3,800 daily riders to the
line by 2005 (FTA, 1998). As of 2001, prior to expansion, ridership on the East Busway was at
28,000 daily riders (TRB, 2001), so an additional 3,800 riders would have given the entire
busway a combined ridership of 31,800 riders. However, these estimates turned out to be far too
optimistic. Ridership on the East Busway initially grew following expansion, but has actually
fallen since; as of 2004, the East Busway carried an additional 2,000 daily riders, about 53% of
projections, for a total of 30,000 daily riders (Vincent, 2004). But as of 2011, daily ridership on
the entire East Busway had fallen to 25,600 (Weinstock, Hook, Replogle, and Cruz, 2011). This
occurs at a time when annual ridership has fallen overall for the Port Authority of Allegheny
County, dropping from 66 million passenger trips in 2001 to 63.8 million in 2011 (NTD, 2002
and 2012).
The Regional Transportation Commission of Washoe County (RTC) initiated a 4.5-mile
“BRT-lite” service called the RTC RAPID along South Virginia Street in Reno, a corridor which
has been targeted for transit oriented development by the City of Reno. Planning for the project
began in 2001 and the system was implemented in three phases between 2009 and 2013, with
each phase introducing more specialized BRT elements. Phase 1, which opened in fall 2009,
included the replacement of existing local service with branded local and limited stop service and
minor improvements such as bus stop enhancements and traffic priority signals. Phase 2, which
opened in fall 2011, involved the acquisition of articulated buses and upgrading existing stops to
BRT stations. Phase 3, which went into effect in fall 2013, involved enhancements to BRT
stations, namely floor-level boarding platforms, wi-fi capability, and ticket vending machines for
off-board fare collection (E. Park, personal communication, January 27, 2014).
Total capital costs for the combined three phases were estimated at $13.43 million, or
$2.98 million per mile ($3.26 million in 2014), but actually came out to $15.35 million ($3.41
million per mile ($3.73 million in 2014). The majority of this was dedicated to the second phase
of implementation, which cost $13.25 million (all figures in 2009 dollars), nearly $2 million
above the projected $11.64 million. Most capital and operating costs were funded by federal
Congestion Mitigation and Air Quality (CMAQ) funds, which proved essential to completing the
project following service cuts in FY 2009 as a result of the Great Recession (E. Park, personal
communication, January 27, 2014).
The recession is also responsible for ridership falling short of projections made in the
planning stage. In 2007, service on South Virginia Street was operating near capacity, creating a
significant bus bunching problem. It was estimated that even without BRT, ridership along the
2,350,000 in FY 2010 (when RTC RAPID service began) and climbing to 2,720,419 in FY 2013.
With BRT, it was estimated that there would be an additional 13.2% increase in ridership on the
corridor, growing to 2,660,000 in FY 2010 and 3,079,283 in FY 2013 (R. Henson, personal
communication, February 26, 2014). Instead, a system-wide reduction in ridership following the
recession and service cuts meant that actual ridership on the corridor dropped to 1,665,702 in FY
2010, and only rose to 1,822,018 by FY 2013. Indeed, following the recession and subsequent
service cuts, ridership on the corridor didn’t rise to FY 2007 levels until FY 2012. Since
introduction of the service, ridership has grown by almost 10% in the corridor; a modest
increase, and perhaps still an accomplishment in light of the starting point at the height of the
recession, but nevertheless the RTC RAPID fell far short of early ridership projections (R.
Henson, personal communication, February 26, 2014).
San Antonio, Texas
San Antonio’s public transportation agency, VIA Metropolitan Transit (VIA for short),
opened a “BRT-lite” service called VIA Primo in December 2012. VIA Primo is a branded
service operating a 20-mile route along the Fredericksburg Road corridor using specially-bought
vehicles, branded stations, and traffic signal prioritization for buses. Despite the relatively
modest scope of the project compared to other BRT initiatives, it does represent a significant
investment in public transportation for San Antonio.
At the time of the decision to build in 2009, capital costs for the project were estimated to
be $40.1 million in 2012 dollars, or $2.01 million per mile ($2.06 million in 2014) at the end of
construction. The actual capital costs for the project at completion were $35 million, or $1.75
million per mile ($1.79 million in 2014), 87% of the estimated cost when adjusting for inflation.
one year of operation, actual ridership was 5,800 riders daily, a modest amount but still within
expectations (J. Aguilera, personal communication, February 7, 2014).
Snohomish County, Washington
Community Transit opened a BRT service called Swift in November 2009, which
operates a 16.7 mile line along State Road 99 between Aurora and Everett, Washington. The
service utilizes seven miles of transit-only lanes, traffic signal priority, articulated buses, and
branded stations with pre-boarding fare collection.
The Swift project was completed over the initial budget. When announced in 2005, the
project was estimated to cost $15-20 million (Community Transit, 2005), or $1.2 million per
mile ($1.31 million in 2014), but was actually completed at a cost of $29 million, or $1.74
million per mile ($1.9 million in 2014). Additionally, four stations that were included in the
original plan were deferred due to funding issues and not completed until 2011 (Community
Transit, 2011). However, ridership has also exceeded expectations: a 2004 study by Community
Transit predicted that Swift would reach 2,500 boardings per weekday after one year of service,
and 4,000 per weekday after four years of service (Duke, 2010). Actual ridership after one year
was 3,500 boardings per weekday (Duke, 2010), and after four years that number had grown to
4,400 (Munguia, 2013), 110% of the projected amount for this time. Surprisingly enough, this
growth in ridership occurred despite a system-wide reduction in ridership (Munguia, 2010) and
service cuts in 2010 and 2012, which reduced service frequency and operating hours for the BRT
service (Munguia, 2012). Annual ridership for Community Transit dropped from 11.4 million in
2009 to 9.1 million in 2012 (NTD, 2010 and 2013), making the growth of Swift ridership that
much more remarkable.
Built and owned by the State Government of New South Wales, the Liverpool to
Parramatta Transitway was the first of a planned network of busways for Western Sydney. First
announced in 1998, it was completed and opened in February 2003 and branded as the “T-way,”
short for “transitway” and after opening served buses operated by Western Sydney Buses, a
subsidiary company of the private public transit operator State Transit Authority. The transitway
is a 31 km (19.3 miles) facility, made up of 20 km of bus-only roads and 11 km of dedicated bus
lanes, that link the communities of Liverpool and Parramatta with a series of intermediate
destinations (Audit Office of NSW, 2005).
The cost of the project grew substantially from what was first announced, rising from an
estimated AUD $98 million, or AUD $5.08 million per mile (USD $6.02 million in 2014), when
first announced to a final cost of AUD $346 million, or AUD $17.93 million per mile (USD
$21.25 million in 2014), upon completion (Audit Office of NSW, 2005). A lack of feasibility
assessment prior to the decision to build was largely responsible for the increased costs; the
scope of the project expanded from a 20 km transitway to 31 km of transitway following a
formal feasibility assessment. Additionally, modifications to the project following an
environmental impact assessment and subsequent court challenge added costs and delayed the
project, and higher construction costs came as a result of the delay (Audit Office of NSW, 2005).
Ridership has fallen far below projections. Initial estimates predicted 4.3 million annual
passenger trips after opening, and it was on this basis that the project moved forward. However,
revised estimates were made when private operators made bids for the contract, with the State
Transit Authority releasing a revised projection of 2.8 million annual passenger trips, only 65%
of the initial estimate. Even this was far above the actual annual ridership for FY 2005, a couple
NSW, 2005). This has been blamed in large part on a lack of coordination between area transit
operators, which prevented maximizing usage of the transitway (Audit Office of NSW, 2005).
Following bus system reforms, ridership did rise on the transitway, reaching 2.77 million
passenger trips in FY 2012 (Transport for NSW, 2012), but this still falls below planning
projections.
Winnipeg, Manitoba
The Southwest Transitway, opened in April 2012, is a 3.6 km (2.2 miles) dedicated
busway that links Downtown Winnipeg to southwest Winnipeg. The facility is operated by
Winnipeg Transit and serves 13 bus routes that operate between Downtown and various
destinations in southwest Winnipeg, which are collectively branded as Winnipeg Rapid Transit.
Three stations are located along the transitway, and plans are in place for the transitway to be
extended south to the campus of the University of Manitoba.
The project was completed at its initial estimated budget of CAN $138 million (P.
Wiwchar, personal communication, February 5, 2014), or CAN $62.73 million per mile (USD
$56.92 million in 2014). Unfortunately, Winnipeg Transit refused to release any ridership info on
the project, stating that ridership figures were for internal analysis only (P. Wiwchar, personal
communication, February 5, 2014). As such, only the cost information for the Southwest
Transitway will be included in my final analysis.
Results
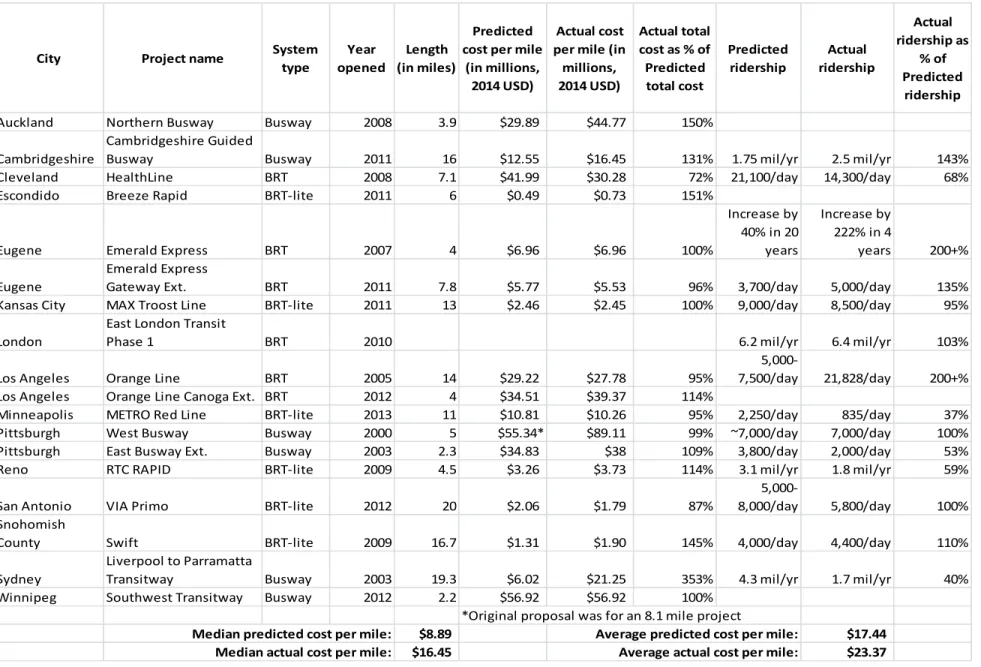
The following table summarizes the results of this analysis, comparing the predicted and
Table 1: Summary of Individual Case Studies
City Project name System
type Year opened Length (in miles) Predicted cost per mile
(in millions, 2014 USD)
Actual cost per mile (in millions, 2014 USD)
Actual total cost as % of Predicted total cost Predicted ridership Actual ridership Actual ridership as % of Predicted ridership
Auckland Northern Busway Busway 2008 3.9 $29.89 $44.77 150%
Cambridgeshire
Cambridgeshire Guided
Busway Busway 2011 16 $12.55 $16.45 131% 1.75 mil/yr 2.5 mil/yr 143%
Cleveland HealthLine BRT 2008 7.1 $41.99 $30.28 72% 21,100/day 14,300/day 68%
Escondido Breeze Rapid BRT-lite 2011 6 $0.49 $0.73 151%
Eugene Emerald Express BRT 2007 4 $6.96 $6.96 100%
Increase by 40% in 20 years
Increase by 222% in 4
years 200+%
Eugene
Emerald Express
Gateway Ext. BRT 2011 7.8 $5.77 $5.53 96% 3,700/day 5,000/day 135%
Kansas City MAX Troost Line BRT-lite 2011 13 $2.46 $2.45 100% 9,000/day 8,500/day 95%
London
East London Transit
Phase 1 BRT 2010 6.2 mil/yr 6.4 mil/yr 103%
Los Angeles Orange Line BRT 2005 14 $29.22 $27.78 95%
5,000-7,500/day 21,828/day 200+%
Los Angeles Orange Line Canoga Ext. BRT 2012 4 $34.51 $39.37 114%
Minneapolis METRO Red Line BRT-lite 2013 11 $10.81 $10.26 95% 2,250/day 835/day 37%
Pittsburgh West Busway Busway 2000 5 $55.34* $89.11 99% ~7,000/day 7,000/day 100%
Pittsburgh East Busway Ext. Busway 2003 2.3 $34.83 $38 109% 3,800/day 2,000/day 53%
Reno RTC RAPID BRT-lite 2009 4.5 $3.26 $3.73 114% 3.1 mil/yr 1.8 mil/yr 59%
San Antonio VIA Primo BRT-lite 2012 20 $2.06 $1.79 87%
5,000-8,000/day 5,800/day 100%
Snohomish
County Swift BRT-lite 2009 16.7 $1.31 $1.90 145% 4,000/day 4,400/day 110%
Sydney
Liverpool to Parramatta
Transitway Busway 2003 19.3 $6.02 $21.25 353% 4.3 mil/yr 1.7 mil/yr 40%
Winnipeg Southwest Transitway Busway 2012 2.2 $56.92 $56.92 100%
*Original proposal was for an 8.1 mile project
Median predicted cost per mile: $8.89 Average predicted cost per mile: $17.44
As expected, the BRT projects studied generally had more accurate cost estimates than
the urban rail projects that Flyvbjerg studied. Of the 17 projects for which adequate cost
information could be obtained, the actual capital costs of seven came within 5% of their
projected cost, while 11 came within 15% of their projected cost. However, while there were a
high number of accurate or nearly accurate cost forecasts, the data also shows a propensity
towards projects coming in over their estimated budget, with eight exceeding the projected cost
by at least 5%, compared to only two that underestimated it by at least 5% (Figure 1). Of the
projects described, those that were far over budget (at least 15% over) were either busways,
which have relatively high capital costs, or BRT-lite systems which had such low capital costs
that even a difference of a few million dollars had a large proportional effect.
When it comes to ridership estimates, however, the overall picture is much different. Of
the 14 projects for which adequate ridership data could be obtained, only four came within 10%
of their projected ridership. Unlike the cost estimates, which had a propensity for being under the
actual cost, the ridership estimates were pretty evenly distributed between those that were higher
and lower than the actual ridership. This proved true regardless of whether the project was a
busway, a BRT line, or BRT-lite (Figure 2).
Figure 2: Distribution of actual ridership as percentage of predicted ridership
Discussion
The propensity towards projects coming in over-budget among those systems studied
projects Flyvbjerg studied, albeit to a lesser extent given the relatively high number of projects in
which the accuracy of the estimated costs was very good.
However, while there was a high level of accuracy in the cost estimates, it is worth noting
that in some cases these BRT projects only came within budget due to a scaling back of the
project from what was initially proposed. This was particularly evident in the case of the Western
Busway in Pittsburgh, where the scope of the project was significantly reduced, and to a lesser
extent with the HealthLine in Cleveland, when the expense of certain design elements was scaled
back.
While the ridership estimates were more evenly distributed between those that came
above and those below the actual figures, there was far less accuracy overall than in the cost
estimates. This illustrates the great difficulty in accurately predicting transit ridership. But a
common theme among several of these projects was the effect of the Great Recession on the
actual ridership figures: in Cleveland, Minneapolis, Pittsburgh, and Reno, overall transit
ridership dropped as a result of the recession and subsequent cuts to transit service, likely a
major factor in causing new BRT projects in these cities to fail to live up to ridership
expectations. While some BRT projects exceeded ridership expectations despite the recession,
such as those in Eugene, Oregon and Snohomish County, Washington, the Great Recession
clearly had a major impact on the outcome of many transit projects.
Drawbacks
The primary drawback with this research is the number of BRT projects this analysis
covers. Of the more than 40 BRT projects I attempted to obtain data on, I was only able to find
reliable and comparable cost data for 17 BRT projects, and suitable ridership data was obtained
ridership figures; besides different timelines and methodologies employed by the transit
agencies, there were instances like the case of Escondido, California, where the lack of ridership
estimates illustrated a project in which ridership growth was not a significant goal of their BRT
system. The sample size of BRT projects here means that while this research may pick up on
trends among BRT systems, it doesn’t serve as conclusive evidence of wider characteristics
among bus rapid transit projects. Further research would be necessary to draw firmer conclusions
about the nature of bus rapid transit cost and ridership projections.
Another drawback with this research is the heavy focus on American BRT systems. In
part, this is a natural consequence of the geographical distribution of BRT systems between these
countries: there are simply more BRT systems in the United States than there are in Canada, the
United Kingdom, Australia, or New Zealand. This research dealt with BRT as a technological
choice, much like Flyvbjerg’s research treated urban rail projects, regardless of their location.
However, this ignored the fact that BRT is treated differently between these countries: in the
United Kingdom, Australia, and New Zealand, BRT projects usually take the form of dedicated
busways or guided busway systems, while in the U.S. and Canada, BRT projects are a mixture of
busways, “true” BRT, and BRT-lite systems, reflecting not only different approaches to BRT
system design but also the difference in costs and potential expectations involved with such
investment. There’s also the matter that there are different approaches to bus transit planning
between these countries; in the U.S. and Canada, planning and operations are usually done by
public agencies, while in Australia and the U.K., operations are typically handled by private
contractors. Due to these different characteristics, more examples of BRT projects in Canada,
Australia, and the U.K. would have been desirable to give a more complete view of BRT
Conclusions
From this analysis, we can see some intriguing trends in bus rapid transit projects that
suggest drawbacks in current approaches to cost and ridership forecasts for bus rapid transit
systems. In particular, the propensity towards over budgeted projects among those studied and
the wide inaccuracy of ridership projections are worth further consideration.
While the cost estimates of the bus rapid transit projects studied tended to be more
accurate than the urban rail projects Flyvbjerg studied, the propensity of them towards being
completed over budget suggests that bus rapid transit projects could potentially suffer from some
of the same cost estimate problems as urban rail projects. It may be worth seeing if other bus
rapid transit projects reflect this skewed distribution in the accuracy of their cost estimates.
Bus rapid transit projects did show even distribution in terms of the accuracy of ridership
estimates, although the widespread inaccuracy among the projects studied suggests that the
accuracy of these estimates leave much to be desired. Two major factors come into play here: the
inherent difficulty with accurately predicting transit ridership, and the effects of the Great
Recession on overall transit ridership. With so many new bus rapid transit projects under
construction and opening in the years to come, it would be interesting to see if these trends hold
for new bus rapid transit projects.
Acknowledgments
I would like the following people who contributed to the information presented in this
analysis:
- Simon Paton, Senior Project Manager, NZ Transport Agency
- Valerie Shea, Planning Team Leader, Programming and Planning Department, Greater
- Danny Veeh, Associate Planner, San Diego Association of Governments
- Andy Vobora, Director of Customer Services and Planning, Lane Transit District
- Gemma Jacob, FOI Case Officer, Transport for London
- David L. Mieger, Deputy Executive Officer, Countywide Planning, Los Angeles County
Metropolitan Transportation Authority
- Cole Hiniker, Senior Planner, Metropolitan Transportation Services
- Ed Park and Roger Henson, Senior Transit Planners, Regional Transportation
Commission of Washoe County
- Jessica Aguilera, Customer Service Specialist, VIA Metropolitan Transit
- Phil Wiwchar, Market Research Analyst, Winnipeg Transit
References
- Anderson, Gayle (2012). Ready to Roll: Metro Orange Line Extension to Chatsworth.
The Source. Los Angeles County Metropolitan Transportation Authority. June 29, 2012.
Retrieved from:
http://thesource.metro.net/2012/06/29/ready-to-roll-metro-orange-line-extension-to-chatsworth/
- Audit Office of New South Wales (NSW), (2005). Auditor-General’s Performance Audit
Report, Liverpool to Parramatta Bus Transitway. December 2005.
- Bloomekatz, Ari (2012). Orange Line bus extension goes deeper into San Fernando
Valley. Los Angeles Times. June 29, 2012. Retrieved from:
http://latimesblogs.latimes.com/lanow/2012/06/orange-line-bus-extension-goes-deeper-into-san-fernando-valley.html
- Callaghan, Lisa, and Vincent, William (2007). Breakthrough Technologies Institute. A
- Cambridgeshire County Council, (2012). Cambridgeshire Guided Busway Post-Opening
User Research. September 12th, 2012. Retrieved from:
http://www.cambridgeshire.gov.uk/NR/rdonlyres/7CEF7FC4-6E0C-4F51-A7E5-8D6D3714190D/0/BuswayusersurveySpring2012.pdf
- Cervero, R. and Kang, C.D. (2011). Bus rapid transit impacts on land uses and land
values in Seoul, Korea. Transport Policy. Vol. 18, No. 1, 102-116
- Community Transit, (2005). Agency to Launch Region’s First Bus Rapid Transit System.
December 1, 2005. Retrieved from: http://www.commtrans.org/newsrelease/1140
- Community Transit, (2011). Final Two Swift Stations Open Jan. 25. January 24, 2011.
Retrieved from: http://www.communitytransit.org/newsrelease/1431
- Duke, Martin, (2010). October 2010 Swift Ridership. Seattle Transit Blog. November 30,
2010. Retrieved from:
http://seattletransitblog.com/2010/11/30/october-2010-swift-ridership/
- Federal Transit Administration (FTA), (1998). New Starts/Small Starts – Pittsburgh,
Pennsylvania/Martin Luther King Jr. East Busway Extension – Phase I. November 1998.
Retrieved from: http://www.fta.dot.gov/12304_2843.html
- Federal Transit Administration (FTA), (2003). Evaluation of Port Authority of Allegheny
County’s West Busway Rapid Transit Project. April 2003. Report No.
FTA-PA-26-7010-03.1.
- Federal Transit Administration (FTA), (2007). Troost Corridor BRT, Kansas City,
Missouri. November 2007. Retrieved from:
- Federal Transit Administration (FTA), (2012). Before and After Studies of New Starts
Projects. June 2012.
- Flyvbjerg, B. and Skamris, M. (1997). Inaccuracy of Traffic Forecasts and Cost
Estimates On Large Transportation Projects. Transport Policy, vol. 4, no. 3. July 1997,
141-146.
- Flyvbjerg, B., Skamris, M., and Buhl, S. (2002). Underestimating Costs in Public Works
Projects: Error or Lie?" Journal of the American Planning Association, vol. 68, no. 3,
Summer 2002, pp. 279-295.
- Flyvbjerg, B., Skamris, M., and Buhl, S. (2003). How Common and How Large Are Cost
Overruns in Transport Infrastructure Projects? Transport Reviews, vol. 23, no. 1,
January-March 2003, pp. 71-88.
- Flyvbjerg, B. (2005). On Measuring the Inaccuracy of Travel Forecasts: Methodological
Considerations Regarding Ramp Up and Sampling. Transportation Research A, vol. 39,
no. 6, July 2005, pp. 522-530.
- Flyvbjerg, B., Holm, M.S., and Buhl, S.L. (2005). How (In)accurate Are Demand
Forecasts in Public Works Projects? The Case of Transportation. Journal of the American
Planning Association. Vol. 71, No. 2, 131-146.
- Flyvbjerg, B. (2007). Cost Overruns and Demand Shortfalls in Urban Rail and Other
Infrastructure. Transportation Planning and Technology, vol. 30, no. 1, February 2007,
pp. 9-30.
- Freemark, Yonah, (2014). Openings and Construction Starts Planned for 2014. The
http://www.thetransportpolitic.com/2014/01/05/openings-and-construction-starts-planned-for-2014/
- Greater Cleveland Regional Transit Authority (GCRTA), (2012). Euclid Corridor
Transportation Project – Bus Rapid Transit Before and After Study. July 2012.
- Guccione, Jean (2006). MTA Will Run Orange Line Out to Chatsworth. Los Angeles
Times. September 29, 2006. Retrieved from:
http://articles.latimes.com/2006/sep/29/local/me-orangeline29
- Havergal, Chris (2013). Guided busway legal battle with BAM Nuttall settled by
Cambridgeshire County Council. Cambridge News. August 30, 2013. Retrieved from:
http://www.cambridge-news.co.uk/News/Guided-busway-legal-battle-with-BAM-Nuttall-settled-by-Cambridgeshire-County-Council-20130830105405.htm
- Hook, W., Weinstock, A. and Lotshaw, S. (2013). More Development for Your Transit
Dollar: An Analysis of 21 North American Transit Corridors. Institute for Transportation
Development & Policy (ITDP). May be downloaded at
http://www.itdp.org/library/publications/.
- Hymon, Steve (2012). Ridership on Metro makes gains in October, new records on four
lines. The Source. Los Angeles County Metropolitan Transportation Authority.
November 12, 2012. Retrieved from:
http://thesource.metro.net/2012/11/14/ridership-on-metro-makes-gains-in-october-new-records-on-four-lines/
- Jarzab, J., Lightbody, J., and Maeda, E. (2002). Characteristics of Bus Rapid Transit
Projects: An Overview. Journal of Public Transportation. Vol. 5, No. 2. Retrieved from:
- Kansas City Area Transportation Authority (KCATA), (2010). MAX Fact Sheet.
Retrieved from: http://www.kcata.org/documents/uploads/MAX_Fact_Sheet.pdf
- Kansas City Area Transportation Authority (KCATA), (2012). Kansas City’s MAX Bus
Rapid Transit System. Presentation to National Bus Rapid Transit Institute. Retrieved
from:
http://www.nbrti.org/docs/ppt/Broward%20County%20BRT%20Workshop/Kansas_City
_MAX.pdf
- Levinson, H., Zimmerman, S., Clinger, J., Rutherford, C.S., (2002). Bus Rapid Transit:
An Overview. Journal of Public Transportation. Vol. 5, No. 2. Retrieved from:
http://www.nctr.usf.edu/wp-content/uploads/2010/03/JPT-5-21-Levinson.pdf
- Metro (2003). MTA Busway Coming to the Valley MTA Kicks Off Metro Rapid
Transitway Project in San Fernando Valley. January 17, 2003. Retrieved from:
http://www.metro.net/news/simple_pr/mta-busway-coming-valley-mta-kicks-metro-rapid-tra/
- Munguia, Martin, (2010). Swift, vanpool ridership rise as overall ridership falls.
Community Transit Blog. March 17, 2010. Retrieved from:
http://communitytransit.blogspot.com/2010/03/swift-vanpool-ridership-rise-as-overall.html
- Munguia, Martin, (2012). Three Years Already? That’s Swift! Community Transit Blog.
November 29, 2012. Retrieved from:
http://communitytransit.blogspot.com/2012/11/three-years-already-thats-swift.html
- Munguia, Martin, (2013). Improvements Ahead as Swift Turns 4. Community Transit
http://communitytransit.blogspot.com/2013/11/improvements-ahead-as-swift-turns-4.html
- National Transit Database (NTD), (2002 and 2012). NTD Transit Profiles. Retrieved
from: http://www.ntdprogram.gov/ntdprogram/profiles.htm
- National Transit Database (NTD), (2010 and 2013). NTD Transit Profiles. Retrieved
from: http://www.ntdprogram.gov/ntdprogram/profiles.htm
- Nelson, J.D. and Deng, T. (2010). The Impact of Bus Rapid Transit on Land
Development: A Case Study of Beijing, China. World Academy of Science, Engineering
and Technology. Vol 42, 1182-1192.
- Rodríguez, D.A. and C.H. Mojica. (2009). Capitalization of BRT network expansions
effects into prices of non-expansion areas, Transportation Research Part A, Vol. 43, No.
5, 561-575.
- Transport for NSW, (2012). State Transit Annual Report 2011-12. Retrieved from:
http://www.statetransit.info/publications/STA%20Annual%20Report%202011_12-1.pdf
- Transportation Research Board (TRB), (2001). Pittsburgh, Pennsylvania South, East, and
West Busways. Retrieved from:
http://onlinepubs.trb.org/onlinepubs/tcrp/tcrp90v1_cs/Pittsburgh.pdf
- Vincent, Bill, (2004). Breakthrough Technologies Institute. Bus Rapid Transit: The US
Experience. November 2004. Retrieved from:
http://www.reconnectingamerica.org/assets/Uploads/bestpractice206.pdf
- Vuchic, V. (1992). Urban Passenger Transportation Modes. Public Transportation.
- Weinstock, Annie; Hook, Walter; Replogle, Michael; and Cruz, Ramon, (2011). Institute
for Transportation and Development Policy. Recapturing Global Leadership in Bus Rapid
Transit, A Survey of Select U.S. Cities. May 2011. Retrieved from:
https://go.itdp.org/display/live/Recapturing+Global+Leadership+in+Bus+Rapid+Transit