FUNCTIONAL IMPACT OF OBESITY OR INTERMITTENT FEEDING ON INTESTINAL STEM CELLS
Amanda Taren Mah
A dissertation submitted to the faculty at the University of North Carolina at Chapel Hill in partial fulfillment of the requirements for the degree of Doctor of Philosophy in the Department of Nutrition in the Gillings School of Global
Public Health.
Chapel Hill 2015
ABSTRACT
Amanda Taren Mah: Functional impact of obesity or intermittent feeding on intestinal stem cells (Under the direction of P. Kay Lund)
Intestinal stem cells (ISCs) and progenitors constantly renew the intestinal epithelium. Effects of obesity or intermittent feeding specifically on ISCs versus progenitors are not defined. This dissertation used Sox9-EGFP reporter mice to test the hypothesis that obesity or intermittent feeding affects proliferation, numbers or intrinsic function of ISCs. Sox9-EGFP mice permit specific evaluation of ISCs or progenitors by histology or flow cytometry and intrinsic function in culture. High fat diet feeding induced obesity and hyperinsulinemia. ISC numbers and proliferation were selectively increased in obese mice. However, ISCs from obese mice exhibited impaired intrinsic function based on reduced ability to survive and generate enteroids in vitro. Excess insulin or IGF1 corrected this in vitro defect indicating that ISCs from obese mice develop acquired dependence on elevated insulin or IGF1 for survival or proliferation.
Sox9-EGFP mice were subjected to 20 weeks of an intermittent fasting regimen involving alternating days
of ad libitum access to food or fasting (ADF). ADF reportedly produces similar benefits to metabolism or health as
calorie restriction. Total food intake and activity did not differ between ADF and ad libitum fed controls. Despite this, ADF mice did not gain body weight and displayed significantly lower fat mass and fasting plasma triglycerides. ADF did not alter ISC number, but affected numbers of intestinal progenitors. After a fast cycle, ADF animals displayed increased progenitors but decreased proliferation, relative to short-term fasted controls. This effect was reversed in ADF animals following a feed cycle suggesting that ADF leads to fasting-induced increases in progenitors that can be rapidly mobilized during feeding. After a fast cycle, ADF animals displayed decreased colonic epithelial cell proliferation associated with increased expression of an anti-proliferative insulin receptor isoform B implicated in protection against colon tumorigenesis.
ACKNOWLEDGEMENTS
First, I would like to thank my mentor Dr. P. Kay Lund. She has provided me with the knowledge, tools and confidence to be a great scientist by giving me independence when I wanted it and advice when I needed it. She constantly challenges and encourages me to think innovatively. She is an incredible mentor and brilliant scientist and it has been an honor to work with and learn from her.
from writing our proposals, to submitting our papers at the same time, and writing and defending together. Thank you for your help in the lab and your friendship outside the lab. Thank you for being my human calculator, for carrying the bag of diet to and from the mouse room for me, for helping me with mouse sacs, epithelial isolations, protein extractions and everything in between. Thank you for always letting me bounce ideas off of you and for taking much needed coffee breaks with me. Thank you to all the undergraduates who have come through the lab, especially Hannah and Jenny for your contributions to my projects, and to Adeola for always offering a helping hand with genotyping and any last minute experiments.
Finally, I would like to acknowledge Kirk McNaughton and Ashley Ezzell at the Cell Biology and
PREFACE
Chapter 2 of this work was published in Endocrinology in 2014. Authors contributed to the work in the following manner. A. T. Mah designed, conducted and analyzed majority of experiments, wrote manuscript, L. Van Landeghem designed, conducted, analyzed and contributed to writing manuscript, H. E. Gavin conducted and analyzed morphological measurements, S. T. Magness provided input on project and experimental design and oversaw high-throughput gene expression experiments, P. K. Lund oversaw studies, provided intellectual input and participated in all aspects of analyzing data and preparation of manuscript.
Chapter 3 of this work is in preparation for submission. The following authors contributed to this work: Amanda T. Mah, Laurianne Van Landeghem, R. Eric Blue, Elaine M. Glenny, Jennifer T. Wajahn, M. Agostina Santoro, and P. Kay Lund. Specific author contributions to this work are as described. A. T. Mah designed,
conducted and analyzed majority of experiments and wrote manuscript. L. Van Landeghem designed and conducted flow cytometry experiments. R. E. Blue assisted with tissue harvest and epithelial isolations. E. M. Glenny
performed gene expression experiments and monitored mouse feedings. J.T Wajahn performed morphological measurements, M. A. Santoro performed epithelial isolations and assisted with mouse feedings. P. K. Lund oversaw all studies and analyses and contributed to the writing of the manuscript.
TABLE OF CONTENTS
LIST OF TABLES ... xii
LIST OF FIGURES ... xiii
LIST OF ABBREVIATIONS ... xv
CHAPTER 1: AN INTRODUCTION TO THE INTESTINE, INTESTINAL STEM CELLS, OBESITY, HYPERINSULINEMIA, INTERMITTENT FEEDING, AND NUTRIENT DIGESTION AND ABSORPTION ...1
Structure and function of the intestine ...1
The intestinal epithelium ...1
Intestinal stem cells (ISCs) ...2
Signaling networks required for ISC maintenance comprise the ISC niche and control cell fate specification ...3
Notch pathway ...4
Wnt pathway ...4
Bmp pathway ...6
Differentiated cells of the intestinal epithelium ...6
Absorptive enterocytes ...6
Goblet cells ...6
Paneth cells ...7
Enteroendocrine cells (EECs) ...7
Defining ISC biomarkers: in vivo and in vitro methods to evaluate stemness ...7
Label retention ...7
In vivo lineage tracing ...8
In vitro enteroid formation ...8
Generating ISC reporter mouse models to study ISC in vivo ...9
ISC reporter mouse models ...9
Obesity, hyperinsulinemia and insulin resistance ...11
Obesity and the intestine ...12
Obesity and nutrient absorption ...12
Obesity and intestinal hormones ...13
Obesity and intestinal permeability ...13
Obesity and intestinal inflammation ...14
Obesity and intestinal microbiota ...14
Obesity and changes in intestinal epithelial morphology ...15
Alternate day fasting and intermittent feeding diets ...15
Overview of the insulin and IGF system ...17
Ligands and receptors of the insulin/IGF system ...17
Metabolic actions of insulin ...18
Insulin and IR in intestinal growth and cancer ...19
Role of insulin and IR isoforms in the intestine ...20
Effect of IGFs on intestinal growth ...20
IGFs and IGF1R in intestinal cancer ...21
Nutritional regulation of insulin and IGF1 ...22
Nutrition and the intestinal epithelium ...22
Lipid digestion and absorption ...22
Carbohydrate digestion and absorption ...23
Protein digestion and absorption ...23
Nutrition and intestinal epithelial growth ...24
Hypotheses and questions addressed ...24
Figures and Tables ...26
CHAPTER 2: IMPACT OF DIET-INDUCED OBESITY ON INTESTINAL STEM CELLS: HYPERPROLIFERATION BUT IMPAIRED INTRINSIC FUNCTION THAT REQUIRES INSULIN/IGF1 ...45
Introduction ...45
Discussion ...51
Materials and Methods ...53
Figures and Tables ...58
CHAPTER 3: ALTERNATE DAY FASTING SELECTIVELY ALTERS INTESTINAL PROGENITOR POOL ASSOCIATED WITH DECREASED INTESTINAL PROLIFERATION WITHOUT REDUCTION IN FOOD INTAKE ...67
Introduction ...67
Results ...69
Discussion ...71
Materials and Methods ...74
Figures and Tables ...78
CHAPTER 4: EFFECTS OF OBESITY AND INTERMITTENT FEEDING ON ISCs AND PROGENITORS: SIGNIFICANCE, POTENTIAL MECHANISMS AND FUTURE DIRECTIONS ...86
Intestinal epithelium adaptation to obesity and hyperinsulinemia ...86
Selective expansion and proliferation of ISCs and decreased Paneth and goblet cells in obesity ...86
Paneth cells and ISC function ...87
Potential impact of reduced Paneth and goblet cells in DIO ...88
Mechanisms underlying obesity associated ISC hyperproliferation ...88
Cytokines and adipokines ...89
ER stress ...90
Obesity, proliferation and cancer risk ...90
Obesity, ISC hyperproliferation and cancer ...91
Role of the intestinal microbiota in proliferation ...91
Obesity, microbiota and ISC proliferation ...92
Intestinal adaptation to intermittent feeding ...93
Effect of ADF on ISCs, progenitors and intestinal proliferation in jejunum ...93
Effect of ADF on colonic epithelium ...93
Mechanisms underlying decreased proliferation in ADF animals ...94
Insulin and IGF1 and ADF ...94
ADF, decreased proliferation and cancer ...95
Metabolic adaptations to ADF ...95
The intestinal microbiota in ADF: effects on metabolism and proliferation ...96
Microbiota changes in ADF mice that promote carbohydrate digestion ...96
Microbiota changes in ADF mice associated with decreased intestinal proliferation ...97
Significance and Conclusions ...98
Figures and Tables ...99
LIST OF TABLES
Table 1.1: mRNAs or proteins enriched in different small intestinal and colonic epithelial cell types that
serve as biomarkers ...28
Table 1.2: Summary of select ISC reporter mouse models ...34
Table 1.3: Effects of alternate day fasting (ADF) on fasting glucose, insulin and IGF1 levels in animals ...37
Table 1.4: Effects of alternate day fasting (ADF) on fasting glucose and insulin in humans ...38
Table 1.5: Tissue specific effects of insulin by macronutrient ...40
Table 2.1: Measures of intestinal morphology and morphometry in diet-induced obesity (DIO) ...59
Table 3.1: Plasma metabolic parameters in ADF vs. control mice ...79
Table 3.2: Intestinal weight and length measurements in ADF vs. control mice ...81
LIST OF FIGURES
Figure 1.1:Histological representation of the layers of the mammalian intestine. ...26
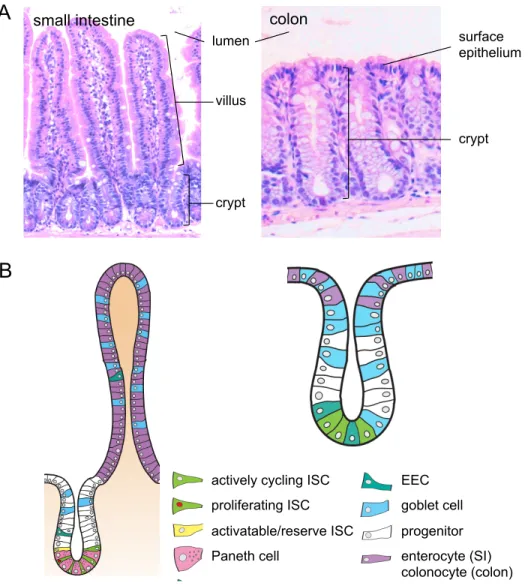
Figure 1.2: Structure and cell types of the small intestinal and colonic epithelium. ...27
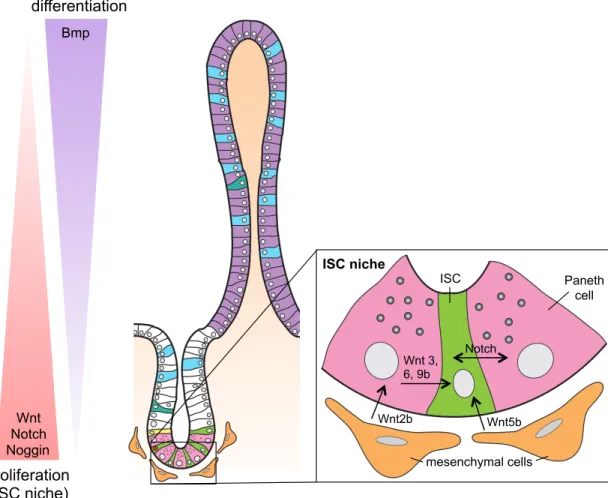
Figure 1.3: Signaling pathways present along crypt/villus axis control ISC maintenance, proliferation and differentiation. ...29
Figure 1.4: Wnt and Notch pathways control ISC maintenance and cell fate specification. ...30
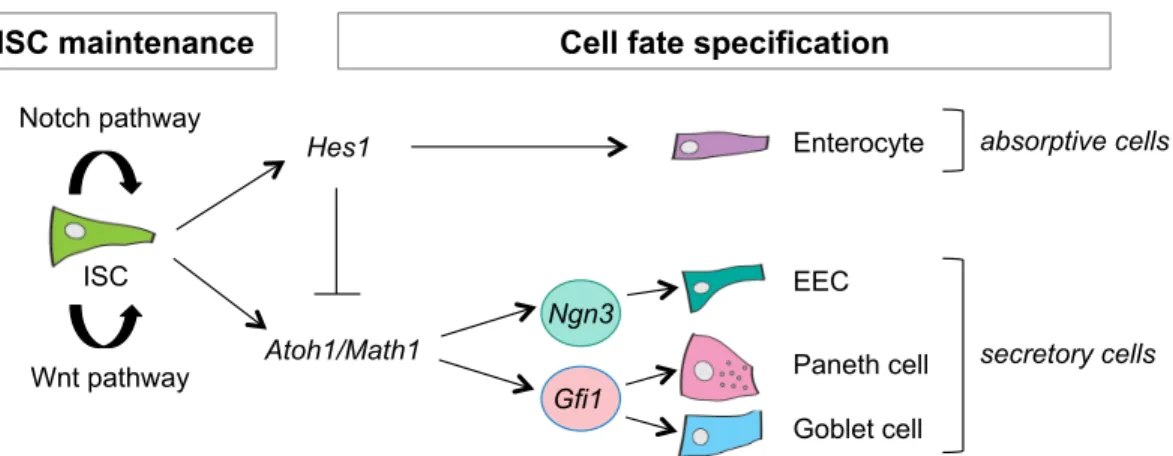
Figure 1.5: Signaling pathways involved in ISC maintenance and cell fate specification. ...31
Figure 1.6: Methods for identifying stem cells. ...32
Figure 1.7: Isolated ISCs form enteroids with time in vitro. ...33
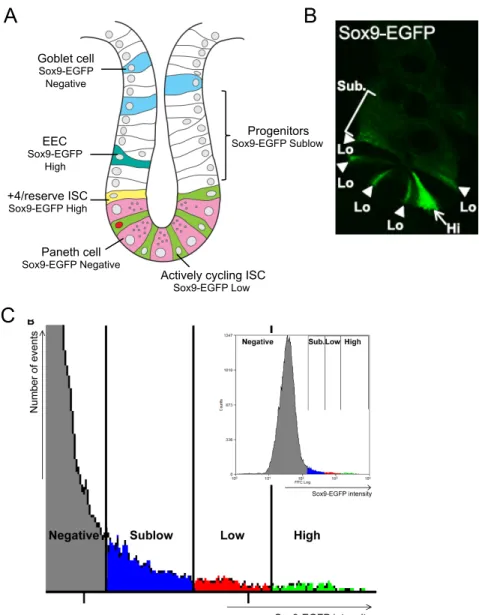
Figure 1.8: Sox9-EGFP reporter gene expression marks different intestinal epithelial cell populations. ...35
Figure 1.9: Insulin signaling in normal and obese states. ...36
Figure 1.10: IR and IGF1R are tyrosine kinase receptors involved in growth and metabolism ...39
Figure 1.11: Differential expression of the insulin/IGF1 pathway in the intestine. ...41
Figure 1.12: Lipids are absorbed by small intestinal enterocytes and repackaged into chylomicrons for distribution to peripheral tissues. ...42
Figure 1.13: Carbohydrate absorption by enterocytes. ...43
Figure 1.14: Intestinal adaptation to obesity and alternate day fasting involves changes in ISC number, proliferation and function. ...44
Figure 2.1: High fat diet feeding for 20 weeks increases body weight and fat mass leading to diet- induced obesity (DIO), elevated plasma glucose, insulin and IGF1 levels. ...58
Figure 2.2: Increases in villus height, crypt density, ISC number and proportion of ISC in S-phase in DIO versus control mice. ...61
Figure 2.3: Decreased Paneth and goblet cells but no change in EECs in DIO mice versus controls. ...62
Figure 2.4: Sox9-EGFP Low ISCs from DIO mice are enriched for appropriate biomarkers and show elevated cyclin D1 mRNA. ...63
Figure 2.5: Sox9-EGFP Low ISCs from DIO mice exhibit reduced enteroid-forming ability. ...64
Figure 2.6: Plasma insulin positively correlates with percentage of Sox9-EGFP Low ISCs and treatment of ISC from DIO mice with insulin, IGF1 or both rescues decreased intrinsic in vitro function. ...65
Figure 2.7: Proposed model of impact of DIO on ISC number, function and crypt-villus homeostasis. ...66
Figure 3.1: ADF prevents weight gain while decreasing fat and plasma triglycerides despite no change in food intake. ...78
Figure 3.3: ADF decreases jejunal crypt depth and increases non-proliferating progenitor pool following
a fast cycle. ...82
Figure 3.4: ADF increases colon crypt depth and cell number but decreases proliferation. ...83
Figure 3.5: Decreased proliferation associated with increased IR-B in colon. ...84
Figure 3.6: Progenitors are highly adaptive to feed and fast cycles in ADF animals to maximize food absorption. ...85
Figure 4.1: Diet-induced obesity (DIO) selectively expands number of total and proliferating ISCs. ...99
Figure 4.2: Obesity favors enterocyte lineage by increasing Notch signaling in ISCs and progenitors. ...100
Figure 4.3: Proposed mediators of ISC hyperproliferation in obesity. ...101
Figure 4.4: ISC hyperproliferation can increase risk of tumor formation. ...102
Figure 4.5: ADF improves body mass and maintains body weight while decreasing intestinal proliferation. ...103
Figure 4.6: Increased absorption efficiency in intestines of ADF animals. ...104
LIST OF ABBREVIATIONS
2-MG sn-2-monoglyceride
ADF Alternate day fasting
ALPI Alkaline phosphatase, intestinal
ANOVA Analysis of variance
AOM Azoxymethane
APC Adenomatosis polyposis coli
ATOH1/MATH1 Atonal homolog 1
BAC Bacterial artificial chromosome
BMI Body mass index
BMI1 Bmi1 polycomb ring finger oncogene
BMP Bone morphogenetic protein
BMPR1a Bone morphogenetic protein receptor, type 1A BMPR2 Bone morphogenetic protein receptor, type II
BRDU 5-Bromo-2´-Deoxyuridine
CAZymes Carbohydrate active enzymes
CBC Crypt base columnar
CCK Cholecystokinin
CE Cholesterol ester
CKI Casein kinase I
CR Calorie restriction
CRC Colorectal cancer
CSC Colon stem cell
CSL CBF-1/RBP-Jκ, Su(H), Lag-1
DAG Diacylglycerol
DAPI 4', 6-diamidino-2-phenylindole
DIO Diet-induced obesity
DSS Dextran sodium sulfate
EDU 5-Ethynyl-2´-deoxyuridine
EEC Enteroendocrine cell
EGF Epidermal growth factor
EGFP Enhanced green fluorescent protein ELISA Enzyme-linked immunosorbent assay
ER Endoplasmic reticulum
FACS Fluorescence activated cell sorting
FFA Free fatty acid
FZD Frizzled homolog
GFI1 Growth factor independent 1
GFP Green fluorescent protein
GH Growth hormone
GIP Glucose-dependent insulinotropic peptide
GLP-1 Glucagon-like peptide 1
GLP-2 Glucagon-like peptide 2
GSK3β Glycogen synthase kinase 3 beta H&E Hematoxylin & eosin
HBSS Hank’s balanced salt solution
HES Hairy and enhancer of split
HFD High fat diet
HOPX HOP homeobox
IACUC Institutional Animal Care and Use Committee
IBD Inflammatory bowel disease
IGF1 Insulin-like growth factor 1
IGF1R Insulin-like growth factor 1 receptor
IGF2 Insulin-like growth factor 2
IL6 Interleukin-6
IR-A Insulin receptor isoform-A
IR-B Insulin receptor isoform-B
IR/Insr Insulin receptor
IRS-1 Insulin receptor substrate 1 IRS-2 Insulin receptor substrate 2
ISC Intestinal stem cell
LCT Lactase
LGR5 Leucine rich repeat containing G protein coupled receptor 5
LPS Lipopolysaccharide
LRC Label retaining cell
LRIG1 Leucine-rich repeats and immunoglobulin-like domains 1 LRP Low density lipoprotein receptor-related protein
LYZ Lysozyme
MAPK Mitogen activated protein kinase
MRI Magnetic resonance imaging
MTERT Mouse telomerase reverse transcriptase MTTP Microsomal triglyceride transport protein
MUC2 Mucin-2
NFκB Nuclear factor kappa B
NGN3 Neurogenin 3
NICD Notch intracellular cytoplasmic domain
OCT Optimal cutting temperature medium
OLFM4 Olfactomedin 4
PBS Phosphate buffered saline
PFA Paraformaldehyde
PI3K Phosphatidylinositol 3-kinase
RER Respiratory exchange ratio
RT-PCR Reverse transcription polymerase chain reaction
SCFA Short chain fatty acid
SEM Standard error of the mean
SIM Sucrase isomaltase
SOCS Suppressor of cytokine signaling
TG Triglyceride
TGFβ Transforming growth factor, beta
TLR Toll-like receptor
TNFα Tumor necrosis factor alpha
TPN Total parenteral nutrition
TRF Time restricted feeding
CHAPTER 1: AN INTRODUCTION TO THE INTESTINE, INTESTINAL STEM CELLS, OBESITY, HYPERINSULINEMIA, INTERMITTENT FEEDING, AND NUTRIENT DIGESTION AND
ABSORPTION
Structure and function of the intestine
The gastrointestinal tract functions to digest and absorb incoming nutrients and to act as a barrier blocking harmful toxins, commensal bacteria or pathogens present in the lumen from entering the bloodstream. Anatomically, the gastrointestinal tract is divided into the esophagus, stomach, small intestine and colon. This dissertation focuses on the small intestine and colon, as these are the major sites of nutrient and fluid absorption. Figure 1.1 shows histology of the intestine to illustrate the mucosa (epithelium, lamina propria and muscularis mucosa) and underlying submucosa and muscle layers (circular and longitudinal muscle). Neuronal plexi lie between the
submucosal and muscle layer (Meissner’s plexus) or between the inner circular and outer longitudinal muscle layers (Myenteric plexus). This dissertation focuses on the intestinal epithelium, the innermost lumenal monolayer of epithelial cells lining both the small intestine and colon, responsible for mediating nutrient and fluid absorption and barrier function.
The intestinal epithelium
goblet and enteroendocrine cells (EECs). Once on the villus, the differentiated cells continue towards the villus tip where they are sloughed off in a process called anoikis. A fourth differentiated cell type, the Paneth cell, migrates down to the base of the crypt where they are intercalated between ISCs. (Figure 1.2b)
The colonic epithelium has crypts but no villi (Figure 1.2). Proliferative cells reside in the colon crypt, close to the crypt base, but not quite as uniform in location as in small intestine. As cells migrate up the colon crypt, they differentiate into colonocytes, goblet or EEC within the crypt and at the crypt surface so that surface epithelium at the crypt opening contains only differentiated cells (Figure 1.2b).
Cell types of the intestinal epithelium can be distinguished by their enrichment of specific mRNAs or encoded proteins, which is summarized in Table 1.1. The cell types and markers are discussed in further detail below.
Intestinal stem cells (ISCs)
In the small intestine, ISCs reside at or near the base of the crypt, self-renew and give rise to progenitors capable of producing all intestinal epithelial cell lineages. ISCs are responsible for continuous renewal of the epithelium. Historically, the location of ISCs in the small intestine has been debated between two schools of thought: the classic model and the stem cell zone model. The classic model proposed that ISCs reside at the +4 position of the crypt (counting up from the crypt base), identified by Potten and colleagues based on the ability of cells at this position to retain DNA label, which indicated they were slowly cycling (2), while Paneth cells and Paneth cell progenitors were thought to occupy positions 1-3 below them. The stem cell zone model states that ISCs reside at the crypt base sandwiched between Paneth cells, and are distinctly slender in shape, often referred to as crypt base columnar (CBC) cells (1). Current views on the location of ISCs have evolved since then to propose that two ISC populations exist based on location and cycling kinetics; 1) the actively cycling CBC ISCs located at the base of the crypt in between Paneth cells and 2) reserve ISCs located at the +4 position.
as Olfm4 (4). Lineage tracing has also identified biomarkers of the +4 reserve ISC. These biomarkers, which lineage traced, include Bmi1 (5), Hopx (6), mTert (7) and Lrig1 (8). Studies in markers of the reserve ISC population appear to mark different cells by position, indicating there are different types of reserve ISC enriched for specific markers. There still exists debate as to whether the expression of identified markers of reserve ISC is restricted to those cells. Transcriptomic and proteomic profiling of Lgr5+ cells by Munoz et al. revealed expression of markers of +4 reserve ISCs in the Lgr5+ population, causing them to conclude that markers of the +4 reserve ISC population are not exclusively expressed in those cells (9). However recent studies have shown that both populations are distinctly different in function. Studies ablating Lgr5+ cells through genetic disruption or radiation showed that Bmi1+ cells gave rise to Lgr5+ cells to maintain intestinal homeostasis under these conditions (10,11), which indicated for the first time that the two populations are interchangeable when necessary. While the ISC field is still changing, one current view is that the actively cycling CBC ISCs are responsible for normal epithelial renewal while the more slowly cycling reserve ISCs are activated during injury to generate CBC ISC and renew crypts (10-13).
Currently, there is less known about colon stem cells (CSCs), as they have not been as extensively characterized compared to ISCs of the small intestine. Similar to that in the small intestine, Lgr5 and Lrig1 have been shown to be markers of CSCs residing at the crypt base (3,8). However there is some debate about whether CSCs differ or differ in location in proximal versus distal colon.
The advancements in ISC biomarker discovery have now provided tools and techniques to study ISC biology during homeostasis as well as during adaptive responses to obesity or intermittent feeding. This dissertation explores the effect of obesity or intermittent feeding directly on ISC, which was not possible before.
Notch pathway
The Notch pathway consists of five Notch ligands (Dll1, 3, 4, Jagged-1, 2) and four Notch receptors (Notch1-4). In the intestine, Notch1, Notch2, Dll1, Dll4 and Jagged-1 are expressed in epithelial cells of the crypt, while Notch3 and Notch4 are expressed in the surrounding endothelial and mesenchymal cells (15-17). Notch signaling occurs between adjacent interacting cells so that membrane bound ligands of one cell bind to membrane bound receptors on a neighboring cell (Figure 1.5a). Interaction between ligand and receptor results in cleavage within the transmembrane domain of the receptor by γ-secretase enzymes releasing the Notch intracellular cytoplasmic domain (NICD). NICD translocates to the nucleus and binds to and activates the DNA-binding transcription factor CSL (CBF-1/RBP-Jκ, Su(H), Lag-1). Binding of the NICD-CSL complex and recruited transcriptional co-activators promotes transcription of Notch target genes (Figure 1.5a).
In the intestine, the Notch pathway plays roles in ISC maintenance, proliferation and cell fate
determination. Disruption of Notch signaling through genetic ablation or pharmacological inhibitors led to the loss of proliferative cells in the crypts, which illustrated the role of Notch in maintaining ISCs and proliferative crypt compartments in the intestine (18,19). Conversely Notch signaling is implicated in colorectal cancer (CRC) as expression of Notch ligands, receptors and downstream targets are oftentimes up-regulated in tumors (20).
In addition with loss of ISC maintenance and proliferation, disruption of the Notch pathway resulted in conversion of epithelial cells into goblet and EECs (18,19,21-23) indicating a role for Notch in regulating lineage specification (Figure 1.4). A key transcriptional target of Notch signaling is Hes1. Embryos lacking Hes1 developed excessive secretory cells at the expense of the absorptive cell lineage (24,25). It has been shown recently that other isoforms of Hes, including Hes3 and Hes5 are able to compensate for loss of Hes1 and loss of all three isoforms lead to forced differentiation to a secretory cell fate (26). Conversely, gain of function experiments showed that ectopic expression of Notch favors the absorptive cell lineage (27). Along with promoting the absorptive lineage, Hes1
simultaneously represses the secretory lineages by repressing the transcriptional activator Atoh1.
Wnt pathway
on crypt epithelial cells (28,29). Activation of Wnt signaling leads to a block on β-catenin degradation by a complex consisting of axin, adenomatous polyposis coli (APC), casein kinase I (CKI) and glycogen synthase kinase 3β (GSK3β), known as a destruction complex. Stabilized β-catenin then travels to the nucleus where it can act with the T-cell factor (TCF) family of transcription factors to turn on expression of Wnt target genes (Figure 1.5b). The Wnt pathway is involved in cell proliferation, cell differentiation and maintenance of ISCs.
Wnt signals occur in a gradient with the most concentrated area found at the crypt base where Wnt producing mesenchymal and Paneth cells reside (30) (Figure 1.3). Wnt signaling is essential for the maintenance of ISCs. Deletion of Tcf7l2 gene (encodes TCF4 protein) resulted in the loss of ISCs with an epithelium consisting of differentiated villus cells (31) and genetic deletion of β-catenin led in crypt ablation (32). Inhibition and
overexpression studies have shown the Wnt pathway in regulating proliferation. Overexpression of Wnt inhibitor
Dickkopf-1 blocked cell proliferation (33,34) while overexpression of Wnt agonist R-spondin1 lead to
hyperproliferation (35). Wnts regulate maintenance and proliferation of CBC ISC but have also been shown to act on Paneth cells to promote maturation (29). Due to its role in cell proliferation, Wnt signaling is implicated in a wide range of cancers, especially sporadic CRC (36). Inactivating mutations in APC account for 85% of sporadic CRC cases and leads to stabilization and nuclear translocation of β-catenin, which results in constitutively active Wnt signaling (36,37).
Similar to the Notch pathway, in addition to ISC maintenance, Wnt signaling also plays a role in cell differentiation. Wnt target gene Atoh1 (also referred to as Math1) is a transcription factor that directs intestinal progenitors to the secretory lineage (Figure 1.4). Impaired Wnt signaling decreased Atoh1+ progenitors and resulted in intestines containing predominantly absorptive enterocytes (31,32,34). Animals with intestine specific deletion of
Atoh1 displayed increased absorptive enterocytes at the expense of secretory cell lineages (38,39) while intestine
specific Atoh1 overexpression promoted secretory cell fate (40). Transcription factors regulated by Atoh1 further direct cells toward a specific secretory cell type. Gfi1 is downstream Atoh1 as Atoh1-/-intestines lacked of Gfi1
Bmp pathway
Bone morphogenetic protein (BMP) signaling negatively regulates the pro-proliferative actions of Wnt signaling (43). BMPs are members of the transforming growth factor beta (TGF-β) superfamily that act via BMP receptors. Bmp2 and Bmp4 ligands are expressed in a gradient along the crypt/villus axis with high levels at the villus tips in the intervillus mesenchyme and decreasing levels traveling to the crypt base. Other members of the Bmp pathway like Bmp receptors Bmpr1a and Bmpr2 and phosphorylated SMAD proteins are found in the villus compartment (43). Noggin and Gremlin-1, inhibitors of Bmp signaling, are expressed at the crypt base in order to keep Bmp signaling low and maintain high levels of Wnt signaling (Figure 1.3). Bmp signaling leads to
phosphorylation and activation of the Smad family of transcription factors (Figure 1.5c). Bmp pathway inhibition by overexpression of Noggin (44) or deletion of Bmpr1a (43) lead to ectopic crypt or polyp formation, respectively, indicating blocking the negatively regulating Bmp pathway promotes intestinal proliferation, presumably due to uncontrolled Wnt activation.
Differentiated cells of the intestinal epithelium
Absorptive enterocytes
Absorptive enterocytes comprise over 90% of the intestinal epithelial cell population. They are highly specialized, polarized cells with an apical side in contact with the lumen and a basolateral side in contact with the bloodstream. The apical membrane contains a brush border enriched with specific brush border enzymes that are responsible for the final steps of digestion of some nutrients (i.e. disaccharides and peptides) and for absorption of nutrients and transport through the enterocyte into the circulation (blood/lymphatics). For this reason, brush border enzymes such as alkaline phosphatase (Alpi), sucrose isomaltase (Sim) and lactase (Lct) are useful markers of enterocytes (Table 1.1).
Goblet cells
intestinal epithelium. Genetic deletion of mucins or genes involved in producing mucins resulted in increased bacterial adhesion, inflammatory cytokines and colitis (45,46). This suggested a role for goblet cells in protecting the host against lumenal contents such as microbes.
Paneth cells
Paneth cells, named after Josef Paneth, are situated in between CBC ISCs. Paneth cells contain large granules making them histologically distinct cells. They secrete many peptides that are vital to intestinal epithelial homeostasis including antimicrobial peptides and proteins that comprise the ISC niche. Their secreted antimicrobial peptides such as lysozyme and defensins (termed cryptidins in mice) mediate two main functions: innate immunity to protect the host from pathogens and to modulate or shape the intestinal microbiota (47). Mice with compromised Paneth cell function or genetic deletion of Paneth cells experienced bacterial translocation (48,49) and altered microbial communities (50). Paneth cells can be readily visualized by hematoxylin and eosin (H&E) staining, but its secretions such as lysozyme (Lyz) and defensins/cryptidins (such as Defa1) are used as markers for identification (Table 1.1).
Enteroendocrine cells (EECs)
EECs are hormone-secreting cells present in both the crypt and villus of the small intestinal epithelium and colonic crypts. In the small intestine, EECs comprise ~1% of the total epithelial population. Although small in number, there are up to 15 different types of EECs that differ in location and hormone(s) secreted (51). Hormones secreted by EECs regulate intestinal motility, bicarbonate release, enzyme secretion, appetite, insulin release and nutrient uptake (52).
Defining ISC biomarkers: in vivo and in vitro methods to evaluate stemness
Label retention
In vivo lineage tracing
Lineage tracing is a method to identify progeny of single cells and is now considered a gold standard for defining ISC biomarkers. Lineage tracing requires a conditional knock-in mouse in order to control and visualize progeny of putative ISCs. Using the Cre-lox system, a CreERT2 element is inserted downstream the promoter of the gene of interest and crossed with a reporter mouse containing a transcriptional stop sequence flanked by loxP sites upstream the reporter. Upon tamoxifen administration, Cre recombinase will remove the transcriptional stop and turn on the reporter gene in cells expressing Cre, permanently marking cells expressing the gene of interest. Progeny will inherit the reporter expression and can be visualized at different time points. Since ISCs give rise to all cells of the intestinal epithelium, lineage tracing of true ISC biomarkers result in all cells expressing the reporter and is characteristically seen as ribbons of positive cells (Figure 1.6b).
In vitro enteroid formation
Generating ISC reporter mouse models to study ISC in vivo
Putative ISC biomarkers were validated using methods described above to demonstrate stemness and multipotency, through the use of genetically engineered mouse models expressing reporter genes driven by the promoter for the gene of interest. There are different ways to engineer mice expressing a fluorescent marker or other reporters that mark gene expression; these include transgenic or a knock-in mouse models.
Transgenic mice have a segment of DNA introduced into the genome that is normally not present. For larger segments, DNA must be packaged into a vector such as a bacterial artificial chromosome (BAC). Large DNA sequences (up to 300kb) can be inserted into a BAC vector. This is then injected into oocytes, where it randomly integrates into the genome, resulting in embryos that carry the recombinant gene. Since the DNA integrates randomly, the transgene may or may not fully recapitulate the endogenous protein of interest.
Knock-in mice avoid the problem of random integration that occurs in transgenic mouse models. To generate knock-in mice, cells expressing a targeting vector containing the transgene are introduced into a mouse embryo and implanted into a surrogate female mouse. Knock-in reporter models are targeted downstream of the promoter for the gene of interest, therefore reporter expression is found in cells expressing that gene. For example,
in Bmi1-EGFP reporter mice, the Bmi1 promoter is driving EGFP expression, therefore only cells expressing Bmi1
will express EGFP. In conditional knock-in animals, permanently turning on expression of the transgene can be controlled and therefore used to perform lineage tracing experiments as described above.
ISC reporter mouse models
The majority of ISC reporter mice are knock-in animals and some contain a conditional CreERT2 element required to perform lineage-tracing experiments. Table 1.2 summarizes key ISC biomarkers and reporter animals generated to study ISC. The different reporter models have gained more attention recently due to single-cell analyses in various reporter models assessing the heterogeneity in the cell populations being marked. Briefly, Li et al
compared different knock-in reporter animals and found that reporter or inducible reporter animals of the same gene (i.e. Bmi1-EGFP and Bmi1-CreERT2) marked different cells, indicating the reporter animal used is an important factor when pursuing ISC studies (55).
Sox9-EGFP mouse model
Currently no single ISC reporter is ideal as none of the models described above is validated as marking both CBC ISCs and +4 reserve ISCs, and there is evidence for interconversion between the two ISC subtypes (10,11). The Sox9-EGFP model has some potential advantages in this regard. In the Sox9-EGFP mouse model, a BAC transgene containing a large amount of flanking gene regulatory elements of the Sox9 gene drives expression of EGFP. In the intestines of Sox9-EGFP mice, distinct levels of Sox9-EGFP mark different intestinal epithelial cell types (56,57). Figure 1.8a depicts the cell types corresponding to Sox9-EGFP expression levels in the small
intestine. High level expression (Sox9-EGFP High) mark cells dramatically enriched for expression of all known gastrointestinal hormones and known markers of EECs and these same cells are enriched for markers of the +4 reserve ISCs (13,56,57). This suggests that this population of cells contain both EECs and +4 reserve ISCs. Direct evidence that Sox9-EGFP High cells contain +4 reserve ISCs stems from findings that they exhibit functional characteristics of ISC in vitro but only after activation by radiation induced epithelial damage (13). Low Sox9-EGFP levels (Sox9-EGFP Low) correspond to the actively cycling CBC ISC. The evidence for this was high-level
expression of Lgr5, the first validated ISC biomarker, observed in this population and the ability of Sox9-EGFP Low cells (and no other Sox9-EGFP population) from “normal” small intestine to generate enteroids containing all differentiated lineages in vitro (56,57). Sox9-EGFP Sublow cells mark the rapidly dividing progenitor population while cells negative for Sox9-EGFP correspond to Paneth cells, goblet cells and enterocytes (13,56,57).
ISC population. The LRCs in this model expressed transcripts associated with Paneth cells, EECs and ISCs and were able to form enteroids following radiation. They concluded secretory precursors are able to acquire ISC-like
characteristics when activated by radiation (12).
ISC mouse models using fluorescent reporter expression such as EGFP are valuable tools to assess and use ISC for downstream applications. In the Sox9-EGFP reporter mouse, we are able to use EGFP intensity to visualize Sox9-EGFP Low and High cells by immunofluorescence, quantify all four populations of cells, including ISC, by flow cytometry and isolate all populations by fluorescence activated cell sorting (FACS) (Figure 1.8b-c). Isolated cells can then be used to assess gene expression changes or cultured in vitro to study intrinsic function. One limitation of the Sox9-EGFP model is the inability to perform lineage tracing because Sox9 is expressed in other cells at different levels. Despite this, we are able to use the Sox9-EGFP reporter mouse to evaluate the effects of obesity and intermittent feeding directly on ISC and other intestinal epithelial cell populations.
Obesity, hyperinsulinemia and insulin resistance
Obesity is defined as a body mass index (BMI) > 30kg/m2. Although rates of obesity have started to level off in the United States, prevalence remains high with about 35% of the adult population considered obese (59). Causes of obesity are highly complex, involving interactions between genetics, environment and multiple organs. Evolutionarily, humans store nutrients as fat and utilize their fat stores for energy production in times of nutrient restriction. However, in the past decades, the increase in calorie-dense foods combined with decreased physical activity has lead to increased obesity rates. Obesity is associated with increased fat accumulation and enlargement of multiple fat depots and results in or increases risk of a host of metabolic disorders. Increased prevalence of obesity has been associated with increases in insulin resistance and type 2 diabetes (59,60). Insulin resistance is marked by high levels of insulin (hyperinsulinemia) relative to glucose levels and is due to reduced ability of insulin-sensitive tissues to respond to insulin. Pancreatic β cells therefore produce more insulin to maintain normal blood glucose levels. However if insulin resistance is not remedied, over time, β cells start to fail leading to the inability to produce insulin and subsequent inability to control plasma glucose and the development of type 2 diabetes occurs.
of IRS proteins promotes downstream activation of phosphoinositide-3-kinase (PI3K) or mitogen-activated protein kinase (MAPK) pathways. Signaling through PI3K activates AKT/PKB to regulate the metabolic effects of insulin signaling such as promoting glucose uptake by GLUT4 translocation to the plasma membrane, glycogen and protein synthesis and suppressing gluconeogenesis. Signaling through MAPK is involved in transcriptional regulation of genes involved in promoting cell growth (Figure 1.9).
There are a number of mechanisms linking obesity and hyperinsulinemia to insulin resistance and type 2 diabetes, many involving disruptions in the insulin-signaling pathway (Figure 1.9). Inflammatory cytokines and factors that promote inflammatory cytokine production are implicated in impaired insulin signaling (61-63).
During obesity, there is increased macrophage infiltration in adipose tissue, increased plasma endotoxins such as lipopolysaccharides (LPS) and increased FFA and FFA metabolites such as diacylglycerol (DAG), and all increase production of pro-inflammatory cytokines (62). Inflammatory pathways activated by pro-inflammatory cytokines promote serine phosphorylation of IRS-1 rendering it inactive. Pro-inflammatory cytokines can also induce expression of suppressors of cytokine signaling (SOCS) proteins. SOCS3 can interfere with insulin signaling by binding to and preventing IRS-1 from docking onto IR (64) (Figure 1.9). Interestingly, the lipogenic functions of insulin are preserved despite defective insulin-stimulated glucose clearance, so that hepatic and muscle lipogenesis increases leading to increased ectopic TG storage.
Obesity and the intestine
The effect of obesity has been commonly studied in metabolic and insulin-sensitive tissues such as liver, adipose tissue and skeletal muscle. There is increasing attention on the role of the intestine in obesity due to its role in nutrient absorption and barrier function, as well as increased interest in the intestinal microbiome.
Obesity and nutrient absorption
The intestine functions to digest and absorb ingested food. More detailed descriptions of macronutrient digestion and absorption can be found in later sections. Despite its functions, not much is known about the effect of obesity on nutrient absorption. Transcriptomic analysis on different regions of the small intestine revealed
fate determination revealed obesity modulates expression of transcription factors associated with decreased secretory lineage allocation and increased absorptive cells (66). A limitation of these studies was that gene
expression was analyzed in the total epithelium, which is composed of >90% absorptive enterocytes. Thus genes or transcription factors expressed in enterocytes could be over-represented and any diet-associated change in relative enterocyte mass could indirectly impact levels of mRNAs expressed in enterocytes or less abundant cell types. This dissertation addresses this limitation by using the Sox9-EGFP mouse model to more directly evaluate the effect of HFD-induced obesity on specific cell types.
Obesity and intestinal hormones
EECs secrete hormones that regulate appetite and satiety and are a heterogeneous population, meaning different cells secrete different hormones. Up to 15 hormones exist and act to increase insulin production and regulate appetite and intestinal growth. Their complexity is too great to give a comprehensive overview of each hormone however key hormones are addressed. Glucagon like peptide 1 (GLP-1) and glucose-dependent insulinotropic peptide (GIP) are incretins that promote insulin synthesis and secretion by pancreatic β-cells. Cholecystokinin (CCK) is a hormone released in response to food intake that mediates digestion and satiation. Glucagon like peptide 2 (GLP-2) is another EEC hormone generated from the same mRNA as GLP-1, however GLP-2 functions in intestinal growth via insulin-like growth factor 1 (IGF1). Studies in animals have shown that obesity decreased plasma levels of GLP-1 and CCK (67-69) and increased plasma levels of GLP-2 (70). Changes in EEC hormones during obesity is further highlighted in studies that have shown hormonal levels can change
following gastric bypass surgery or weight loss (71,72). Modulating intestinal hormone levels through exogenous administration is currently being tested as potential treatments for obesity.
Obesity and intestinal permeability
Obese mice display increased intestinal permeability as measured by the ability of non-digestable
increased liver TG and hepatic insulin resistance (61). Some studies suggest however that LPS is not required for development of HFD-induced glucose intolerance (75). It is unknown whether the loss of barrier function in obesity is due to improper intestinal epithelial renewal carried out by ISC. Exploring the effects of obesity directly on ISC will to link obesity to ISC function, renewal and intestinal permeability.
Obesity and intestinal inflammation
Obesity is characterized by a state of low-grade inflammation. Our lab demonstrated that intestinal inflammation occurs prior to HFD induced increases in body weight or plasma insulin levels. In the intestine, mRNA levels of the pro-inflammatory cytokine Tnfα was up-regulated in the ileum of animals fed HFD for 6 weeks, preceding significant changes in body weight. The degree of TNFα mRNA increase was positively correlated with weight gain, fat mass, plasma insulin and plasma glucose levels (76). Furthermore, HFD-induced intestinal inflammation, measured by NFkB activation, was detected in a variety of cell types in the intestine, including intestinal epithelial cells, immune cells and endothelial cells, indicating that multiple cell types are able to contribute to HFD-induced inflammation (76). Additionally, mesenteric fat surrounding the intestine of obese animals
displayed increased expression of inflammatory cytokines and macrophage infiltration (77). Studies in humans have been less conclusive with contradicting reports of differences in fecal inflammatory markers between lean and obese patients (78-81). Increased inflammation can be linked to changes in intestinal function including altered or reduced barrier integrity and may modulate the intestinal microbiota.
Obesity and intestinal microbiota
The intestinal microbiota consists of trillions of microorganisms that interact collectively to impact host health by regulating various functions including immunity/host defense and harvesting energy from ingested food. The genome of these organisms is termed the microbiome. Microbiota and their associated microbiome can change in response to a number of factors including environment (i.e. antibiotics) or nutrition (i.e. obesity) and in
of any microbes and maintained in a sterile environment, are protected from diet-induced obesity (DIO) (76,89), providing evidence that microbes are required for HFD-induced increases in fat mass at least in mouse models tested. Current research is now focusing on understanding how specific bacterial subtypes or species contribute to obesity and associated metabolic consequences. Akkermansia mucinphilia, a mucin degrading bacteria, has gained increased attention in the past few years and is inversely correlated to body weight in mice and humans (90,91). A.
mucinphilia increases with metformin treatment (92), a drug used to improve insulin sensitivity in type 2 diabetes.
Everard et al demonstrated that A. mucinphilia administration via prebiotics or oral gavage reversed obesity
associated increases in fat mass, adipose tissue inflammation and fasting hyperglycemia (90). Together, these studies provide evidence for the role of the intestinal microbiota or specific bacterial species in obesity associated
pathologies. One potential confounder in studies of DIO is a potential influence of low fiber intake or levels in obesogenic diets. Fiber is a non-digestable carbohydrate that is metabolized to short chain fatty acids (SFCA) such as butyrate by the microbiota. Butyrate has been shown to be anti-tumorigenic in the colon (93,94). Current views are that fiber is protective, particularly in the pathogenesis of intestinal inflammation and CRC (94,95). Our studies of mice with DIO aimed to test if existing obesity and hyperinsulinemia, indicative of insulin resistance, affected ISCs. Our studies did not address the impact of microbiota or fiber, but these are interesting future directions.
Obesity and changes in intestinal epithelial morphology
Surprisingly, there are a limited number of studies exploring the effect of obesity on intestinal epithelial morphology. In animal models, obesity increased villus height associated with increased villus cell number and crypt cell proliferation (70,96,97), presumably as an adaptation to increase intestinal absorptive capacity. However there is no direct evidence on the effect of obesity on ISCs, the cells responsible for repopulating the epithelium, which is important since improper epithelial renewal may lead to intestinal dysfunction. The Sox9-EGFP reporter model allows for interrogation of the effects of DIO on ISCs to provide direct evidence for the role of ISCs in DIO associated increases in villus height observed in previous studies.
Alternate day fasting and intermittent feeding diets
non-consecutive days of CR and five days of ad libitum eating a week, is gaining popularity among humans. The overall principle of these diets is complete (true ADF) or partial CR (modified ADF) on a subset of days during the week, rather than consistent restriction of calorie intake everyday. The popularity of this type of diet stems from the difficulty to adhere to constant CR (98,99), which is defined as 20-40% restriction of calories without malnutrition every day (100,101). The reported beneficial effects of CR require sustained and long-term adherence to the diet, which many humans cannot achieve. Rodent and human studies of ADF or intermittent feeding have increased in the past few years and indicate benefits in weight loss, improved metabolism, and factors involved in cardiovascular disease and cancer risk, although with some variability across studies or between rodents and humans. Table 1.3 and Table 1.4 summarize findings from select ADF studies in animals (Table 1.3) and humans (Table 1.4) on body weight and fasting glucose, insulin and insulin-like growth factor 1 (IGF1) levels. Studies in animals have yielded mixed results regarding the effect of ADF to reduce body weight, but metabolic benefits of ADF occur in the absence of weight loss (102-107). Several human trials in ADF or intermittent feeding have shown reductions in body weight in overweight/obese subjects. Overweight subjects that completed a 3-week ADF intervention decreased their body weight by 3% (108), while an 8-week study of modified ADF where subjects were 80% CR every other day lost 8% of their body weight (109). ADF has been shown to decrease fasting glucose and insulin levels in animals, similar to that seen in CR (Table 1.3) (102,107). Human studies have produced mixed results on improving fasting glucose and insulin in normal weight subjects however ADF appears to be more effective at lowering fasting plasma glucose and insulin levels in overweight and obese subjects (Table 1.4) (103,108,110-114).
Along with its effects on body weight and metabolic parameters, there is evidence that ADF potentially has anti-tumorigenic effects. Animal studies coupling dietary restriction and a carcinogen/mutagen or tumor cell xenografts revealed that intermittent feeding (including ADF) increased survival and decreased tumor number and size (115,116). It has been speculated that the beneficial effects of intermittent feeding on tumorigenesis is due to decreased proliferation. Varady et al. reported that ADF decreased proliferation of T-cells and prostate cells and this was associated with decreased levels of circulating IGF1 (105). ADF has also been shown to decrease proliferation rates of mammary epithelial cells and keratinocytes (117). Taken together, these findings suggest that ADF may confer a protective effect on tumorigenesis by decreasing cell proliferation
time each day. In these studies, mice were allowed access to food only for 8-hours during the dark cycle, which is the normal nocturnal feeding period for a mouse. TRF using HFD produces similar outcomes as standard chow when measuring metabolic parameters such as body weight, body composition, insulin, leptin and cholesterol indicating the diet timing may be more important than diet composition. Mice subjected to longer term TRF displayed similar benefits (119). The effects of TRF were associated with changes in the intestinal microbiota including decreases in Lactobacillus and Lactococcus, both of which have been associated with increased body fat and obesity associated metabolic disruptions (120).
Although more research needs to be completed in this area, it appears that ADF or other intermittent or restricting feeding regimens may be beneficial in promoting weight loss and reduced fat, improved glucose and insulin homeostasis and reduced cell proliferation associated with changes in the gut microbiome. Although ADF alters the intestinal microbiota, its impact on the intestinal epithelium or ISCs has not been addressed. A recent study by Yilmaz et al. reported long-term CR increases ISC number, ISC proliferation and decreased progenitor
proliferation (121). Based on these findings and the similarities between CR and ADF, our current study tested the hypothesis that ADF and associated changes in insulin levels will impact ISC and progenitors associated with changes in intestinal growth using the Sox9-EGFP reporter mouse model.
Overview of the insulin and IGF system
The insulin/IGF system is composed of multiple signaling ligands and receptors that mediate different actions including growth, apoptosis and metabolism in various tissues throughout the body. This section will describe the ligands and receptors that make up the insulin/IGF system and their effects on the body, including known effects on the intestine.
Ligands and receptors of the insulin/IGF system
The insulin/IGF system is composed of three ligands (insulin, IGF1 and IGF2) with differing affinities to bind two receptors (IR or IGF1 receptor (IGF1R)). IGF1 and IGF2 are produced at very high levels in the liver but both are produced in other, if not all non-hepatic tissues. In the liver, IGFs are expressed at high levels in
Both IR and IGF1R consist of an extracellular ligand binding α-subunit and a transmembrane tyrosine kinase β-subunit joined by disulfide bonds (Figure 1.10a). IR and IGF1R are highly homologous and differences are mainly located in their extracellular domain indicating functional differences lie in their ligand binding affinities. IGF1R is expressed in a wide variety of tissues to mediate the growth and anti-apoptotic effects of IGFs (129). IR exists in two functionally distinct isoforms, IR isoform A (IR-A) and IR isoform B (IR-B). Production of the two IR isoforms occurs through alternative splicing of IR pre-mRNA to promote the exclusion (IR-A) or inclusion (IR-B) of exon 11. Current views are that classical metabolic effects of insulin occur through IR-B signaling while IR-A mediates the growth effects of insulin (Figure 1.10b). IR is expressed in metabolically active, insulin-target tissues at high levels such as adipose tissue, liver and skeletal muscle and expression ratio favors IR-B. Lower, but detectable expression of IR exists in many tissues that are not considered targets of insulin action such as the brain and pancreas (130).
Insulin and IGFs bind their own receptors preferentially but do cross-react with each other’s receptors at differing affinities. Insulin can bind both IR-A and IR-B. IGF1 and IGF2 can bind the IGF1R, however IGF2 can bind IR-A, providing dual sources for growth signaling through IR-A (Figure 1.10b).
Metabolic actions of insulin
The common actions associated with insulin are its effects on metabolism and is summarized in Table 1.5. Insulin is an anabolic hormone that is produced by β-cells of the pancreas in response to nutrient intake and its metabolic activities include regulation of glucose, lipid and protein metabolism.
Following ingestion of a meal, insulin levels increase and act to lower blood glucose by promoting glucose uptake and glycolysis in adipose tissue and skeletal muscle, hepatic glycogen synthesis and inhibiting hepatic glycogenolysis and gluconeogenesis. Inhibition of glycogen breakdown and gluconeogenesis occurs directly by inhibition of key regulatory enzymes in both processes as well as indirectly by decreasing gluconeogenic precursors. Insulin mediated glucose uptake occurs through translocation of glucose transporter GLUT4 to the plasma
membrane of insulin-responsive tissues. GLUT4 facilitates glucose entry into adipose tissue and skeletal muscle where glucose can undergo glycolysis to produce ATP or glycogen synthesis. Insulin also positively regulates activity of key glycolytic and glycogen synthesis enzymes.
that is transported into fat cells by GLUT4 undergoes glycolysis to generate glycerol-3-phosphate, the glycerol backbone required to produce TG. Insulin mediated stimulation of lipoprotein lipase in adipose tissue allows for the breakdown of TG from circulating chylomicrons into FFA. TG are formed through a series of enzymatic reactions between FFA and glycerol-3-phosphate and stored in adipose tissue. Along with promoting TG synthesis, insulin inhibits lipid breakdown by inhibiting hormone sensitive lipase, the enzyme required for lipolysis. Insulin increases protein synthesis and inhibits proteolysis by promoting transport of amino acids into tissue such as hepatocytes and skeletal muscle. Because of decreased gluconeogenesis, amino acids can be used to synthesize protein.
Insulin and IR in intestinal growth and cancer
In addition to its effects on metabolism, insulin can also regulate growth, including intestinal growth. Studies in intestinal resection, where 75% of the small intestine is removed, animals that received oral insulin after surgery demonstrated increased intestinal regeneration as measured by increased villus height and proliferation and decreased apoptosis associated with increased expression of IR (131-133). In vitro studies have shown that insulin treatment increases proliferation of Caco2 cells (133).
Due to its role in cell proliferation, there is increasing evidence for the role insulin and IR in cancer. Many epidemiological studies linking IR to intestinal cancers stem from the relationship that type 2 diabetics are at an elevated risk for developing CRC (134,135). In normal mucosa of humans, elevated plasma insulin and decreased apoptosis are associated with increased adenoma risk (136). Animals injected with azoxymethane (AOM), a carcinogen known to initiate colon tumors, and later given insulin injections developed a greater number of and larger tumors (137).
IR-A has been implicated as the IR isoform associated with cancer because of its role in growth and ability to bind insulin and IGF2. IR-A expression is dominant in a number of cancers including breast, lung and colon (138). Aberrant IR-A expression is observed in thyroid and breast cancer cells (130). Our lab has explored IR isoform expression in intestinal cancers. Andres et al. showed that in a panel of CRC cell lines, IR isoform
increased IR-A:IR-B ratios in the normal human rectal mucosa of patients with elevated plasma insulin predicted intestinal adenoma risk, which indicated levels of IR-A in normal tissue may also be important in assessing cancer risk (140). Although insulin does have effects on growth, IR-A also has an affinity for IGF2, which also has mitogenic properties (discussed in later sections). Therefore it is likely that insulin and IGF2 may both contribute to IR-A signaling in cancer.
Role of insulin and IR isoforms in the intestine
The intestinal epithelium expresses IR and can respond to circulating insulin. Despite this, little attention has been given to the effect of insulin and the function of IR on the intestinal epithelium. Using the Sox9-EGFP mouse model, our lab has shown that IR-A is expression is greatest in proliferative ISCs (Sox9-EGFP Low) and progenitors (EGFP Sublow), differentiated cells (EGFP Negative) express primarily IR-B and Sox9-EGFP High cells, which are composed of reserve ISCs and differentiated EECs express equal levels, consistent with the functions of the two isoforms (139) (Figure 1.11a). These data suggested IR isoforms are expressed in a gradient where IR-A is highest at the crypts where proliferative stem and progenitors reside and expression decreases up the crypt/villus axis, while the greatest IR-B expression is observed in differentiated enterocytes on the villi and expression decreases down the crypt/villus axis (Figure 1.11c).
However it is unknown how IR isoforms are altered in specific intestinal epithelial cell types during obesity and ADF. Using the Sox9-EGFP reporter mouse, we are able to address this key question by isolating Sox9-EGFP populations and assessing IR isoform expression.
Effect of IGFs on intestinal growth
IGF1 is an anti-apoptotic, pro-proliferative growth factor in many tissues, including the intestine. Animal studies mimicking overproduction of IGF1 have provided evidence for its growth promoting effects on the small intestine. IGF1 administration prevented mucosal hypoplasia due to total parenteral nutrition (TPN) and promoted epithelial growth in response following intestinal resection by increasing crypt cell proliferation and inhibiting apoptosis (141-144). IGF1 pre-treatment of rat intestinal epithelial cells attenuated apoptosis induced by reactive oxygen species (145). Studies from our lab have shown that transgene mediated IGF1 overexpression potently promoted growth of the intestinal epithelium in both small intestine and colon (146,147). IGF1 increased
proliferative crypt cells. Using the Sox9-EGFP reporter mouse, we show Igf1r expression was highest in Sox9-EGFP Low ISCs, providing direct evidence that ISCs express Igf1r and indicating ISC may be particularly sensitive or responsive to IGFs and insulin (Figure 1.11b). These data also show that Igf1r is expressed in a gradient (similar to IR-A) where ISCs express the highest levels of Igf1r and expression decreases up the crypt/villus axis, where differentiated cell types express low Igf1r mRNA (Figure 1.11c). Recent studies from our lab using the Sox9-EGFP reporter model revealed that IGF1 selectively increased the number of actively cycling Sox9-EGFP Low ISCs in uninjured intestine and during crypt regeneration. Expansion of Sox9-EGFP Low ISCs was associated with regulation of distinct gene networks by IGF1 in Sox9-EGFP Low ISCs versus Sox9-EGFP High cells (Van Landeghem et al, In revision).
IGF1 can also mediate the effects of growth hormone (GH) and GLP-2, two hormones approved or under clinical trial as enterotrophic therapies (122). GH overexpressing transgenic mice display increased circulating levels of IGF1, increased small intestinal length and increased mucosal mass, although growth effects are not as dramatic as in IGF1 overexpressing transgenic models. GLP-2 induces intestinal growth by promoting local IGF1 expression (149) in intestinal subepithelial myofibroblasts (125). IGF1R is required for GLP-2 mediated intestinal epithelial growth during refeeding after a fast (150).
IGF2 levels are high during fetal growth and development and IGF2 knockout fetuses are smaller (130). Current views are that IGF2 mediates growth during development through interactions with IGF1R and IR-A.
IGFs and IGF1R in intestinal cancer
common in cancer cell lines and human cancers (129) therefore IGF1R antagonists are prime targets for cancer therapies and are currently being tested (160).
Nutritional regulation of insulin and IGF1
Elevated levels of insulin and IGF1 are seen in obesity while decreased levels are observed during CR, indicating both can be regulated by nutritional status (161-164). Hyperinsulinemia also decreases the production of IGF binding proteins (IGFBPs) that normally bind and sequester IGFs making them unavailable to signal through their receptors. Decreased IGFBPs lead to an increase in bioavailable IGF1, further increasing IGF1 levels. Insulin and IGF1 levels are common mechanisms linking obesity associated increased cancer risk (165,166). Animal studies have shown that IGF1 administration reverses the anti-tumorigenic effect of diet restriction (167). However the effect of obesity and associated hyperinsulinemia and IGF1 on the intestinal epithelium and more directly on ISC has largely been ignored. The Sox9-EGFP reporter mouse allows us to explore expression of Igf1r, IR-A and IR-B in ISCs and other intestinal epithelial cell types during obesity and ADF to assess whether they can alter the expression in these receptors in ISC.
Nutrition and the intestinal epithelium
Lipid digestion and absorption
Lipid digestion begins in the upper small intestine and lipid digestion and absorption are typically completed by the time fecal material enters the colon. Pancreatic lipases digest TG to yield two FFA and one sn-2-monoglyceride (2-MG). Bile is essential for efficient lipid digestion and absorption. Bile emulsifies lipids into small droplets to ensure access and efficacy of lipases. Bile salts also ensure solubility of products of lipid digestion by forming micelles, which have hydrophilic regions on the outside interfacing with the aqueous portion of lumenal contents and inner hydrophobic regions where lipids reside. These structures termed mixed micelles contain FFA, 2-MG and other components such as bile salts and cholesterol. Mixed micelles then travel through a layer of mucous and an unstirred water later in order to reach the apical membrane of absorptive enterocytes on villi of the intestinal epithelium. FFA are thought to leave the micelle and enter the enterocyte by passive diffusion or via FFA
repackaged with phospholipids, fat soluble vitamins and cholesterol esters (CE) in the endoplasmic reticulum (ER). They associate with apolipoproteins and load onto nascent chylomicrons to form mature chylomicrons in the Golgi apparatus. CD36 null animals do display lipid accumulation in the intestine, indicating a role for CD36 in
chylomicron production and secretion (169). Chylomicrons travel to the basolateral membrane of the enterocyte and are released into the lymphatics (Figure 1.12b). Chylomicrons interact with lipoprotein lipase that is present on endothelial cells that line capillaries to break down TG into glycerol and FFA for entry into adipose tissue and skeletal muscle. These lipids can be used for ATP production by the process of β-oxidation or re-esterified into TG for storage. In obese states, ectopic fat accumulation can occur in non-adipose tissue such as the liver, thereby compromising proper function. Elevated insulin can promote hepatic fat accumulation, which is an unwanted consequence of obesity and associated hyperinsulinemia.
Carbohydrate digestion and absorption
About 50% of the carbohydrates ingested are in the form a starch. Starch is a polysaccharide that must be enzymatically digested prior to absorption by the intestine. Digestion begins in the mouth where salivary amylases initiate starch breakdown. This continues as food travels down to the intestine where pancreatic α amylase yields oligosaccharides. Brush border oligosaccharidases and disaccharidases further break down oligosaccharaides to generate the monosaccharides: glucose, galactose and fructose. Transporters exist on the apical membrane of enterocytes to facilitate monosaccharide absorption. The sodium-linked glucose transporter (SGLT1) facilitates glucose and galactose uptake while GLUT5 is responsible for fructose entry into the enterocyte. GLUT2, located on the basolateral membrane, facilitates transport of all three monosaccharides out of the enterocyte into the interstitial space and then the bloodstream (Figure 1.13). Glucose can then be used by peripheral tissues to generate ATP for energy or can be stored as glycogen in the liver or other tissues including kidney and skeletal muscle. In the case of high carbohydrate intake, excess glucose is converted to acetyl-CoA and used to synthesize lipids and stored as fat.
Protein digestion and absorption
bloodstream without further hydrolysis. Transporters located on the basolateral membrane move proteins out of the enterocyte and into circulation and transport protein into the enterocyte for cell maintenance.
Nutrition and intestinal epithelial growth
Intestinal epithelial growth can be regulated by the presence of absence of lumenal nutrient. During TPN or fasting, where the intestinal tract is deprived of nutrient, result in mucosal atrophy associated with decreased mass of the small intestinal mucosa and epithelial lining, decreased proliferation and increased apoptosis in the crypts and reduced villus height (170-175). The effects of TPN or fasting can be quickly reversed with refeeding, indicating that the intestinal epithelium is highly responsive and quick to adapt to changes in lumenal content. The changes in mucosal architecture due to fasting or TPN are associated with changes in plasma levels and local expression of IGF1 and GLP-2, positive regulators of intestinal growth (170-175). In Drosophila, fasting results in reduced n ISC numbers and proliferation and refeeding reverses these effects (176,177). Although some studies have examined effects of obesity on mucosal mass and crypt/villus homeostasis, direct effects of obesity on ISCs were not defined and are addressed in this work. A second area of study was to examine ADF, a diet similar to CR, that may have opposite effects of obesity, on ISCs and overall changes in crypt/villus homeostasis, as this diet is becoming increasingly popular and emerging evidence suggest it ADF or other intermittent feeding diets can be a clinically relevant alternative to CR.
Hypotheses and questions addressed
This work examined the effect of obesity or ADF on ISCs using both in vivo and in vitro approaches. Based on previous work, we set forth the following central hypothesis: The intestine will adapt to obesity or ADF and associated changes in insulin levels by regulating ISC number, ISC proliferation, intrinsic ability to survive in culture or to differentiate (Figure 1.14).
Specific questions to address this hypothesis include:
1. Does HFD induce obesity and hyperinsulinemia in Sox9-EGFP animals?
2. Does DIO increase ISC number, proliferation and change number of Paneth, goblet and EECs? 3. Is ISC intrinsic function, assessed by survival and enteroid forming efficiency, altered during DIO? 4. Are effects of DIO linked to the insulin/IGF pathway?
7. Does ADF affect intestinal crypt/villus morphology?
Figures and Tables
Figure 1.1:Histological representation of the layers of the mammalian intestine.
The intestine contains an inner mucosa layer composed of the epithelium (facing the lumen), underlying lamina propria and muscularis mucosa, a submucosal layer and muscle layer composed of an inner circular and outer longitudinal muscle layer.
epithelium
lamina propria
muscularis mucosa
submucosa
inner circular muscle
outer longitudinal muscle
A
mucosa