C L I M A T O L O G Y 2017 © The Authors, some rights reserved; exclusive licensee American Association for the Advancement of Science. Distributed under a Creative Commons Attribution NonCommercial License 4.0 (CC BY-NC).
Reconstructed storm tracks reveal three centuries of
changing moisture delivery to North America
Erika K. Wise* and Matthew P. Dannenberg
Moisture delivery to western North America is closely linked to variability in the westerly storm tracks of mid-latitude cyclones, which are, in turn, modified by larger-scale features such as the El Niño–Southern Oscillation system. Instrumental and modeling data suggest that extratropical storm tracks may be intensifying and shifting poleward due to anthropogenic climate change, but it is difficult to separate recent trends from natural variability because of the large amount of decadal and longer variation in storm tracks and their limited instrumental record. We reconstruct cool-season, midlatitude Pacific storm-track position and intensity from 1693 to 1995 CE using existing tree-ring chronologies along with a network of newly developed chronologies from the U.S. Pacific Northwest, where small variations in storm-track position can have a major influence on hydroclimate patterns. Our results show high interannual-to-multidecadal variability in storm-track position and intensity over the past 303 years, with spectral signatures characteristic of tropical and northern Pacific influences. Comparison with reconstructions of precipitation and tropical sea surface temperature confirms the relationship between shifting drought patterns in the Pacific Northwest and storm-track variability through time and demon-strates the long-term influence of El Niño. These results allow us to place recent storm-track changes in the context of decadal and multidecadal fluctuations across the long-term record, showing that recent changes in storm-track intensity likely represent a warming-related increase amplified by natural decadal variability.
INTRODUCTION
Changes in moisture delivery to western North America are largely controlled by the position of the midlatitude storm track in which cool-season, extratropical cyclones are embedded (1,2). There is a great deal of interannual and interdecadal variability in the average path and intensity of these cyclones (3–5), which deliver the winter precipitation vital to the region’s water supply (6). Flow is typically from the west in a zonal pattern, but shifts between zonal and merid-ional flow have been identified as key features in hydroclimatic vari-ability over the instrumental period, influencing drought and flood regimes across North America (7,8).
Because of the role that storm tracks play in midlatitude climate variability, any sustained shift in position or intensity will result in significant impacts on regional precipitation (1). Models generally project that midlatitude storm tracks will migrate poleward under current climate change scenarios (9), with an accompanying pole-ward shift in precipitation (10,11). However, atmospheric features, such as storm tracks, have been difficult to reproduce accurately in cli-mate models (12), and opposing influences on storm-track position in the Northern Hemisphere under global warming scenarios make mod-el predictions difficult (13). Significant increases in storm-track in-tensity detected over the second half of the 20th century (3,4,14–16) have been linked to warming Northern Hemisphere temperatures (15) and Pacific sea-surface temperatures (SSTs) (16) but may have been overestimated because of biases in the data sets from which the trends were derived (17).
Anthropogenic impacts on storm-track latitude and intensity have been difficult to establish, owing to the considerable variability exhibited by storm tracks over multiple time scales (4,5,13) and the limited instrumental record, which is not considered reliable before the 1950s due to changes in the density of surface observations (17). The extended
proxy climate record available from tree rings and other paleoclimate recorders provides insights into the range of variability in hydroclimatic systems over multiple centuries (18,19), allowing recent changes to be placed into the context of longer-term variability. Although most fre-quently used for the reconstruction of individual climate variables, such as precipitation and temperature, the tree-ring record has also shown utility for investigating multivariate, synoptic-scale circulation features (20,21).
The U.S. Pacific Northwest (PNW) provides an excellent opportu-nity for reconstruction of storm tracks due to the placement of the north-south–oriented Cascade mountain range relative to the prevail-ing westerly storm-track trajectory. Over the instrumental period, shifts in storm-track position have had a strong impact on hydroclimatic patterns in this region (22,23), where the spatial distribution of precip-itation is primarily driven by orographic enhancement (2), and small variations in storm-track position can lead to major disruptions in snowpack and streamflow (23,24). Modulation of storm tracks (and consequently precipitation patterns) over the PNW has been connected to the El Niño–Southern Oscillation (ENSO) system over the instru-mental period (22,23,25), but the extent of the relationship between tropical SST and storm tracks is still widely debated (26). Instrumental period studies have indicated that a large portion of storm-track varia-bility, including the 20th century increase in storm-track intensity, is unrelated to changes in ENSO (3,4,14,26).
Here, we have developed seven new multicentury tree-ring chronol-ogies using a circulation-based field sampling strategy. This tree-ring network was augmented with existing tree-ring chronologies and used to reconstruct the position and intensity of the midlatitude, westerly storm track, which represents the primary large-scale moisture-delivery pathway to the PNW, from 1693 to 1995 CE. We then investigated linkages between storm tracks and terrestrial hydroclimate patterns in the preinstrumental period and used a tropical SST reconstruction developed from coral and ice core records to examine the long-term ENSO connection to storm tracks. Through these analyses, we provide a baseline for understanding recent and projected storm-track changes and their links to the tropical Pacific.
Department of Geography, University of North Carolina at Chapel Hill, Chapel Hill, NC 27599, USA.
RESULTS
Over the instrumental period, moist air from the Pacific has typically approached from the southwest rather than the west during El Niño years (22). The resulting reduction in orographic effects leads to drier conditions over much of the PNW but also decreases the rain shadow effect in central Washington on the leeward side of the Cascades (22,23,25). We established seven tree-ring field sites around the Columbia River Basin in Washington, USA, where moisture-sensitive trees can reflect shifting rain shadow effects as storm-track trajectories interact with mountain barriers (Fig. 1A). The chronologies developed from these sites ranged from approximately 400 to 600 years in length, with all sev-en chronologies considered robust [subsample signal strsev-ength (SSS) (27) greater than 0.85] by 1693 CE (fig. S1). Our study focuses on the October-to-March cool season, when synoptic-scale storm-track activ-ity is strongest (1,2). To calibrate our reconstruction model, we derived instrumental-period average cool-season storm-track position and in-tensity by calculating the maximum variance in the daily meridional component of wind at 300 hPa after application of a first-difference fil-ter (28,29). This Eulerian approach, in which storm tracks represent regions with frequent baroclinic waves and associated surface cyclones, has been found to accurately identify the region of high cyclone fre-quency and the orientation of the propagation path of the synoptic tran-sients (1) and has the advantage of providing synoptic-scale insight into the dynamics behind storm-track variability (30).
We reconstructed storm-track position and intensity from 1693 to 1995 CE along longitudinal transects from 150°W to 110°W using a composite-plus-scale method (CPS) (31) that incorporates the seven new chronologies along with existing chronologies from the Interna-tional Tree-Ring Data Bank (ITRDB) (Fig. 1B). Reconstruction skill was robust between 136°W and 124°W (fig. S2), and we use storm track over these longitudes for subsequent analyses. The seven new PNW tree-ring chronologies developed for this study improved the coefficient of efficiency of the storm-track position reconstruction models for 95% of longitudes falling between 136°W and 124°W by an average of 58% re-lative to models that included only ITRDB chronologies. To assess long-term variation in the position of the storm track, we fit a straight line using ordinary least squares regression to the reconstructed storm track between 136°W and 124°W (fig. S3). We used the latitude of the linear
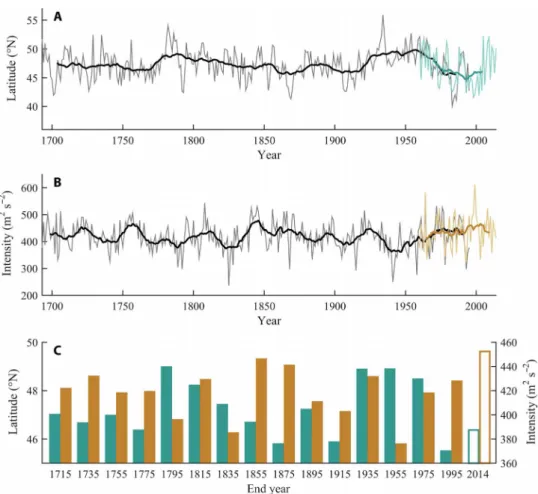
storm track at 124°W longitude (which approximates the western coast of the PNW) for assessment of long-term variation in storm-track posi-tion. Reconstructed storm-track intensity was measured by the maxi-mum average October-to-March meridional wind variance at 124°W. Both of the resulting reconstructions display substantial interannual and interdecadal variability over time but no systematic trends over the past three centuries (Fig. 2 and fig. S4). However, there was an in-crease in storm-track intensity over the 56-year instrumental period (Fig. 2B) and a rapid northward movement in storm-track position over the last approximately 20 years of the instrumental record (Fig. 2A).
Using the multitaper method (MTM) of spectral analysis (32), we analyzed the dominant frequency modes in the normalized recon-structed storm-track data. The reconrecon-structed storm-track position and intensity both have significant peaks across the 2- to 8-year inter-annual“ENSO”band (fig. S5), confirming the important influence of tropical Pacific SST over multiple centuries. The reconstructed storm track also shows spectral peaks in the bidecadal (storm-track position) and pentadecadal (storm-track intensity) bands, both of which are prominent northern Pacific modes of variability (33,34). Bidecadal power, as seen in reconstructed storm-track position, has been identi-fied in Kuroshio-Oyashio Extension (KOE) SST (34,35). Heat fluxes from changes in KOE SST may act to alter atmospheric wave patterns, thereby modifying paths of storm tracks across the Pacific (35). The decadal-scale (12-year) variability in the reconstructed storm-track intensity has been linked to other cycles in the North Pacific, including ocean gyre circulation (36). Beyond North Pacific influences, pentade-cadal variability is also a signature of the Arctic Oscillation (AO), and instrumental period variability in storm-track intensity has previously been linked to changes in the AO (4,14).
The trajectory of Pacific storms is a key influence on drought in the PNW and across North America. Previous studies have suggested that major changes in spatial patterns of precipitation anomalies across western North America may have occurred during periods of persistent meridional flow driven by changes in Pacific Ocean conditions (37,38). Both storm-track position and intensity demonstrate decadal and multidecadal variability throughout the past 300 years (Fig. 2). Of par-ticular note is the early 1900s (Fig. 2), a period of more southerly storm tracks that coincides with a time of abnormally high precipitation and
Fig. 1. Circulation-based tree-ring site development and additional tree-ring site locations.(A) Black circles show locations of seven newPinus ponderosa(Ponderosa pine) tree-ring sites surrounding the Columbia River Basin in Washington, USA. We used a circulation-based field sampling strategy for developing chronologies in regions with contrasting responses to storm-track patterns. Map background shows cool-season precipitation anomalies in instrumental-period El Niño years when changing storm-track trajectories lead to reduced orographic effects and a contrasting climate response across the PNW. Precipitation data are from the Parameter-Elevation Regressions on Independent Slopes Model data set. (B) Chronologies from the ITRDB that maintain an expressed population signal of >0.85 over the time period of 1693 to 1995 CE and were tested for inclusion as predictors in the storm-track position and intensity reconstructions.
streamflow across western North America (19). The late 1920s to 1930s, in contrast, had high-intensity, north-shifted storm tracks and coin-cided with the“Dust Bowl”drought period (39,40). A previous paleo-climate reconstruction of geopotential height patterns across the North Pacific identified a change in pressure patterns in the mid-1800s, coin-ciding with the end of the Little Ice Age, which was attributed to a shift from meridional to zonal flow (21). Results from this study (Fig. 2) dicate an increase in storm-track intensity at this time, and higher in-tensity was associated with zonal flow patterns over the reconstructed time period (fig. S4D).
To further examine the relationships between storm-track trajec-tories and drought over the preinstrumental period, we compared our storm-track reconstruction with an existing gridded reconstruction of Standardized Precipitation Index (SPI) developed using tree-ring chronologies from across western North America (41). The SPI, a unit-less value expressing actual precipitation as standardized departure from the long-term probability distribution at a given time scale (in this case, 6 months), is considered particularly useful for comparisons across space (42,43). We separated out grid cells in the SPI reconstruction rep-resenting the windward and leeward sides of the Cascades (fig. S6) to examine the patterns across the region that have been linked to storm
were associated with the strong southwesterly flow that would be expected to result in decreased rain shadow effects, other years main-tained relatively zonal flow.
Shifts in storm-track trajectories into the PNW over the instru-mental period have been linked to variable ENSO conditions, with storm tracks tending to enter the PNW from the southwest in El Niño years (22). Like storm track, it is important to understand the long-term context of ENSO for characterizing the variability possible within the system and how it may respond to global warming (44). Multiple ENSO proxy reconstructions exist for these purposes, but most rely entirely or in part on tree-ring records in teleconnected regions and may reflect variability unrelated to ENSO, particularly instabilities in teleconnec-tions from the tropical Pacific (44,45). Differences between existing ENSO reconstructions might also indicate that dating errors become a factor the further back in time the record extends (44,45). Here, we compare our storm-track reconstruction with an annually resolved, NINO3.4 SST proxy reconstruction developed entirely from tropical coral and ice core records over a robust SST reconstruction period (1728 to 1995) in which uncertainties are low (44). We identified pos-itive (El Niño) and negative (La Niña) years based on ±1 SD over the annual period beginning the January before the reconstructed storm-track cool season and examined storm storm-tracks under these different ENSO conditions (Fig. 4). We further compared results using alter-native ENSO reconstructions derived from a variety of paleoclimate proxies and calibrated against a range of ENSO seasons (figs. S7 to S9 and table S2).
Although there was a wide range of storm-track trajectories in indi-vidual El Niño and La Niña years, storm tracks, on average, entered North America at lower latitudes in El Niño years (Fig. 4, figs. S7 to S9, and table S2), a pattern noted in the instrumental period (46). The trajectory of the individual storm tracks also varied between the subsets. Storm tracks during La Niña years were commonly associ-ated with northwesterly flow into North America; in contrast, El Niño years had a zonal to southwesterly flow (Fig. 4). La Niña years were consistently associated with higher-intensity storm tracks (fig. S9 and table S2). Differences between reconstructed intensity and latitude at 124°W longitude during El Niño and La Niña years were all significant between theP≤0.01 andP≤0.1 levels, depending on which ENSO reconstruction was used for comparison (table S2). The SPI pattern in El Niño years was one of primarily dry conditions across the region but
with slightly wet conditions in the interior basin (Fig. 4), similar to the pattern detected over the instrumental period (Fig. 1).
DISCUSSION
One of the key functions that paleoclimate proxy data serve in climate studies is to help separate the anthropogenic climate change signal from the background noise of natural variability. Although important for many components of the climate system, this is particularly crucial for storm tracks, which are vital for energy and moisture transport, display uncertainty in models, and have a very short instrumental record (13,17). Here, we have reconstructed the position and intensity of cool-season, midlatitude Pacific storm tracks into North America over the past three centuries with a sampling strategy designed to use the differential impacts of shifting westerly flow on precipitation patterns across the north-south–oriented Cascade Mountains. The results presented here allow us to place recent changes in the context of decadal and multidecadal variability across the long-term record. We show that storm-track intensity did increase through each 20-year period of the instrumental record but that the beginning of the instrumental record in the 1950s also coincided with a low point in the intensity cycle.
By linking SPI and storm-track trajectories across multiple centuries in this study, we gain a longer-term perspective on how changing storm tracks have altered patterns in precipitation extremes. The poleward shift and increased intensity in the storm track that have been projected by climate models (10,47) would affect the windward and leeward sides of the Cascades differently based on the results presented in this study, which showed opposing responses to changes in storm-track latitude and intensity (table S1). However, it is difficult to directly compare past hydroclimatic impacts of storm-track variability to changes that may occur because of global warming. Future changes in the distribution of midlatitude precipitation extremes will depend on multiple drivers of atmospheric moisture transport (37), and the projected increase in available moisture for storms may affect storm-track intensity and re-sulting precipitation patterns in different ways than have been observed in the past (48). Storm-track changes projected under global warming scenarios may be influenced by enhanced warming at high latitudes, leading to a decreased surface temperature gradient and alterations in low-level baroclinicity (30,48), and these changes could interact with Fig. 3. Reconstructed storm tracks during years with anomalous precipitation patterns.SPI reconstruction (37) grid cells in the PNW representing the windward and leeward response regions of the Cascades (see fig. S6) were used to calculate four patterns of interest over the period of 1693 to 1995 CE: (A) both windward and leeward sides anomalously dry (75% of grid cells in each category with SPI of≤−0.8), (B) leeward side dry (75% of grid cells with SPI of <0) and windward side wet (75% of grid cells with SPI of >0), (C) leeward side wet (75% of grid cells with SPI of >0) and windward side dry (75% of grid cells with SPI of <0), and (D) both windward and leeward anomalously wet (75% of grid cells in each category with SPI of≥0.8). Storm tracks were smoothed with a robust loess filter. See table S1 for additional data on reconstructed storm tracks for each pattern.
the quasi-barotropic patterns thought to be a primary driver of past storm-track variability (4) in complex ways. Limitations for interpreting hydroclimatic impacts also arise from our examination of storm track as an average over the cool season in this study because this approach may not fully capture the impacts of each individual extratropical cyclone. This is particularly important when considering the effects of landfalling atmospheric river storms, which have been shown to contribute a large amount of seasonal precipitation in a short period of time along the U.S. West Coast (49).
ENSO has been a major focus of research concerning variability in moisture transport due to its influence on global climate patterns in gen-eral and to western North America drought in particular. Although many modeling (5,50) and instrumental (51,52) studies suggest that ENSO is a major control on the position of midlatitude storm tracks, other studies have found little relationship between ENSO and storm-track characteristics (3,14). Here, we have added a paleoclimate dimension showing that El Niño and La Niña conditions, based on a
tropical proxy reconstruction of NINO3.4 SST and confirmed with alternative ENSO reconstructions, are associated with shifts in storm-track position and intensity over multiple centuries. The frequency analysis of reconstructed storm tracks likewise shows a clear ENSO sig-nal; however, results of this analysis also support previous instrumental-period research, suggesting that much of the variability cannot be explained by ENSO alone. Additional bidecadal spectral power in the reconstruction of storm-track latitude points to the influence of the North Pacific, possibly through the influence of KOE SST, whereas low-frequency pentadecadal variability in storm-track intensity is con-sistent with instrumental-period linkages between storm-track intensity and changes in the AO.
position is seasonally dependent within the Northern Hemisphere and is expected to be weaker in the winter (13), which could dampen the effects seen in this cool-season study. The increase in intensity over the instrumental record may represent a warming-related increase am-plified by natural decadal variability. The recent, extended instrumental-period intensity increase (Fig. 2) suggests that this change is approaching the upper bound of the natural cycle of variability. Given the potential for anomalous storm-track patterns to affect human and natural systems through changes in precipitation extremes, additional research to further investigate the drivers of storm-track changes will help advance the crit-ical goal of reducing uncertainties in future storm-track response to cli-mate change.
MATERIALS AND METHODS Chronology development
We developed seven newP. ponderosa(Ponderosa pine) tree-ring sites in contrasting climate response areas encircling the western and north-ern portion of the Columbia River Basin in Washington, USA (Fig. 1A). At each site, 30 to 45 trees were sampled. Two or more cores were taken from each tree using a 5.15-mm increment borer. In the laboratory, cores were mounted and finely sanded. Each core was dated to the cal-endar year using the established dendrochronological technique of cross-dating (53). The individual rings (total ring width) of each dated core were measured using a Velmex measuring system. After checking for dating and measurement errors using the program COFECHA (54), the cores were detrended with a cubic spline two-thirds the length of each individual series, standardized, and averaged using Tukey’s bi-weight robust mean to form site chronologies. Chronology mean sen-sitivities ranged from 0.26 to 0.33 and series intercorrelation from 0.59 to 0.71. The site chronology was considered robust when the SSS, a function of the sample size and between-tree correlation at the site, ex-ceeded a threshold of 0.85 (27). All seven chronologies obtained SSS of >0.85 for the period of 1693 to 2011 CE (fig. S1).
In addition to the seven Washington chronologies, we obtained 159 tree-ring chronologies covering a larger geographic domain from the ITRDB. We chose chronologies west of 110°W longitude and be-tween 35°N to 55°N latitude (Fig. 1B), which covers the full range of locations where the storm track entered North America during the instrumental period. The ITRDB chronologies were detrended and averaged using the same techniques as the newly developed Washing-ton chronologies and were limited to those that were robust (expressed population signal of >0.85) over a period spanning (at minimum) 1693 to 1995 CE. This time period was then used for the reconstruction.
Storm-track reconstruction
Data from the high-resolution Japanese 55-year Reanalysis (JRA-55) climate data set (55) were used to calculate calibration data for the re-construction. Trends in storm track derived from JRA-55 data over the instrumental period have been shown to be less biased than other re-analysis data sets (17). We derived average 1959-to-2014 cool-season (October to March) storm track from the monthly variance of the daily meridional component of wind (v-wind) at approximately 300 hPa after application of a first-difference filter (28,29). Annual storm-track posi-tion was calculated as the latitude of maximum v-wind variance for each longitudinal transect, and cool-season storm-track intensity was calculated as the maximum v-wind variance for each longitudinal tran-sect. We smoothed the annual storm-track positions using a robust loess filter with a 10% window length to reduce noise (fig. S3).
We reconstructed the storm-track position and intensity from 1693 to 1995 CE for each longitudinal transect from 150°W to 110°W using a CPS method. In the CPS approach, proxy time series are averaged to obtain a single index, which is then rescaled to match the mean and variance of the target climate variable over the instrumental period (31). This method has been successfully deployed to reconstruct past climate using tree rings (56,57) and multiproxy data sets (58,59). For each CPS model, we prescreened all chronologies to retain only those that were significantly correlated with the storm-track time series, performed a principal components analysis using singular value decomposition on the correlation matrix of the chronologies, and retained the first nprincipal components (PCs) that explained at least 75% of the var-iance of the tree-ring data set. We composited these PCs into a single index using a weighted average, where the weight was determined on the basis of the amount of variance explained in a linear relationship between each PC and the instrumental storm-track data. Storm-track position and intensity were then reconstructed by scaling the composite tree-ring PC index to match the mean and variance of the instrumental storm track over the instrumental period.
We assessed the quality of the reconstruction using leave-one-out cross-validation, in which each year of the instrumental period was suc-cessively withheld from model calibration and the model-predicted val-ue for that year was retained to validate the model. We evaluated the withheld storm-track position and intensity estimates using the co-efficient of determination (r2), the root mean square error, and the co-efficient of efficiency (60), each calculated over the time period of 1959 to 1995 (fig. S2). We fit a straight line (using ordinary least squares re-gression) to the reconstructed storm track over the 136°W to 124°W region and used the latitude of the linear storm track at 124°W longitude (which approximates the western coast of the PNW) to assess long-term variation in storm-track position. To evaluate the contribution that our circulation-based field sampling strategy made to this reconstruction, we calibrated CPS models of storm-track position while withholding the seven newly developed chronologies, assessed the performance of these models using leave-one-out cross-validation, and compared the ITRDB-only CPS model performance to those that included both the ITRDB and the new chronologies. We analyzed the dominant frequen-cy modes in the normalized reconstructed storm-track data using the MTM of spectral analysis in the SSA-MTM Toolkit (www.atmos.ucla. edu/tcd/ssa/), tested against a red-noise null hypothesis and reshaped to remove harmonic signals (fig. S5) (32,61).
Comparison with SPI and ENSO reconstructions
To compare the reconstructed storm track with hydroclimate patterns in the PNW, we used an existing spatial reconstruction of SPI (41) avail-able through the National Centers for Environmental Information (NCEI) paleoclimate data repository. This 6-month (October to March) SPI reconstruction is on a 0.5° × 0.5° grid across the U.S. West Coast states over the time period of 1500 to 2013 CE. We selected robustly verified (coefficient of efficiency of >0) grid points representing the windward and leeward sides of the Cascade Mountains (fig. S6) and derived four categories of hydroclimatic patterns (Fig. 3): (i) both wind-ward and leewind-ward sides anomalously dry (75% of grid cells in each category with SPI of≤−0.8), (ii) leeward side dry (75% of grid cells with SPI of <0) and windward side wet (75% of grid cells with SPI of >0), (iii) leeward side wet (75% of grid cells with SPI of >0) and windward side dry (75% of grid cells with SPI of <0), and (iv) both windward and leeward anomalously wet (75% of grid cells in each category with SPI of≥0.8). The number of years matching the criteria for each of these
categories ranged from 10 to 25 years, and each of the individual storm tracks for those years is mapped in Fig. 3. We calculated the means and SDs of reconstructed latitude and intensity at 124°W lon-gitude for each category and tested the statistical significance of the differences between groups (based on two-samplettests) and among all groups [based on analysis of variance (ANOVA) tests] (table S1). For a multicentury comparison with ENSO, we obtained a recon-struction of annual NINO3.4 SST derived from coral and ice core re-cords in the tropical Pacific region (44). We identified positive (El Niño) and negative (La Niña) years based on ±1 SD from average NINO3.4 over the annual period beginning the January before the reconstructed storm-track cool season (for example, storm track from October 1727 to March 1728 associated with NINO3.4 SST from January to December 1727), which resulted in 37 El Niño years and 43 La Niña years over the robust time interval of the reconstructions’overlap period (1728 to 1995 CE) (44). We then mapped composited SPI patterns and yearly and mean storm-track trajectories over the El Niño and La Niña years (Fig. 4). We calculated average storm-track latitude and intensity for La Niña, neu-tral, and El Niño years (defined as <−1 SD,≥−1/2 SD and≤+1/2 SD, and >+1 SD, respectively) using multiple versions of ENSO reconstruc-tions that were derived from different calibration seasons and paleo-climate proxy types (table S2), and we mapped mean storm-track trajectories over El Niño and La Niña years in one of the alternative ENSO reconstructions for comparative purposes (fig. S7). The statistical significance of ENSO differences was assessed using a two-samplettest of the null hypothesis that the El Niño and La Niña storm tracks were sampled from distributions with equal means and variances (table S2 and figs. S8 and S9).
SUPPLEMENTARY MATERIALS
Supplementary material for this article is available at http://advances.sciencemag.org/cgi/ content/full/3/6/e1602263/DC1
fig. S1. Tree-ring chronologies for seven sites in the U.S. PNW.
fig. S2. Validation statistics for the storm-track reconstruction at each longitude. fig. S3. Delineation of the storm track in an example year (1988).
fig. S4. Extremes in latitude and intensity in reconstructed storm tracks over the reconstruction period of 1693 to 1995 CE.
fig. S5. Spectral power in the storm-track reconstructions.
fig. S6. Grid cells representing windward and leeward regions across the Cascade Range. fig. S7. Storm track in La Niña and El Niño years based on an alternative ENSO reconstruction from 1693 to 1995 CE.
fig. S8. Distribution of reconstructed storm-track position in La Niña and El Niño years. fig. S9. Distribution of reconstructed storm-track intensity in La Niña and El Niño years. table S1. Reconstructed storm-track latitude and intensity in years with anomalous precipitation patterns.
table S2. Reconstructed storm-track latitude and intensity in La Niña and El Niño years based on multiple ENSO proxy reconstructions.
References (44,45,62,63)
REFERENCES AND NOTES
1. E. K. M. Chang, S. Lee, K. L. Swanson, Storm track dynamics.J. Clim.15, 2163–2183 (2002).
2. C. H. Luce, J. T. Abatzoglou, Z. A. Holden, The missing mountain water: Slower westerlies decrease orographic enhancement in the Pacific Northwest USA.
Science342, 1360–1364 (2013).
3. N. E. Graham, H. F. Diaz, Evidence for intensification of North Pacific winter cyclones since 1948.Bull. Am. Meteorol. Soc.82, 1869–1893 (2001).
4. E. K. M. Chang, Y. Fu, Interdecadal variations in Northern Hemisphere winter storm track intensity.J. Clim.15, 642–658 (2002).
5. C. C. Raible, R. Blender, Northern Hemisphere midlatitude cyclone variability in GCM simulations with different ocean representations.Clim. Dynam.22, 239–248 (2004). 6. A. F. Hamlet, P. W. Mote, M. P. Clark, D. P. Lettenmaier, Effects of temperature and precipitation variability on snowpack trends in the western United States.J. Clim.18, 4545–4561 (2005).
7. O. E. Granger, Twentieth-century climate anomaly patterns over the southwestern United States.Phys. Geogr.5, 164–185 (1984).
8. D. M. Meko, C. W. Stockton, Secular variations in streamflow in the western United States.
J. Clim. Appl. Meteorol.23, 889–897 (1984).
9. C. Mbengue, T. Schneider, Storm track shifts under climate change: What can be learned from large-scale dry dynamics.J. Clim.26, 9923–9930 (2013).
10. J. H. Yin, A consistent poleward shift of the storm tracks in simulations of 21st century climate.Geophys. Res. Lett.32, L18701 (2005).
11. E. P. Salathé Jr., Influences of a shift in North Pacific storm tracks on western North American precipitation under global warming.Geophys. Res. Lett.33, L19820 (2006). 12. D. L. Swain, D. E. Horton, D. Singh, N. S. Diffenbaugh, Trends in atmospheric patterns
conducive to seasonal precipitation and temperature extremes in California.Sci. Adv.2, e1501344 (2016).
13. T. A. Shaw, M. Baldwin, E. A. Barnes, R. Caballero, C. I. Garfinkel, Y.-T. Hwang, C. Li, P. A. O’Gorman, G. Rivière, I. R. Simpson, A. Voigt, Storm track processes and the opposing influences of climate change.Nat. Geosci.9, 656–664 (2016).
14. G. J. McCabe, M. P. Clark, M. C. Serreze, Trends in Northern Hemisphere surface cyclone frequency and intensity.J. Clim.14, 2763–2768 (2001).
15. M. D. S. Mesquita, D. E. Atkinson, K. I. Hodges, Characteristics and variability of storm tracks in the North Pacific, Bering Sea, and Alaska.J. Clim.23, 294 (2010).
16. S. Basu, X. Zhang, I. Polyakov, U. S. Bhatt, North American winter-spring storms: Modeling investigation on tropical Pacific sea surface temperature impacts.Geophys. Res. Lett.40, 5228–5233 (2013).
17. E. K. M. Chang, A. M. W. Yau, Northern Hemisphere winter storm track trends since 1959 derived from multiple reanalysis datasets.Clim. Dynam.47, 1435–1454 (2016). 18. D. Meko, C. W. Stockton, W. R. Boggess, The tree-ring record of severe sustained drought.
J. Am. Water Resour. Assoc.31, 789–801 (1995).
19. C. A. Woodhouse, K. E. Kunkel, D. R. Easterling, E. R. Cook, The twentieth-century pluvial in the western United States.Geophys. Res. Lett.32, L07701 (2005).
20. M.-P. Girardin, J. Tardif, Sensitivity of tree growth to the atmospheric vertical profile in the Boreal Plains of Manitoba, Canada.Can. J. For. Res.35, 48–64 (2005).
21. E. K. Wise, M. P. Dannenberg, Persistence of pressure patterns over North America and the North Pacific since AD 1500.Nat. Commun.5, 4912 (2014).
22. L. R. Leung, Y. Qian, X. D. Bian, A. Hunt, Hydroclimate of the western United States based on observations and regional climate simulation of 1981-2000. Part II: Mesoscale ENSO anomalies.J. Clim.16, 1912–1928 (2003).
23. E. K. Wise, Spatiotemporal variability of the precipitation dipole transition zone in the western United States.Geophys. Res. Lett.37, L07706 (2010).
24. A. F. Hamlet, D. P. Lettenmaier, Effects of climate change on hydrology and water resources in the Columbia River basin.J. Am. Water Resour. Assoc.35, 1597–1623 (1999). 25. Y. Zhang, Y. Qian, V. Dulière, E. P. Salathè Jr., L. R. Leung, ENSO anomalies over the
Western United States: Present and future patterns in regional climate simulations.
Clim. Change110, 315–346 (2012).
26. I. Orlanski, A new look at the pacific storm track variability: Sensitivity to tropical SSTs and to upstream seeding.J. Atmos. Sci.62, 1367–1390 (2005).
27. T. M. L. Wigley, K. R. Briffa, P. D. Jones, On the average value of correlated time-series, with applications in dendroclimatology and hydrometeorology.J. Clim. Appl. Meteorol. 23, 201–213 (1984).
28. R. Quadrelli, J. M. Wallace, Dependence of the structure of the Northern Hemisphere annular mode on the polarity of ENSO.Geophys. Res. Lett.29, 2132 (2002). 29. S. A. McAfee, J. L. Russell, Northern Annular Mode impact on spring climate in the
western United States.Geophys. Res. Lett.35, L17701 (2008).
30. E. K. M. Chang, Y. Guo, X. Xia, CMIP5 multimodel ensemble projection of storm track change under global warming.J. Geophys. Res. Atmos.117, D23118 (2012). 31. P. D. Jones, K. R. Briffa, T. J. Osborn, J. M. Lough, T. D. van Ommen, B. M. Vinther,
J. Luterbacher, E. R. Wahl, F. W. Zwiers, M. E. Mann, G. A. Schmidt, C. M. Ammann, B. M. Buckley, K. M. Cobb, J. Esper, H. Goosse, N. Graham, E. Jansen, T. Kiefer, C. Kull, M. Kuettel, E. Mosley-Thompson, J. T. Overpeck, N. Riedwyl, M. Schulz, A. W. Tudhope, R. Villalba, H. Wanner, E. Wolff, E. Xoplaki, High-resolution palaeoclimatology of the last millennium: A review of current status and future prospects.Holocene19, 3–49 (2009).
32. M. Ghil, M. Allen, M. Dettinger, K. Ide, D. Kondrashov, M. Mann, A. Robertson, A. Saunders, Y. Tian, F. Varadi, P. Yiou, Advanced spectral methods for climatic time series.
Rev. Geophys.40, 1003 (2002).
33. S. Minobe, Resonance in bidecadal and pentadecadal climate oscillations over the North Pacific: Role in climatic regime shifts.Geophys. Res. Lett.26, 855–858 (1999). 34. R. D’Arrigo, R. Wilson, G. Wiles, K. Anchukaitis, O. Solomina, N. Davi, C. Deser, E. Dolgova,
Tree-ring reconstructed temperature index for coastal northern Japan: Implications for western North Pacific variability.Int. J. Climatol.35, 3713–3720 (2015).
36. G. A. Meehl, J. M. Arblaster, W. G. Strand Jr., Global scale decadal climate variability.
Geophys. Res. Lett.25, 3983–3986 (1998).
37. E. R. Cook, R. Seager, M. A. Cane, D. W. Stahle, North American drought: Reconstructions, causes, and consequences.Earth Sci. Rev.81, 93–134 (2007).
38. G. T. Pederson, S. T. Gray, T. Ault, W. Marsh, D. B. Fagre, A. G. Bunn, C. A. Woodhouse, L. J. Graumlich, Climatic controls on the snowmelt hydrology of the northern Rocky Mountains.J. Clim.24, 1666–1687 (2011).
39. F. K. Fye, D. W. Stahle, E. R. Cook, Paleoclimatic analogs to twentieth-century moisture regimes across the United States.Bull. Am. Meteorol. Soc.84, 901–909 (2003). 40. B. I. Cook, E. R. Cook, K. J. Anchukaitis, R. Seager, R. L. Miller, Forced and unforced
variability of twentieth century North American droughts and pluvials.Clim. Dynam.37, 1097–1110 (2011).
41. E. K. Wise, Five centuries of U.S. West Coast drought: Occurrence, spatial distribution, and associated atmospheric circulation patterns.Geophys. Res. Lett.43, 4539–4546 (2016). 42. T. B. McKee, N. J. Doesken, J. Kleist,“The relationship of drought frequency and
duration to time scale,”inProceedings of the Eighth Conference on Applied Climatology, Anaheim, CA, 17 to 22 January 1993 (American Meteorological Society, 1993).
43. M. N. Kumar, C. S. Murthy, M. V. R. Sesha Sai, P. S. Roy, On the use of Standardized Precipitation Index (SPI) for drought intensity assessment.Meteorol. Appl.16, 381–389 (2009).
44. R. Wilson, E. Cook, R. D’Arrigo, N. Riedwyl, M. N. Evans, A. Tudhope, R. Allan, Reconstructing ENSO: The influence of method, proxy data, climate forcing and teleconnections.J. Quat. Sci.25, 62–78 (2010).
45. S. McGregor, A. Timmermann, O. Timm, A unified proxy for ENSO and PDO variability since 1650.Clim. Past6, 1–17 (2010).
46. M.-K. Sung, S.-I. An, B.-M. Kim, S.-H. Woo, A physical mechanism of the precipitation dipole in the western United States based on PDO-storm track relationship.Geophys. Res. Lett.41, 4719–4726 (2014).
47. D. J. Lorenz, E. T. DeWeaver, Tropopause height and zonal wind response to global warming in the IPCC scenario integrations.J. Geophys. Res. Atmos.112, D10119 (2007). 48. T. P. Eichler, N. Gaggini, Z. Pan, Impacts of global warming on Northern Hemisphere
winter storm tracks in the CMIP5 model suite.J. Geophys. Res. Atmos.118, 3919–3932 (2013).
49. M. D. Dettinger, Atmospheric rivers as drought busters on the U.S. West Coast.
J. Hydrometeorol.14, 1721–1732 (2013).
50. N. Berg, A. Hall, S. B. Capps, M. Hughes, El Nino-Southern Oscillation impacts on winter winds over Southern California.Clim. Dyn.40, 109–121 (2013).
51. D. M. Straus, J. Shukla, Variations of midlatitude transient dynamics associated with ENSO.
J. Atmos. Sci.54, 777–790 (1997).
52. D. R. Cayan, K. T. Redmond, L. G. Riddle, ENSO and hydrologic extremes in the western United States.J. Clim.12, 2881–2893 (1999).
53. A. E. Douglass, Crossdating in dendrochronology.J. Forest.39, 825–831 (1941). 54. R. L. Holmes, Computer-assisted quality control in tree-ring dating and measurement.
Tree-Ring Bull.43, 69–78 (1983).
55. S. Kobayashi, Y. Ota, Y. Harada, A. Ebita, M. Moriya, H. Onoda, K. Onogi, H. Kamahori, C. Kobayashi, H. Endo, K. Miyaoka, K. Takahashi, The JRA-55 reanalysis: General specifications and basic characteristics.J. Meteorol. Soc. Jpn. Ser. II93, 5–48 (2015).
56. K. R. Briffa, T. J. Osborn, F. H. Schweingruber, I. C. Harris, P. D. Jones, S. G. Shiyatov, E. A. Vaganov, Low-frequency temperature variations from a northern tree ring density network.J. Geophys. Res. Atmos.106, 2929–2941 (2001).
57. J. Esper, F. H. Schweingruber, M. Winiger, 1300 years of climatic history for Western Central Asia inferred from tree-rings.Holocene12, 267–277 (2002).
58. T. Crowley, T. Lowery, How warm was the medieval warm period?Ambio29, 51–54 (2000). 59. R. Neukom, J. Luterbacher, R. Villalba, M. Küettel, D. Frank, P. D. Jones, M. Grosjean,
H. Wanner, J.-C. Aravena, D. E. Black, D. A. Christie, R. D’Arrigo, A. Lara, M. Morales, C. Soliz-Gamboa, A. Srur, R. Urrutia, L. von Gunten, Multiproxy summer and winter surface air temperature field reconstructions for southern South America covering the past centuries.Clim. Dyn.37, 35–51 (2011).
60. E. R. Cook, D. M. Meko, D. W. Stahle, M. K. Cleaveland, Drought reconstructions for the continental United States.J. Clim.12, 1145–1162 (1999).
61. M. Mann, J. Lees, Robust estimation of background noise and signal detection in climatic time series.Clim. Change33, 409–445 (1996).
62. E. R. Cook, R. D. D’Arrigo, K. J. Anchukaitis, talk presented at a special workshop on
“Reconciling ENSO Chronologies for the Past 500 Years,”Moorea, French Polynesia, 2 to 3 April 2008.
63. M. E. Mann, E. Gille, J. Overpeck, W. Gross, R. S. Bradley, F. T. Keimig, M. K. Hughes, Global temperature patterns in past centuries: An interactive presentation.
Earth Interact.4, 1–29 (2000).
Acknowledgments:We thank the researchers who have made their data available through the National Oceanic and Atmospheric Administration NCEI/World Data Center paleoclimate website. We also thank the United States Forest Service vegetation managers and silviculturists in the Colville, Okanogan and Wenatchee National Forests for the sampling permission and site guidance.Funding:This research was supported by the NSF’s Paleo Perspectives on Climate Change (P2C2) program through grants AGS-1102757 and AGS-1304422.Author contributions:E.K.W. conceived and designed the study, collected the tree-ring data, and interpreted the study results. M.P.D. assisted with field data collection and conducted the laboratory analyses of the tree-ring cores. Both authors designed the analyses, analyzed the data, and wrote the manuscript.Competing interests:The authors declare that they have no competing interests.Data and materials availability:The gridded reconstructions used in this study are available on the NCEI paleoclimate website (www.ncdc.noaa.gov/data-access/paleoclimatology-data/datasets), which also hosts the ITRDB. These are the same locations where the storm-track reconstructions and the chronologies developed for this study will be archived. Calibration-period storm track was calculated from JRA-55 data (http://jra.kishou.go.jp/index.html). All other data needed to evaluate the conclusions in the paper are present in the paper and/or the Supplementary Materials. Additional data related to this paper may be requested from the authors.
Submitted 16 September 2016 Accepted 24 April 2017 Published 7 June 2017 10.1126/sciadv.1602263
Citation:E. K. Wise, M. P. Dannenberg, Reconstructed storm tracks reveal three centuries of changing moisture delivery to North America.Sci. Adv.3, e1602263 (2017).