BLOCK IONOMER COMPLEX FORMULATIONS FOR IN VIVO PROTEIN DELIVERY
Yuhang Jiang
A dissertation submitted to the faculty at the University of North Carolina at Chapel Hill in partial fulfillment of the requirements for the degree of Doctor of Philosophy in the Eshelman
School of Pharmacy (Molecular Pharmaceutics)
Chapel Hill 2016
Approved By: Alexander Kabanov Hong Yuan
iii ABSTRACT
Yuhang Jiang:Block ionomer complex formulations for in vivo protein delivery (Under the direction of Alexander Kabanov)
Complex coacervation between therapeutic proteins and hydrophilic ionic-neutral block-copolymers leads to the formation of core-shell structured nanoparticles gently packaging the proteins in its core (reviewed in CHAPTER 1). This kind of nanoparticle, termed block ionomer complex (BIC), has great potential as protein delivery vehicles because of its simple and non-denaturing manufacturing procedure. However, reports on in vivo application of protein BICs are not common, primarily because of their instability at physiological ionic strength. The focus of this thesis is to explore the usage of BIC as an in vivo protein delivery vehicle.
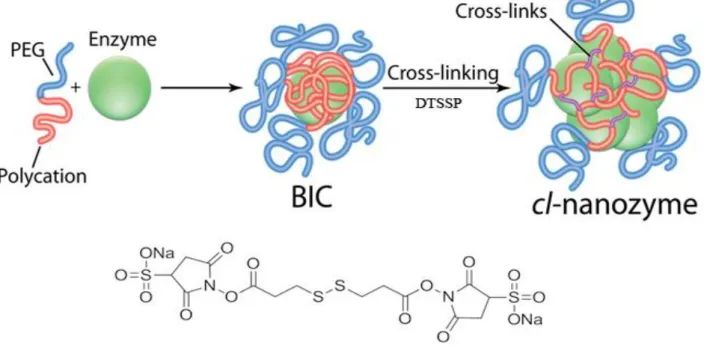
Our lab previously developed a protein BIC formulation, “SOD1 nanozyme”, formed between the protein superoxide dismutase 1 (SOD1) and the block copolymer poly(ethylene glycol)-poly(L-lysine) (PEG-PLL) followed by crosslinking with 3,3'-dithiobis(sulfosuccinimidyl propionate) (DTSSP). CHAPTER 2 examines the mechanism for SOD1 nanozyme to be effective for stroke treatment. Active incorporation of SOD1 nanozymes into the growing thrombus turns out to retain them at the vicinity of the injured sites on blood vessels after stroke.
iv
(aspartate diethyltriamine) (PAsp(DET)). This polymer is less toxic than polylysine due to its unique two-step protonation behavior, and its BIC with SOD1 has a similar size as the PLL-based SOD1 nanozyme. The therapeutic efficacy of this new formulation is also close to that of the PLL-based formulation.
v
vi
ACKNOWLEDGMENTS
I would like to express my sincere gratitude to my advisor Prof. Alexander Kabanov for his continuous support of my Ph.D. study and related research, for his patience, motivation, and immense support in all research fields I tried to explore. His guidance helped me all the time during my grad school. I could not have imagined having a better advisor for my Ph.D. study.
Besides my advisor, I also would like to thank other professors in my thesis committee: Prof. Shawn Hingtgen, Prof. Hong Yuan, Prof. William Banks, and Prof. Elena Batrakova for support, advice, and encouragement. Their insightful questions asked in my committee meetings are always very inspiring to me. Indeed, many of the important experiments I described in my thesis can find their roots in these committee meeting questions.
I would also like to thank Prof. Devika S-Manickam and Dr. Xiang Yi for their continuous support and mentorship for me during my graduate study. Devika mentored me since the first day I joined the lab when she was doing her post-doctoral training in our laboratory. She taught me almost everything I needed to know to conduct experiments independently, and even now I am still trying to become an organized professional scholar just like her. Xiang mentored me on many important techniques involved in the pharmacokinetic analysis of proteins including iodine labelling, animal surgery and serum collection. These techniques are so frequently used that I couldn’t have completed any single chapter of this
vii
facilities, and trained me how to do stroke surgery in mice. Without their precious support it would not have been possible for me to complete my two projects on formulation of SOD1 nanozyme. Indeed, my completion of graduate study would not have been possible without the help I received from my collaborators. In addition to Dr. McCullough and Dr. Verma, I also want to thank many of my collaborators in other institutions, especially Dr. William Banks and Kristin Bullock from University of Washington; Dr. Younsoo Bae and Steven Rheiner from University of Kentucky, as well as Dr. Carol Milligan and Phonepasong Arounleut from Wake Forest University.
I wouldn’t have successfully completed my graduate research projects without
collaboration and support from my fellow labmates. In specific, I want to thank Dr. Anya Brynskikh and Jimmy Fay, former and current graduate students in Kabanov lab. Anya was a senior graduate student in the lab when I joined, and my first project was actually a continuation of hers. She is very knowledgeable in neuroscience, and I learnt from her many useful techniques to conduct experiments in this field including stroke surgery in rats, immunohistochemistry, and confocal microscopy. Jimmy is a very talented graduate student in the Department of Biochemistry and Biophysics, and he rotated in our lab in 2015 before he decided to join us and work on the same project with me. Trained as a biophysicist, Jimmy offered me a lot of help by introducing a completely new set of research tools into my projects, not to mention the many in-depth discussions on complex characterization and molecular modelling experiments with him.
viii
Bregu, Mr. Nazar Filonov, and Ms. Shu Li, along with all past and present members of Kabanov Lab. I also want to thank my friends from other labs and institutions for their kind help throughout my graduate study: Dr. Hui Wang, Dr. Jing Fu, Dr. Yuan Zhang, Dr. Yuanzeng Min, Dr. Kai Wang, Mr. Jay Kim, Dr. Lei Miao, Ms. Qiaoxi Li, Ms. Yingqiu Zhou, Dr. Tojan Rahhal, Dr. Dylan Glatt, Dr. Hao Cai, Dr. Lei Peng, Mr. Jay Kim, Ms. Junghyun Lee, Ms. Xiaokun Qian, Ms. Naihan Chen, Dr. Kevin Han, Ms. Erin Wilson, Mr. Bing Yang, and Ms. Angela Yang.
My thesis work involves interdisciplinary efforts which is not possible to be conducted by a single lab. I want to express my sincere thanks to all the professors and core facility managers who have kindly allowed me to use their instruments and trained me to use them with confidence. Dr. Ashutosh Tripathy for training me on ITC, SPR, and SEC-MALS experiments; Dr. Wallace Ambrose and Dr. Amar S. Kumbhar for helping me with TEM and AFM to characterize my nanoparticles; Dr. Michael Jay, Dr. Matthew Sadgrove, and Dr. Zibo Li for kindly letting me use their gamma counters for my pharmacokinetic analysis; Dr. Bob Bagnell for his help with my confocal microscopy experiments; Dr. Hong Yuan, Mr. Jonathan Frank, and Mr. Joseph Merrill for their help with my IVIS imaging, PET imaging and autoradiography attempts in my projects.
ix PREFACE
In this thesis I report my work during my graduate study in Sasha’s lab. The focus of my research is to explore possibilities of protein formulation using BICs. CHAPTER 1 aims to provide an overview of the mechanism for proteins to bind to polyelectrolytes in the aqueous solution, and the application of this technology in the past 20-30 years. It is part of a more comprehensive review currently under preparation which will involve general discussions on the physiochemical properties of block ionomer complexes in a bigger framework.
My research was done in collaboration with many talented scientists. In CHAPTER 2, Dr. Anya Brynskikh established experimental protocols for stroke surgery in rats and immunohistochemistry used in this project. She also contributed to generate Figure 2.2, Figure 2.5, and Figure 2.6, and made significant contributions during the preparation of the manuscript for publication; Dr. Devika Manickam established the protocol for the synthesis and purification of SOD1 nanozymes, directly supervised this project, and contributed to writing. The paper was published previous to writing this thesis with the following citation:
Jiang Y, Brynskikh AM, S-Manickam D, Kabanov AV. J Control
Release. 2015 Sep 10; 213:36-44. Doi: 10.1016/j.jconrel.2015.06.021.
x
contributed to the writing of manuscript; Dr. Devika S-Manickam originated the idea and supervised the whole project. The paper was published previous to writing this thesis with the following citation:
Jiang Y, Arounleut P, Rheiner S, Bae Y, Kabanov AV, Milligan C,
Manickam DS. J Control Release. 2016 Jun 10; 231:38-49. Doi:
10.1016/j.jconrel.2016.02.038.
In CHAPTER 4, Jimmy Fay helped in several horizontal agarose gel electrophoresis experiments in this project, actively explored possible characterization experiments including Surface Plasmon Resonance, and Nanoparticle Tracking Analysis, generated Figure 4.8, and contributed to manuscript writing; Dr. Chi-Duen Poon designed and performed all the molecular dynamic modelling experiments; Yuling Zhao helped in animal handling in the PK experiments as presented in Figure 4.14, Figure 4.15, Figure 4.16, and Figure 4.18; Kristin Bullock performed the brain efflux experiments described in Figure 4.17; Dr. Devika S-Manickam contributed to early proof-of-concept experiments of Nano-BDNF formulation; Dr. Xiang Yi participated in most animal experiments, performed data analysis of all PK experiments, and actively supervised other experiments in this project for a year; Dr. William Banks provided invaluable support for iodine labelling, animal surgery, data analysis and interpretation of PK experiments.
In all the aforementioned Chapters, Dr. Alexander Kabanov provided the necessary resources for the researches to be complete, supervised and coordinated these research projects, and constantly contributed very insightful scientific advises and very challenging scientific questions which made sure the high scientific qualities of the outcomes from these projects.
xi
Institutional Development Award (IDeA) from the National Institute of General Medical Sciences of the National Institutes of Health under grant number P20GM103480;
North Carolina Institute of Translational and Clinical Sciences grant number 550KR51322; National Center for Advancing Translational Sciences award number ULTR000083; National Institutes of Health grant number R21NS08815202;
HeART Award from the International Rett Syndrome Foundation for funding;
xii
TABLE OF CONTENTS
ABSTRACT ... iii
ACKNOWLEDGMENTS ... vi
PREFACE ... ix
TABLE OF CONTENTS ... xii
LIST OF TABLES ... xvii
LIST OF FIGURES ... xviii
LIST OF ABBREVIATIONS AND SYMBOLS ... xx
CHAPTER 1 INTRODUCTION ... 1
1.1 Block Ionomer Complex ... 2
1.1.1 Formation of BIC ... 3
1.1.2 Protein BICs ... 4
1.2 Environmental effects on protein BICs ... 5
1.2.1 Ionic strength (I) ... 5
1.2.2 pH ... 6
1.2.3 Temperature ... 7
1.3 Stabilization of protein BICs ... 7
1.3.1 Chemical crosslinking ... 8
1.3.2 Charge conversion ... 10
1.3.3 Ternary BICs ... 11
1.3.4 Introducing hydrophobic interactions ... 11
1.4 Application of protein BICs ... 12
xiii
1.4.2 Enzyme delivery ... 13
1.5 Conclusion ... 14
CHAPTER 2 SOD1 NANOZYME SALVAGES ISCHEMIC BRAIN BY LOCALLY PROTECTING CEREBRAL VASCULATURE ... 16
2.1 Summary ... 16
2.2 Introduction ... 16
2.3 Materials and Methods ... 19
2.3.1 Materials. ... 19
2.3.2 Synthesis of cl-nanozyme. ... 20
2.3.3 Animals. ... 20
2.3.4 MCAO model of transient ischemic stroke in rats. ... 21
2.3.5 Histology and Immunohistochemistry. ... 21
2.3.6 Preparation of 125I-labeled Proteins and cl-nanozyme. ... 22
2.3.7 Biodistribution and Serum Clearance in Mice. ... 23
2.3.8 MCAO Model of Transient Ischemic Stroke in Mice. ... 24
2.3.9 TTC Staining and Brain Infarct Volume Quantification. ... 24
2.3.10 Thrombus Incorporation Assay in Mouse Plasma. ... 25
2.3.11 Autoradiography ... 25
2.3.12 Statistical Analysis. ... 25
2.4 Results ... 26
2.4.1 Cl-nanozyme Tissue Distribution in the Rat MCAO Model of I/R Injury ... 26
2.4.2 Cl-nanozyme Biodistribution and Serum Clearance in Mice ... 27
2.4.3 Therapeutic Effect of cl-nanozyme in Mouse MCAO Model of I/R Injury ... 28
2.4.4 Thrombus Incorporation Assay ... 28
2.5 Discussion ... 28
2.6 Conclusion ... 34
xiv
CHAPTER 3 SOD1 NANOZYME WITH REDUCED TOXICITY AND MPS
ACCUMULATION ... 48
3.1 Summary ... 48
3.2 Introduction ... 48
3.3 Materials and Methods ... 51
3.3.1 Chemicals. ... 51
3.3.2 SDS-PAGE and fluorescent labeling of SOD1 protein. ... 52
3.3.3 Synthesis of PLL and DET-based nanozymes and their catalytic activity characterization... 52
3.3.3.1 Potentiometric titration. ... 53
3.3.4 Cytotoxicity assay. ... 54
3.3.5 Preparation of 125I-labeled proteins and nanozymes. ... 55
3.3.6 Animals. ... 55
3.3.7 Biodistribution and pharmacokinetics. ... 56
3.3.8 MCAO model of ischemic stroke in mice. ... 57
3.3.9 TTC staining and brain infarct volume quantification. ... 57
3.3.10 Thrombus incorporation assay. ... 58
3.3.11 Methods for treatment of SOD1G93A mice. ... 58
3.3.12 NMJ innervation. ... 59
3.3.13 Western blots. ... 59
3.3.14 Statistical analysis. ... 60
3.4 Results ... 60
3.4.1 Analysis of nanozyme formation by SDS-PAGE. ... 60
3.4.2 Characterization of DET-based nanozyme ... 62
3.4.3 Cytotoxicity of nanozyme ... 63
3.4.4 Biodistribution and Pharmacokinetics ... 63
xv
3.4.6 Treatment of the mutant SOD1G93A mouse model of ALS ... 65
3.5 Discussion ... 66
3.6 Conclusion ... 70
3.7 Future directions ... 70
CHAPTER 4 BLOCK IONOMER COMPLEX NANOFORMULATION STABLIZES BRAIN DERIVED NEUROTROPHIC FACTOR AND INCREASES ITS DELIVERY TO THE BRAIN AFTER INTRANASAL ADMINISTRATION ... 82
4.1 Summary ... 82
4.2 Introduction ... 82
4.3 Materials and methods ... 84
4.3.1 Chemicals. ... 84
4.3.2 Preparation and characterization of Nano-BDNF ... 85
4.3.3 Dynamic light scattering (DLS) ... 85
4.3.4 Transmission electron microscopy (TEM) ... 86
4.3.5 Atomic force microscopy (AFM) ... 86
4.3.6 Horizontal agarose gel electrophoresis (HAGE) ... 86
4.3.7 Isothermal titration calorimetry (ITC) ... 86
4.3.8 Molecular dynamic (MD) simulations ... 87
4.3.9 Protein thermal shift (PTS) assay... 87
4.3.10 Radioactive labelling of BDNF ... 88
4.3.11 Cell culture and western blot ... 88
4.3.12 Animals. ... 89
4.3.13 INB administration and pharmacokinetic study. ... 89
4.3.14 BDNF efflux measurement. ... 90
4.3.15 Statistical analysis. ... 90
4.4 Results ... 90
xvi
4.4.2 Stoichiometry of the complex formation. ... 91
4.4.3 Molecular dynamics (MD) simulation of the complex formation. ... 92
4.4.4 Stability of the complexes. ... 93
4.4.5 Nano-BDNF releases active BDNF without compromising its intrinsic stability ... 94
4.4.6 Nano-BDNF significantly enhanced the delivery of BDNF to brain regions after INB administration. ... 95
4.5 Conclusion ... 98
4.6 Future directions ... 98
CHAPTER 5 SUMMERY AND FUTURE DIRECTIONS ... 120
APPENDIX I ... 122
APPENDIX II ... 129
xvii
LIST OF TABLES
Table 3.1 Characterization of native SOD1 and different formulations
of nanozymes.a b ... 80 Table 3.2 Influx rates (Ki, µl/g-min) of different SOD1 formulations into
brain, kidney, liver, and spleen during 1-70 min of exposure time after
an IV bolus of 125I-SOD1. ... 81 Table 4.1 Reference chart for the frequency levels shown in Figure 4.7
xviii
LIST OF FIGURES
Figure 2.1 Schematic representation of cl-nanozyme ... 38
Figure 2.2 Cl-nanozyme in the brain does not co-localize with neuron or activated macrophages... 39
Figure 2.3 Distribution of cl-nanozyme in the Rat Brain. ... 40
Figure 2.4 Cl-nanozyme Accumulation in the Damaged Internal Carotid Artery (ICA)... 41
Figure 2.5 H&E staining of peripheral organs of MCAO rats. ... 42
Figure 2.6 Distribution of cl-nanozyme in Rat Peripheral Organs. ... 43
Figure 2.7 Biodistribution and Serum Clearance of Native SOD1 and cl-nanozyme in healthy mice. ... 44
Figure 2.8 Therapeutic Efficacy of cl-nanozyme in Mice MCAO Model of I/R Injury. ... 45
Figure 2.9 Thrombus Incorporation Assay in Mouse Plasma... 46
Figure 2.10 Autoradiography of brain slices after IV injection of 125I labelled cl-nanozyme ... 47
Figure 3.1 SDS-PAGE analysis of DET-based nanozyme. ... 72
Figure 3.2 Protonation behavior of PEG-DET and PEG-PLL. ... 73
Figure 3.3 Characterization of DET-based nanozyme. ... 74
Figure 3.4 In vitro cytotoxicity to endothelial and neuronal cells after 24 h incubation. ... 76
Figure 3.5 Polymer properties affecting biodistribution and influx rates of nanozyme. ... 77
Figure 3.6 DET-based nanozyme reduced infarct volumes in the mouse MCAO model of ischemic stroke. ... 78
Figure 3.7 DET-based nanozyme was not effective against NMJ denervation in SOD1G93A mice. ... 79
Figure 3.8 Thrombus incorporation in mouse plasma. ... 79
Figure 4.1 Dynamic light scattering... 100
xix
Figure 4.3 Representative AFM pictures. ... 102
Figure 4.4 Horizontal agarose gel electrophoresis. ... 103
Figure 4.5 ITC measurement of complexation process between BDNF and PEG-PLE ... 105
Figure 4.6 Molecular dynamics simulation. ... 105
Figure 4.7 Binding site determination. ... 106
Figure 4.8 Identification of charge patches on BDNF and 3D density map of BDNF binding sites with PEG-PLE. ... 107
Figure 4.9 Molecular dynamics simulation of 1 BDNF molecule binding to different number of PEG-PLE chains. ... 109
Figure 4.10 NaCl and TrkB challenge studies. ... 109
Figure 4.11 Nano-BDNF protects BDNF from challenges of nasal defensive proteins, while readily releasing BDNF upon incubation with the BDNF receptors, TrkB and p75. ... 111
Figure 4.12 Protein thermal shift assay. ... 111
Figure 4.13 Densitometry quantitation of Western blots for lysates from NIH 3T3 cells stably expressing TrkB receptor. ... 113
Figure 4.14 Uptake of 125I-BDNF and 125I-Nano-BDNF in different brain regions over 30 min after IN delivery. ... 114
Figure 4.15 Nano-BDNF distribution in different brain regions after INB delivery compared to native BDNF. ... 115
Figure 4.16 Peripheral organ distribution of Nano-BDNF following INB delivery. ... 115
Figure 4.17 Inhibition of BDNF efflux from the brain to the blood. ... 116
xx
LIST OF ABBREVIATIONS AND SYMBOLS
A light absorption
AFM atomic force microscopy
AKT serine/threonine-protein kinase-1 ALS amyotrophic lateral sclerosis ANOVA analysis of variance
Asp aspartic acid
AUC area under the curve
B/S ratio brain/serum ratio
BBB blood brain barrier
BDNF brain derived neurotrophic factor
BIC block ionomer complexes
BSA bovine serum albumin
C3M complex core coacervate micelle
CB cerebellum
cl- cross-linked
CNS central nervous system
CPM counts per minute
D or Da Dalton
DAB 3, 3-diaminobenzidine
DAPI 4', 6-diamidino-2-phenylindole
Deff effective diameter
DET diethylenediamine
xxi
DMEM Dulbecco's modified eagle medium dn/dc refractive index increment
DNA deoxyribonucleic acid
DSPE 1, 2-Distearoyl-sn-glycero-3-phosphoethanolamine DTSSP 3, 3’-Dithiobis (sulfosuccinimidylpropionate)
DTT dithiothreitol
ec elementary charge
EDC 1-ethyl-3-(3-dimethylaminopropyl) carbodiimide EDTA ethylenediaminetetraacetate
ERK extracellular Signal-regulated Kinase
F fluorescence
FC frontal cortex
FPLC fast protein liquid chromatography
G Gibbs free energy
GSH glutathione
H enthalpy
H&E hematoxylin and eosin
HAGE horizontal agarose gel electrophoresis
HSA human serum albumin
HB HEPES buffer
HBS HEPES buffered saline
HC hippocampus
hCMEC/D3 human brain microvascular endothelial cell
HEPES 4-(2- hydroxyethyl)-1-piperazineethanesulfonic acid)
xxii
Huh-7 a hepatocyte derived cellular carcinoma cell line
I ionic strength
I/R ischemia/reperfusion
IACUC institutional animal care and use committee
IC intracarotid
ICA internal carotid artery
ICP-MS inductively coupled plasma mass spectrometry ICV intracerebral ventricular
ID injected dose
IgG immunoglobulin G
IHC immunohistochemistry
INB intranasal to brain
IP intraperitoneal
IPEC interpolyelectrolyte complex ITC isothermal titration calorimetry
IV intravenous
Kb Boltzmann constant
Ki unidirectional influx rate Kobs apparent binding affinity
LCST lower critical solution temperature
Lp persistence length
LR lactated Ringer's solution MALS multi-angle light scattering
MB midbrain
xxiii
MCAO middle cerebral artery occlusion
MD molecular dynamics
MPS mononuclear phagocyte system
Mw molecular weight, or molar mass
NA Avogadro’s number
NaBH4 sodium borohydride
NaCl sodium chloride
NaCNBH3 sodium cyanoborohydride
NaN3 sodium azide
NF-L neurofilament
NGS normal goat serum
NHS N-hydroxysuccinimide
NIH National Institute of Health
NMJ neuromuscular junction
NP nanoparticle
NSC-34 immortalized mouse motor neuron cell
NVU neurovascular unit
OB olfactory bulb
OC occipital cortex
OCT optimal cutting temperature compound
P postnatal day
PAGE polyacrylamide gel electrophoresis
PAsp(DET) poly[N-[N’-(2-aminoethyl) - 2-aminoethyl] aspartamide]
PB phosphate buffer
xxiv
PC parietal cortex
PD Parkinson's disease
PDB protein data bank
PDI polydispersity index
PECAM-1 platelet endothelial cell adhesion molecule
PEG poly(ethylene glycol)
PEI poly(ethylenimine)
PG pyrogallol
pI isoelectric point
PIC polyion complex
PiPrOx poly(isopropyl oxazoline)
PLE poly(L-glutamic acid)
PLGA poly(lactic-co-glycolic acid)
PLL poly(L-lysine)
PNIPAAM poly(isopropylacrylamide)
PON pons
PTS protein thermal shift
PVS perivascular space
RB rest of the brain
RES reticuloendothelial system
Rg radius of gyration
Rh hydrodynamic radius
rHsp70 recombinant heat shock protein 70
ROS reactive oxygen species
xxv
rt-PA recombinant tissue plasminogen activator
S entropy
SD standard deviation
SDS sodium dodecyl sulfate
SEC size exclusion chromatography
SEM standard error of mean
sIgA secretory immunoglobulin A S-NHS N-hydroxysulfosuccinimide
SOD superoxide dismutase
SOD1 copper/zinc SOD
SPDP succinimidyl 3-(2-pyridyldithio) propionate
ST striatum
T temperature
t1/2 half-life
TA tibialis anterior
TBS Tris-buffered saline
TBST Tris-buffered saline with 0.1% Tween 20
TCA trichloroacetic acid
TEM transmission electron microscopy
TF tissue factor
TH thalamus
Tm melting temperature
TrkB tropomyosin receptor kinase B
xxvi
UNC the University of North Carolina at Chapel Hill UNMC University of Nebraska Medical Center
VAChT vesicular acetylcholine transporter
WB whole brain
Z-/+ or Z+/- charge ratio
α degree of protonation
α-BTX alpha-bungarotoxin
κ-1 Debye length
ρ structural density
CHAPTER 1 INTRODUCTION1
During the past decade, therapeutic proteins (e.g. antibodies, hormones, enzymes, and vaccines) have rapidly emerged as mainstream drug candidates in the pharmaceutical industry. Many new protein drugs are under investigation, raising hope for curing a large number of diseases previously considered “incurable” such as cancer, stroke, diabetes, etc. Nonetheless,
not all proteins are naturally good drug candidates. Indeed, many of the most potent therapeutic proteins cannot make it to the clinic due to in vivo enzymatic degradation, rapid clearance from the circulation, immunogenicity, and inability to cross cellular membranes. To address these problems, a carrier is necessary to protect the proteins, facilitate their transport through biological barriers, and deliver them to their target site(s) of action. Microparticles composed of poly(lactic-co-glycolic acid) (PLGA) are the most well established carrier for protein delivery. With the controlled degradation of the polymeric matrix, the proteins encapsulated in the PLGA particles can be slowly released over a period of time [1]. Considering PLGA particles can be engineered to remain in the circulation for a long time [2], this approach can generate a sustained release profile for the cargo proteins after a single injection. The disadvantage of this approach is the extensive use of organic solvents in the manufacturing process which usually leads to denaturation or inactivation of the proteins [3]. Moreover, a large faction of proteins are usually associated with the surface of the microparticles and are not completely encapsulated. Once injected, these proteins will quickly dissolve in the blood stream and result in a sudden peak serum exposure, a phenomenon also known as “burst
release” which can associate with serious adverse events for some protein therapeutics [4].
Therefore, new strategies are needed for protein delivery to overcome these limitations. 1.1 Block Ionomer Complex
Nearly 90 years ago, Bungenberg de Jong and Kruyt first reported the phenomenon of “complex coacervation”[5] where the mixing of two oppositely charged colloids in aqueous
solution lead to phase separation [6]. This phenomenon was later suggested as a pre-cellular structure and therefore the “origin of life” by Oparin [7]. Complex coacervation between
and BIC [8]. For the sake of clarity, the term “block ionomer complex” will be employed throughout this thesis.
1.1.1 Formation of BIC
Electrostatic interaction is widely accepted to be the driving force for BIC formation [8, 9]. It generally comprises two components: the coulombic attraction between opposite charges, and the release of small counter ions originally condensed by the polyelectrolytes. Other non-covalent forces, like hydrophobic interactions and hydrogen bonding, have also been reported to contribute to the formation of BICs depending on the chemical nature of polyelectrolytes as well as solution environments (e.g. pH, ionic strength, etc.) [17]. A recent report suggest that even strong cation-π interactions can drive the formation of BICs from two like-charged polyelectrolytes by overcoming longer-range electrostatic repulsion [18]. The contribution of these non-electrostatic interactions can be more prominent if BICs are formed in environments where the electrostatic interactions are inhibited (e.g. solutions of high ionic strength).
Thermodynamically, the spontaneous formation of BIC entails a negative change in total Gibbs free energy (∆G) of the system, which is further determined by the balance between
of highly ordered water networks at the colloidal interface [26]. The formation and rupture of hydrogen bonds is the major contributor for the enthalpic change in the system, which is usually determined by the dehydration/rehydration at the complex interface as well as direct formation of hydrogen bonds between the polyelectrolytes [26].
1.1.2 Protein BICs
As natural polyelectrolytes, many proteins can spontaneously participate in the formation of BICs with oppositely charged block ionomers in the aqueous solution. This process is usually described as “self-assembly”, and is arguably the simplest way to load
proteins into a nanoparticle. The same driving forces and thermodynamic considerations discussed in the previous section also apply here. Nevertheless, interactions between proteins and linear polyelectrolytes are featured by some unique properties due to the structural rigidity and charge anisotropy of the proteins.
1.1.2.1 Structural rigidity
by small ions in the solution, which in fact renders the microenvironment of the BIC core highly hydrated [17] and more amenable for protein storage.
1.1.2.2 Charge anisotropy
Another unique feature setting proteins apart from other polyelectrolytes is their heterogeneous distribution of positive and negative charges on the surface. When the charges exist as localized clusters, they become the so-called “charge patches” [33]. This concept is initially introduced in the field of ion-exchange chromatography where proteins can bind to the stationary phases even when the mobile phase pH is on the “wrong side” of the protein isoelectric point (pI) [34]. Indeed, when the dimension of protein globules are comparable or longer than the Debye length (κ-1) in the solution, their charge patches will be isolated from
each other, and interact with polyelectrolytes individually [35]. In this scenario, the complexation between polyelectrolyte to a protein under conditions where both species have the same sign of net charge [30, 36, 37] can occur as a consequence of “patch”-mediated short-range electrostatic attractions overcoming long-short-range repulsion from other “patches”[38]. In light of the highly differential charge distribution pattern of proteins, this effect makes it possible for a polyelectrolyte to specifically recognize and isolate a particular protein from a mixture of same-charged proteins [39].
1.2 Environmental effects on protein BICs 1.2.1 Ionic strength (I)
As introduced in the previous section, electrostatic interaction is the predominant force driving the formation of BICs. The increase of ionic strength suppresses it by decreasing the Debye length in water, as demonstrated by the following equation [40].
𝜅−1=0.304
√𝐼
computer simulation results [43] suggest that the binding constant between protein and polyelectrolyte do not simply decrease with the increase of I, but instead usually displays a maximum in the range of 5mM < I < 30mM [38].
This phenomenon cannot be simply explained by hydrophobic interaction or hydrogen bonding because their effects on polyelectrolyte binding are usually overshadowed by electrostatic interaction at such low ionic strength. Actually, while high ionic strength leads to screening of electrostatic interaction between the protein and the polyelectrolyte, a low level of ionic strength is necessary to isolate the “charge patches” on the protein. As I value continues
to decrease below 5mM, the Debye length will significantly increase. When it reaches a level comparable to the dimension of the protein globule, the repulsive effects between the polyelectrolyte and same-charged “patches” on the protein starts to take effect and destabilize the complex [38]. Similar consideration applies to the polyelectrolytes - a certain level of ionic strength is necessary to screen the repulsion between charges of adjacent repeating units on the polymer. When the ionic strength is low, these repeating unites will try to maximize their distances between each other, which subsequently increases the stiffness of the polymer [44]. As discussed in the previous section, this effect is unfavorable for its binding to proteins. Hence, the formation and stability of BIC requires a moderate level of ionic strength in the solution.
1.2.2 pH
delivery tools since variations in local pH is common in biological systems, especially under pathological conditions. For instance, endosomal pH drops from 6.8 – 4.9 during its maturation process [50]; tumor microenvironment usually features slightly acid pH ranging from 6.9 – 6.5 [51] and ischemic stroke also induces a quick drop of brain tissue pH from 7.0 to 6.2 [52].
1.2.3 Temperature
The effect of temperature on protein BICs is highly system-dependent and usually reflects the contribution of non-electrostatic interactions. In general, higher temperature upholds hydrophobic interaction, while lower temperature favors hydrogen bonding [53]. Nevertheless, temperature fluctuation in the physiologically relevant range (36oC – 43oC) usually do not make a big difference for most protein BICs. Exceptions are those formulated with a class of temperature-responsive polymers as the hydrophilic block, including poly-(isopropylacrylamide) (PNIPAAM) [54] and poly-(isopropyl oxazoline) (PiPrOx)[55]. This class of polymers have lower critical solution temperatures (LCST) that are above room temperature, and become insoluble at elevated temperatures. As a result, protein BICs formed using these polymers whose hydrophilic block can undergo temperature-induced phase transition can selectively release the cargo proteins at certain temperatures [56]. By chemically modifying these polymers, their LCST can be tuned close to body temperature (35oC – 40oC) [57, 58]. This is particularly useful for targeting inflamed or tumorous tissues where the tissue temperature is higher than normal. Another exciting application of this class of BICs is in combination with far infrared irradiation to create local hyperthermia and induce drug release at virtually any tissue of interest [59].
1.3 Stabilization of protein BICs
of about 150mM to maintain homeostasis, which readily disassembles most protein BICs before they can reach their target sites of action. In many cases, additional engineering is necessary to stabilize protein BICs and effectively use them for in vivo protein delivery. These engineering approaches include chemical crosslinking, charge conversion, ternary complex formation, and introduction of hydrophobic interactions.
1.3.1 Chemical crosslinking
Chemical crosslinking is the most common way to stabilize BICs for in vivo protein delivery. With the introduction of small crosslinkers into the system, the electrostatic coupling between protein and polymer can be reinforced by covalent conjugation, thereby preventing the BIC from dissociation in the body fluids. Depending on the need for proteins to be released at the target site, the crosslinker can be designed to be environmentally sensitive.
Glutaraldehyde is one of the earliest crosslinkers for proteins. Despite the simplicity of its structure, it demonstrates very complicated chemical behaviors in solution depending on the pH, temperature and concentration [60]. Consequently, its crosslinking chemistry usually involves a combination of several different mechanisms such as Schiff base formation and Michael-type addition. Despite this complexity, glutaraldehyde crosslinks BICs primarily by reacting with amine groups on lysine and arginine residues on the protein or the polymer. The reaction can also be followed by the addition of reducing agents such as sodium borohydride (NaBH4) or sodium cyanoborohydride (NaCNBH3) in order to stabilize the double bonds in the Schiff base [61-64]. These BICs demonstrated superb stability and therapeutic efficacy in vivo. However, glutaraldehyde has long been criticized for being too heterogeneous and toxic for medical applications[65].
from the primary amine groups on either the protein or the polymer, with slight differences in optimum pH of the reaction. Sometimes disulfide bonds are introduced in these crosslinkers (3, 3’-Dithiobis (sulfosuccinimidylpropionate), DTSSP or Dimethyl dithiobispropionimidate,
DTBP) to facilitate red-ox mediated cargo release [13, 32, 63, 66].
In light of the proximity between negatively charged carboxylate groups and positively charged amine groups in many protein BIC systems, 1-ethyl-3-(3-dimethylaminopropyl)carbodiimide (EDC) can be used as a zero-length crosslinker. This reagent activates carboxyl groups for spontaneous reaction with primary amines and result in the formation of a peptide bond. Its crosslinking efficiency can be further increased if used in combination with NHS or sulfo-NHS [67].
Crosslinking can also be mediated by chemical modifications on the polymer. In this scenario, the crosslinking chemistry is usually designed to be sensitive to environmental changes. As an example, Hefferman et al. reported a strategy where the amine groups of poly(ethylene glycol)-poly(L-lysine) (PEG-PLL) are modified with crosslinkable dithiopyridine groups with Michael addition which preserves the positive charges on the PLL chain [68]. This modified polymer successfully encapsulated succinimidyl 3-(2-pyridyldithio) propionate (SPDP)-modified ovalbumin/catalase through disulfide bond formation.
It can usually be ameliorated by careful selection of chemistry and optimization of input ratio of crosslinkers to reactive chemical groups on the protein. Indeed, a number of reports suggested insignificant loss of protein activity after crosslinking compared with their non-crosslinked counterparts [61, 62, 71].
1.3.2 Charge conversion
The primary reason for the instability of protein BICs at the physiological ionic strength is its insufficient charge density compared to synthetic polymers or DNA molecules. Therefore, charge conversion or “supercharging”[72] of proteins has been explored to increase BIC
1.3.3 Ternary BICs
In addition to directly participating in the complex coacervation process, proteins have also been reported to partition into the coacervate core of complexes composed of a charged-neutral block copolymer and an oppositely charged homopolyelectrolyte. The resulting complex are more stable against disintegration upon increases in ionic strength [76-80]. To prepare these complexes, the proteins are usually pre-mixed with a like-charged homopolyelectrolyte and then transferred to a solution containing an oppositely charged block copolymer. This process leads to the formation of a ternary BIC system containing the protein, the homopoyelectrolyte, as well as the block copolymer. It is also named “tripartite polyion micelles” in some works [81, 82]. The amount of proteins loaded into the complex can be
modulated by complex composition, NaCl concentration and the starting concentrations of the protein [80]. Furthermore, the protein can be gradually released from the complex upon increasing ionic strength in the solution without destruction of the BIC structure [77, 78]. It is observed that the most stable complex formation occurs at an excess of homopolyelectrolyte over the protein [76]. As a result, the major limitation of ternary BIC is loading capacity. For example, in a lysozyme/ poly(acrylic acid)-poly(acryl amide) /poly(N,N-dimethylaminoethyl
methacrylate) ternary system, the optimal number of lysozyme molecules was estimated to be 5–15 per complex [76]; in a lipase/ PEG-poly(2-methyl vinyl pyridinium)/ poly(acrylic acid) system, this number is 0.4-4.6, depending on the ionic strength of the solution [77].
1.3.4 Introducing hydrophobic interactions
lysozyme and PEG – poly (aspartic acid) (PEG-PAsp) by adding a single hydrophobic group to the ω-end of the PAsp block. Pispas further introduced hydrophobic monomers into the
backbone of a block copolymer, which forms stable complexes with lysozyme in a solution containing 0.15 M NaCl [83].
1.4 Application of protein BICs 1.4.1 Intracellular delivery
Unlike small molecule drugs, most proteins cannot diffuse through the cellular membrane. Therefore, a delivery system that can transfer protein pharmaceuticals into the cytoplasm is the key for successful protein therapies with intracellular targets. To this end, BIC offers a great opportunity given its proven success in intracellular delivery of DNA and RNA molecules [84, 85].
Another challenge involves endosomal escape of the proteins. As BICs are internalized into a cell, they immediately become entrapped in endosomes and will be later degraded by lysosomal enzymes [88]. To avoid degradation and ensure cytosolic delivery of the proteins, their endosomal escape needs to be facilitated. Kataoka et al. reported the use of PEG-block-poly [N-[N′-(2-aminoethyl)-2-aminoethyl] aspartamide] (PEG−PAsp(DET)) coPEG-block-polymer, which destabilizes endosomal membranes in the low pH environment [89], and successfully delivered charge-converted antibodies to the cytosol [74, 75].
1.4.2 Enzyme delivery
BIC is particularly useful for the delivery of enzymes, which is attributed to its “caging” and “hyperactivation” effects. Crosslinking is the major strategy to stabilize BICs for enzyme
delivery, because release is usually not necessary for them to work.
1.4.2.1 Caging
BICs are known to protect the cargo proteins from proteolysis and aggregation induced by shear stress and temperature [90]. This is attributed to the steric repulsion provided by its hydrophilic corona against proteolytic enzymes and other proteins. Nonetheless, the highly hydrated nature of the coacervate core [17] allows for entry of small substrates and exit of products, which makes it a semi-permeable “cage” that allows the enzyme to be functional without being released out of the complex. The “cage” can be further fortified by chemical
crosslinking and used for in vivo enzyme delivery [12, 13, 32, 91].
Formation of “cages” can also extend the circulation time of enzymes in vivo. The size
hydrodynamic size and shields the cationic charge of these enzymes, resulting in longer retention in the circulation.
1.4.2.2 Hyperactivation
Although enzymes can lose their activity towards large substrates (e.g. cell walls of bacteria [94]) owing to the caging effect, small substrates can usually diffuse into the coacervate core and access the active sites on the enzymes even after crosslinking [12, 70, 71, 95, 96]. Interestingly, sometimes compartmentalization of enzymes into BICs can lead to increased activity over their native counterparts, which is typically referred to as “hyperactivation” [70, 71, 97-100]. The mechanism for hyperactivation differs case by case,
but typically involves contributions from the block copolymer. For example, PEG-PAsp has been proposed to increase trypsin activity by direct stabilization of its histidine residues at the active site through electrostatic interactions[100]. In another study, the activity of lysozyme was doubled after encapsulation into PEG-PAsp, attributing to the condensation of substrates in the hydrophilic corona of the BIC [70]. More recently, Kurinomaru et al studied the enzymatic activity of α-chymotrypsin and reported its increase by approximately 1 order of
magnitude after complexation with polyelectrolytes of opposite charge to its substrates, suggesting a substrate accumulation mechanism by electrostatic attraction [98]. A similar but milder increase in activity was observed in Copper/Zinc superoxide dismutase after complexation with PEG-poly (L-lysine) [32, 63].
1.5 Conclusion
composition of polymers, crosslinkers, or even the surface residues on the proteins, this delivery system exhibits outstanding responsiveness to subtle environmental changes that are relevant to pathological states. One possible next step could be the functionalization of the BICs for cell-targeted delivery of proteins.
CHAPTER 2 SOD1 NANOZYME SALVAGES ISCHEMIC BRAIN BY LOCALLY
PROTECTING CEREBRAL VASCULATURE2
2.1 Summary
Copper/zinc superoxide dismutase (CuZnSOD; SOD1) is widely considered as a potential therapeutic candidate for pathologies involving oxidative stress, but its application has been greatly hindered by delivery issues. In our previous study, nano-formulated SOD1 (cl-nanozyme) was shown to decrease infarct volume and improve sensorimotor functions after single intravenous (IV) injection in a rat middle cerebral artery occlusion (MCAO) model of ischemia/reperfusion (I/R) injury. However, it remained unclear how cl-nanozyme was able to deliver SOD1 to the brain and exert therapeutic efficacy. Present study aims to answer this question by exploring micro-distribution pattern of cl-nanozyme in the rat brain after stroke. Immunohistochemistry studies demonstrated cl-nanozyme co-localization with fibrin along damaged arteries and capillaries in the ischemic hemisphere. We further found that cl -nanozyme can be cross-linked into thrombi formed after I/R injury in the brain, and this effect is independent of animal species (rat/mouse) used for modeling I/R injury. This work is also the first report reinforcing therapeutic potential of cl-nanozyme in a well-characterized mouse MCAO model of I/R injury.
2.2 Introduction
Stroke affects 7 million people, and continues to kill over a hundred thousand people annually in the United States alone [101]. Main causes of brain tissue damage during transient
ischemic stroke are ischemic and reperfusion injuries. Ischemic injury results from lack of glucose and oxygen when blood flow to the brain is blocked [102]. Reperfusion injury results from the detrimental action of reactive oxygen species (ROS) on brain tissue after blood flow is restored [103].
Antioxidant enzymes are endogenous tools for cells to scavenge ROS. However, their expression is often inhibited during stroke [104, 105], rendering antioxidant activity far less than sufficient for complete removal of excess ROS. Therefore, supplementation of antioxidant enzymes to the brain is a potential therapeutic strategy for this disease [106]. Their action would be especially beneficial for rescuing the salvageable penumbra since oxidative stress is the main mechanism of tissue damage in this area [107]. A direct use of anti-oxidant enzymes as therapy for stroke is not plausible because of its short half-life in the blood and poor permeability across the blood-brain barrier (BBB) and cellular membranes [108]. Even though BBB can be partially compromised during and after stroke, it still remains the key impediment for CNS transport of enzymes [109, 110]. Multiple strategies have been explored for delivery of functional antioxidant enzymes to the brain, including cationic liposomes, fusion proteins with peptide transduction domains, poly(ethylene glycol)-protein conjugates (PEGylated protein) and encapsulation into poly(lactic-co-glycolic acid) (PLGA) nanoparticles [111-118]. However, each of these approaches has limitations that precluded their successful clinical use as discussed in our previous work [32]. Briefly, loading of enzymes into solid or hollow nanoparticles often resulted in loss of activity and/or unsatisfactory loading efficiency (32% in the case of SOD1 liposomes [119]), and PEGylation usually decreases enzyme permeability across BBB [113].
copolymers (“nanozymes”). Nanozymes are core-shell structured nanoparticles with the polyion complex core consisting of charge-neutralized polycation chains and protein globules, and the shell consisting of PEG chains. Primary amine groups in the core were cross-linked (cl) using low molecular mass chemical cross-linkers to form cl-nanozyme and further purified to improve sample homogeneity by removing non-cl-nanozymes [32]. This formulation is essentially a covalently cross-linked polyion complex formed by SOD1 and methoxy-poly(ethylene glycol)-b-poly(l-lysine) (PEG-pLL, Figure 2.1).
Some of the key advantages of this strategy include high (100%) loading efficiency (owing to the formation of stoichiometric complexes) and instantaneous enzyme availability for catalysis precluding the need for its release, since superoxide anions are small enough to freely diffuse into the enzymatic core of the particle. This is a distinct advantage in scavenging ROS in the acute phase of diseases caused by oxidative stress, because the time window for antioxidant enzymes to work in these scenarios are usually narrow, and “fast acting” formulations like cl-nanozyme are consequently favored over those requiring drug release mechanisms.
The initial in vivo proof of concept for nanozyme transport to CNS was obtained by us using cl-nanozymes carrying butyrylcholinesterase, SOD1, or catalase [61, 63]. Compared to PEGylated SOD1 which poorly enters cells, SOD1 nanozyme was transported into neuronal cells and was superior to PEGylated SOD in depleting intracellular ROS and inhibiting Angiotensin II signaling in vitro and in vivo [121, 122]. Catalase nanozymes demonstrated neuroprotective effects in an animal model of Parkinson’s disease (PD) [123, 124]. Our most
investigate how this approach was able to exert the observed therapeutic effect [32]. However, understanding this mechanism can be essential for improving therapeutic potential of SOD1 nanozyme formulation and for discovery of more applications of the nanozyme delivery platform.
In the present work, we demonstrate that cl-nanozyme accumulated predominantly within the injured vasculature and co-localized with fibrin after stroke. This suggests one possible mechanism where cl-nanozyme passively target to damaged brain vasculature, and locally protect the neurovascular unit as an entire entity. To evaluate this finding from a translational perspective and investigate the validity of our findings in another animal model, we tested the same cl-nanozyme formulation in a well-characterized mouse model of stroke, and again observed significant reduction of infarct size. In vitro thrombus incorporation assay in the mouse plasma further supported our major hypothesis that cl-nanozyme can be actively incorporated into growing thrombus formed during or after stroke.
2.3 Materials and Methods 2.3.1 Materials.
3,3’-Diaminobenzidine (DAB), SOD1, and 2,3,5-triphenyltetrazolium chloride (TTC) were purchased from Sigma-Aldrich. PEG113-pLL51 was purchased from Alamanda
2.3.2 Synthesis of cl-nanozyme.
Cl-nanozyme was synthesized at the polycation to SOD1 charge ratio Z+/−=2 using
DTSSP as a cross-linker as previously described [32]. After synthesis and desalting (to remove unreacted DTSSP), cl-nanozyme was purified to separate the cross-linked from the non-cross linked species. For the purification, cl-nanozyme in 10 mM HEPES buffer containing 0.3 M NaCl (pH=7.4) was loaded onto Macrosep centrifugal device (Pall Corporation, MI) and concentrated twice to about 10% of its initial volume by centrifugation at 4,500 rpm at 4 °C. The concentrate was collected and desalted using NAP™ columns to remove excess NaCl. The eluent was then collected in 10 mM HEPES buffer containing 0.15 M NaCl (pH=7.4). SOD1 enzyme activity was determined using a microplate version of PG assay [32], and normalized to protein content determined by Inductively Coupled Plasma Mass Spectrometry (ICP-MS) using copper and zinc as standards. Particle effective diameter (z-average hydrodynamic diameter) and polydispersity index (PDI) were measured using a Malvern Zetasizer Nano (Malvern Instruments Ltd., MA). The resulting cl-nanozyme had a particle diameter of 39.2 ± 0.8 nm (PDI < 0.1), and retained 58.6 ± 9.5% enzyme activity relative to native SOD1.
2.3.3 Animals.
2.3.4 MCAO model of transient ischemic stroke in rats.
Brain ischemia was modeled by transient MCAO method as described previously [125]. Rats were anesthetized with ketamine (80 mg/kg) and xylazine (5 mg/kg) cocktail and isoflurane (5% v/v for induction and 0.5% v/v during surgery). Rectal temperature was maintained at about 37 °C throughout the surgery using a homoeothermic monitor (Harvard Apparatus, UK). Animals were prepared for surgery according to IACUC recommendations. The right common carotid artery was exposed and occluded using a silicon rubber-coated monofilament for MCAO. Filament was inserted through the incision into internal carotid artery (ICA) and further until reaching the bifurcation of MCA. Tip occluded the entrance to MCA and blocked blood supply to part of the right brain hemisphere (referred to as the ischemic hemisphere). Filament was carefully withdrawn after 1 hour. Sham surgery was performed as described above without filament insertion. After the surgery, animals were returned to their cages and allowed free access to water and food. At the time of reperfusion, 10,000 U/ kg of native SOD1 or cl-nanozyme (n = 10 in each group) were IV injected under anesthesia. Rats were sacrificed 3 or 24 h post-reperfusion, and perfused with 4% paraformaldehyde solution for histology analysis.
2.3.5 Histology and Immunohistochemistry.
Tissue toxicity of cl-nanozyme was assessed by hematoxylin and eosin (H&E) staining of liver, spleen, kidney, and lung tissues. Tissue samples were dissected and fixed in 10% neutral buffered formalin before embedded in paraffin. Five μm thick tissue sections were
antibodies and VecStain Elite kit (Vector Laboratories, CA). DAB color generation system was used as described previously [126] for chromogenic visualization. Fluorescent immunohistochemistry study was performed on tissues perfused with PBS followed by 10% neutral buffered formalin. To visualize cl-nanozyme in the liver and brain, tissue sections were stained using rabbit anti-PEG antibody (Abcam, CA) diluted 1:200 and 1:100, respectively. Hepatocytes were detected with polyclonal chicken anti-albumin antibody (1:100, Sigma Aldrich, MO). CD68+ cells in the brain (infiltrating monocytes), liver (Kupffer cells) and spleen (splenic macrophages) were visualized using monoclonal mouse anti-CD68 antibody (1:40 Abcam, MA). Brain microvessels were visualized using monoclonal mouse anti-CD31 antibody (1:30, AbD Serotec, NC); neurons were visualized using monoclonal mouse anti-neurofilament 70kDa (NF-L) antibody (1:200, Millipore, CA); fibrin deposits after stroke were visualized using mouse anti-fibrin antibody (1:50, Abcam, MA). Treatment with primary antibodies was followed by treatment with secondary antibodies: AlexaFluor 594 goat anti-chicken, AlexaFluor 594 goat anti-mouse, and AlexaFluor 488 goat anti-rabbit, and AlexaFluor 647 goat anti-mouse. Nuclei were visualized using 2.5µg/ml Hoechst 43580 solution. Immunofluorescence were detected using Zeiss 710 Confocal Laser Scanning Microscope and images were analyzed using Zeiss Zen software and ImageJ software (National Institute of Health, MD).
2.3.6 Preparation of 125I-labeled Proteins and cl-nanozyme.
NAP-5 desalting columns (GE Healthcare, NJ). Fractions were collected in Eppendorf tubes pretreated with 1% BSA in Lactated Ringer’s solution (1% BSA-LR) to prevent non-specific adsorbance. Radioactivity was measured using a PerkinElmer γ-counter. TCA precipitation
was conducted to determine the 125I association of labeled samples. Briefly, 1 µL of collected fractions was added to 0.5 mL of 1% BSA-LR and then precipitated in 0.5 mL of 30% TCA followed by centrifugation at 5000 xg for 10 min at 4 °C. The resulting supernatant and pellet were measured in the γ-counter and the values were used to calculate the %radioactivity that
precipitated with acid (% protein bound-125I = [CPMpellet /(CPMpellet + CPMsupernatant)]*100%). Samples containing >100,000 cpm/µL of radioactivity and > 90% TCA precipitation were used for animal studies.
2.3.7 Biodistribution and Serum Clearance in Mice.
2.3.8 MCAO Model of Transient Ischemic Stroke in Mice.
All mice were randomly assigned before surgery into one of the following groups: cl -nanozyme-treated group (n = 8), native SOD1-treated group (n = 8), or saline-treated group (n = 7). The mice were weighed and were subjected to 90 min of ischemia under isoflurane anesthesia (5% v/v for induction and 1.5% v/v during surgery) as previously described [128]. Briefly, rectal temperature was monitored maintained at approximately 37 °C during surgery using a homoeothermic heating system. A midline ventral neck incision was made, and unilateral MCAO was performed by inserting a silicone rubber coated monofilament into the right internal carotid artery 6 mm from the internal carotid/pterygopalatine artery bifurcation via an external carotid artery stump. At the time of reperfusion, 10,000 U/ kg of treatment solutions were IV injected under anesthesia.
2.3.9 TTC Staining and Brain Infarct Volume Quantification.
After 90 minutes of ischemia and 24 hours of reperfusion, the mice were euthanized and the brains were chilled at -80 °C for 4 minutes to slightly harden the tissue. Five 2-mm-thick coronal sections were cut from the olfactory bulb to the cerebellum and then stained with 1.5% TTC in PBS (pH=7.4). The sections in TTC solution were incubated in a water bath maintained at 37 °C for 30 minutes, then transferred to a 10% phosphate-buffered formalin solution and incubated overnight at 4 °C before pictures were taken for analysis. The infarct volumes were calculated blinded to the treatment given, and the infarct size in each of the five slices was quantified using the Image J software. In addition to total hemisphere, the infarct areas were determined separately for cortex and caudoputamen in each slice. Then the infarct areas on each slice were summed up and multiplied by thickness to calculate infarct volumes. The infarct volumes were calculated using Swanson’s method [129] and processed as %
2.3.10 Thrombus Incorporation Assay in Mouse Plasma.
One hundred thousand CPM of 125I-labeled fibrinogen, BSA, native SOD1, and
cl-nanozyme were added into an Eppendorf tube containing 1 mL C57BL/6 mouse Lithium heparin-stabilized plasma (Innovative Research, MI). Half mg of protamine sulfate was then added to neutralize heparin and allow thrombus formation. The tube was incubated on a rotary-shaker for 24 h at 4 °C before centrifugation at 5000xg for 10 min. Serum was separated from the white thrombus at the bottom of the tube, and then subjected to TCA precipitation assay to correct for error caused by 125I dissociation during incubation as described above. Percentage
of samples sequestered in the thrombus compartment were calculated using the following formula: %Thrombus Incorporation = [CPMthrombus /(CPMthrombus + CPMserum)]*100%.
2.3.11 Autoradiography
For autoradiography experiments, 125I-labeled cl-nanozyme was IV injected in mice with either a MCAO surgery at the onset of reperfusion or a sham surgery. The mice were sacrificed and perfused with PBS 1 hour after injection. Their brains were then harvested, snap-frozen with dry ice, and cut into 50 µm-thick coronal sections before exposing it for 73 days before read on an autoradiography imager.
2.3.12 Statistical Analysis.
The randomization code was broken in the mice stroke therapeutic efficacy study after acquiring all the data. Statistical analysis was done using Prism 5.0 software (GraphPad, CA). Unpaired Student's t-test was used for two groups, and one-way ANOVA followed by Tukey’s multiple comparison test for groups of three and above. A minimum p-value of 0.05 was estimated as the significance level. Results of all experiments are presented as mean ± standard
2.4 Results
2.4.1 Cl-nanozyme Tissue Distribution in the Rat MCAO Model of I/R Injury
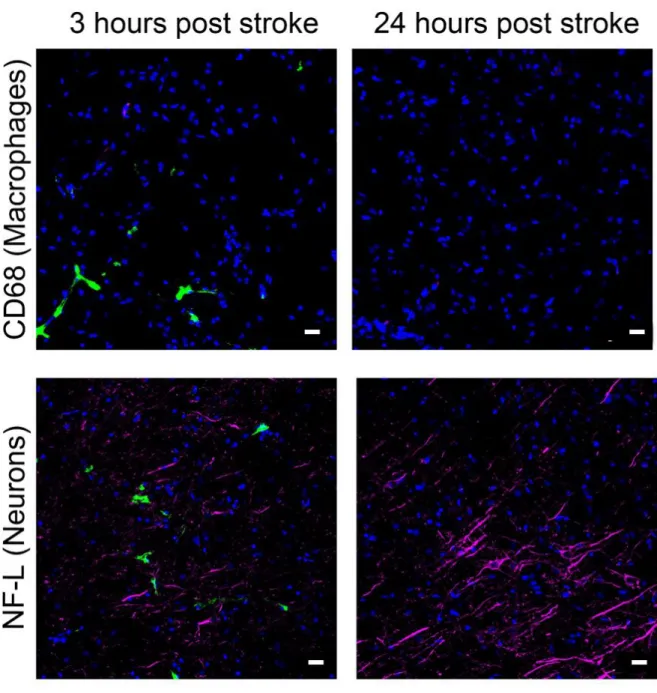
In our previous paper [32] reporting synthesis and purification of cl-nanozyme, we have demonstrated decreased infarct volume and improved sensorimotor functions after a single IV injection in a rat MCAO model. To gain insight into the mechanism of cl-nanozyme’s therapeutic efficacy, we studied its micro-distribution in the same model. Immunohistochemistry (IHC) analysis revealed accumulation of cl-nanozyme primarily in the ipsilateral hemisphere in the area of infarct at 3h post-reperfusion. (Figure 2.2).
Cl-nanozyme localized primarily within blood vessels, as shown by fluorescent double staining for cl-nanozyme and endothelial marker PECAM-1 in Figure 2.3 A. Cl-nanozyme staining outside the blood vessel in brain parenchyma was primarily seen in the infarct region of the ipsilateral hemisphere. Cl-nanozyme co-localized with neither neurons nor activated mononuclear phagocytes (Figure 2.2).
We further hypothesized that cl-nanozyme co-localize with damaged blood vessels, since its signal was most prominent in infarct regions. Evidence for this hypothesis is shown in Figure 2.4. During the MCAO procedure, occlusion is created by filament insertion into the lumen along the internal carotid artery. Figure 2.4 A is a confocal micrograph of a coronal brain section across a portion of internal carotid artery where the filament tip was positioned (Figure 2.4 D).
which further supports our hypothesis that cl-nanozyme localizes in damaged blood vessels. Interestingly, while most cl-nanozyme signal co-localized with fibrin, not all capillaries with fibrin deposition sites showed cl-nanozyme accumulation (Figure 2.3 C).
Peripheral organs were collected 24 hours after reperfusion, and histological examinations was performed to qualitatively study the disposition and any possible toxicity effects of cl-nanozyme. H&E-stained tissue sections did not reveal any sign of acute toxicity (Figure 2.5). Analysis of cl-nanozyme distribution in select peripheral organs confirmed its presence in the liver and spleen, but not in lungs or kidneys at this time point (Figure 2.6 A). Triple fluorescent immunostaining of the liver tissue revealed co-localization of cl-nanozyme with hepatocytes and Kupffer cells (Figure 2.6 B). We noticed intense cl-nanozyme staining in areas between two adjacent hepatocytes indicative of its deposition in the bile canaliculi, suggesting a potential clearance mechanism via bile excretion. In addition to their intracellular accumulation in hepatocytes, cl-nanozymes were also observed in liver sinusoids.
2.4.2 Cl-nanozyme Biodistribution and Serum Clearance in Mice
We studied biodistribution of native SOD1 and cl-nanozyme in healthy C57/B6 mice to determine the effects of formulating SOD1 on its biodistribution. One hour after injection, cl-nanozyme was found to accumulate in liver and spleen in significantly higher amounts than native SOD1, displaying 25- and 38-fold increases, respectively (Figure 2.7 A). Changes in SOD1 accumulation in most other peripheral organs including heart, lung, and spine were significant but less drastic (less than 4-fold increase) compared to liver and spleen. However, cl-nanozyme accumulation in kidney was reduced by more than half compared to native SOD1 (35.4% vs. 88.3%). Notably, the brain uptake of cl-nanozyme was 2-fold higher than native SOD1 (0.0809% vs. 0.0406%) in healthy mice.
2.7 B). Serum half-life (t1/2) of native SOD1 and cl-nanozyme was 10.3 min and 33.8 min
respectively, suggesting prolonged SOD1 circulation after formulation.
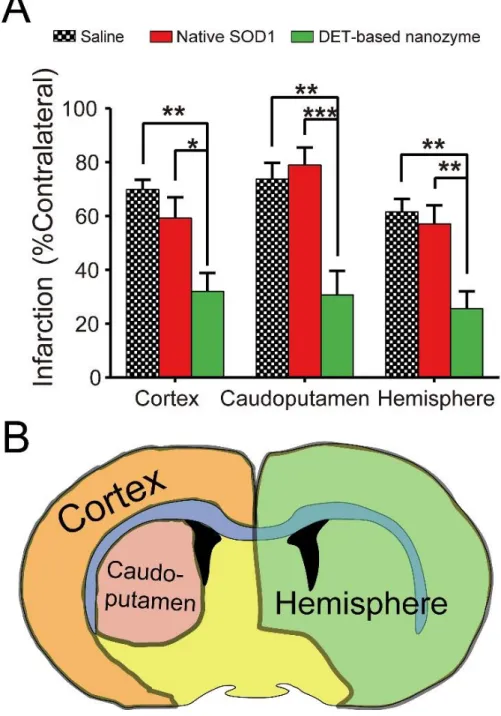
2.4.3 Therapeutic Effect of cl-nanozyme in Mouse MCAO Model of I/R Injury
Cl-nanozymes administered at the onset of reperfusion in a mouse MCAO model of I/R injury resulted in reduced infarct volumes compared to groups treated with saline or native SOD1. Significantly reduced infarct volume was observed in all three brain regions analyzed (cortex: 35.0±7.0%; caudoputamen: 13.0±4.7%; hemisphere: 28.1±5.6%) compared to those injected with saline (cortex: 69.8±3.7%; caudoputamen: 73.7±6.0%; hemisphere: 61.5±6.8%) and native SOD1 (cortex: 59.3±7.7%; caudoputamen: 78.9±6.5%; hemisphere: 57.1±6.9%), as shown in Figure 2.8. The mean infarct volume was slightly lower in the native SOD1-treated group than in saline-treated group, albeit this difference was not statistically significant. Interestingly, the protective effect of cl-nanozyme appears to be stronger in the caudoputamen area than in the cortex or entire hemisphere.
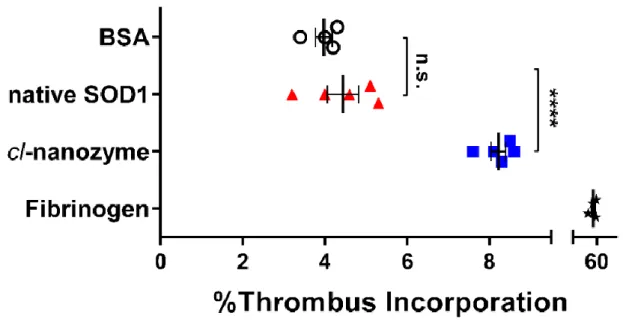
2.4.4 Thrombus Incorporation Assay
To directly evaluate the ability of cl-nanozyme and native SOD1 to be incorporated into white thrombi, we performed an in vitro thrombus incorporation assay using mouse plasma. After 24 h incubation at 4 oC, incorporation of native SOD1 into the thrombi (4.4±0.4%) was
not significantly different from that of the negative control, BSA. However, significantly more cl-nanozyme (8.2±0.2%) was sequestered in the thrombus compartment (Figure 2.9). Fibrinogen was used as a positive control and showed 52±4% accumulation in the thrombi. 2.5 Discussion
laboratory [32]. The present study continues to explore the mechanism by which cl-nanozyme exerted therapeutic efficacy.
The structure of cl-nanozyme does not include a brain targeting moiety. Thus, we did not expect it to cross a healthy BBB. Initially we believed that cl-nanozymes could possibly enter the brain via the disrupted BBB, a well-characterized phenomenon after brain I/R injury [131-133]. To our surprise, despite the observed therapeutic efficacy in the stroke model, we did not observe substantial evidence of cl-nanozyme crossing the BBB. In the IHC experiments, we did observe a considerable amount of cl-nanozyme signal associated with the infarct region of the brain, where the BBB is supposed to be disrupted. However, the majority of the signal was not associated with neurons or activated macrophages, but trapped inside the lumen of blood vessels. Although by design, our study does not exclude the possibility of a small portion of cl-nanozyme crossing the BBB and exerting therapeutic effect, the hypothesis of thrombus accumulation is apparently more plausible based on our observations. It also serves better on explaining why cl-nanozyme shows much better therapeutic efficacy compared to native SOD1, which can be tricky to explain based solely on the BBB disruption theory.
IHC data in the rat model strongly supported the thrombus incorporation hypothesis. Cl-nanozyme was detected primarily in the infarct region in association with endothelial cells of the damaged brain vasculature. Intense cl-nanozyme signal was observed only in areas surrounding the injured internal carotid artery, but not the healthy one in the contralateral hemisphere (Figure 2.4 B), confirming the selective nature of the association between cl-nanozyme and damaged blood vessels. Evidence of cl-nanozyme and thrombus crosslinking was further supported by the co-localization of cl-nanozyme with fibrin, a major component in blood clots, in the capillaries of the infarct region.
Beyond the brain, we have also examined cl-nanozyme distribution in select peripheral organs. H&E data suggested that cl-nanozyme is not noticeably toxic after in vivo administration. This is a promising observation that supports further development of such nanoparticles for stroke therapy. IHC experiments found massive distribution of cl-nanozyme into liver and spleen. This is generally in agreement with the known function of these organs in clearing particulate matter. Interestingly, a closer look at the liver slices revealed distribution of cl-nanozyme not only in Kupffer cells, but also in tube-shaped territories between two adjacent hepatocytes that resemble bile canaliculi. This particular staining pattern possibly indicates that cl-nanozyme is excreted through bile as part of its metabolic pathway. What we have detected in these structures is more likely to be metabolic products than intact cl-nanozymes, especially considering the time point of analysis (24 h after reperfusion) and the cleavable disulfide bond present in the cross-linker (DTSSP) used in this formulation. Notably, the rat liver has been reported to have rather high concentrations (10 mM) of reduced glutathione known to participate in disulfide reduction, which thereby may enhance degradation of the cl-nanozyme in the liver [32]. In addition to intra-hepatocyte accumulation, staining was also observed in the liver sinusoids. Considering the t1/2 of cl-nanozyme (33.8 min