INHIBITION OF COMPENSATORY SURVIVAL AND PROLIFERATIVE PATHWAY ACTIVATION INDUCED BY MTOR INHIBITION IN RENAL CELL CARCINOMA
Sean Thomas Bailey
A dissertation submitted to the faculty of the University of North Carolina at Chapel Hill in partial fulfillment of the requirements for the degree of Doctor of Philosophy in the
Curriculum of Genetics and Molecular Biology.
Chapel Hill 2014
Approved by: William Y. Kim Albert S. Baldwin Victoria L. Bautch Ian J. Davis
ABSTRACT
Sean T. Bailey: Inhibition of compensatory survival and proliferative pathway activation induced by mTOR inhibition in Renal Cell Carcinoma
(Under the direction of William Y. Kim, M.D.)
The mammalian target of rapamycin (mTOR) is a key regulator of tumor
progression in a variety of cancers and has been shown to be dysregulated in renal cell carcinoma (RCC). mTOR exists in two independent complexes. The mTORC1
complex consists of mTOR, Raptor, and GβL, while the mTORC2 complex consists of mTOR, Rictor, and GβL. Currently there are two FDA approved rapamycin derivatives (rapalogs) for the treatment of advanced renal cell carcinoma (RCC). Allosteric mTOR inhibition (i.e. rapalogs) results in the release of negative feedback inhibition on the PI3K/AKT survival-signaling pathway as well as upregulates the metabolically protective process known as autophagy. Furthermore, catalytic mTOR inhibitors attenuate
mTORC1 downstream signaling nodes more completely, but also diminishes mTORC2 mediated AKT survival signals induced by allosteric mTOR inhibitors. Additionally, it has been demonstrated, that mTOR inhibition results in activation of the MEK/MAPK signaling cascade. Based on this information, we wished to interrogate the molecular and biological consequences of inhibiting mTOR pharmacologically and genetically in the context of RCC.
lines on mTORC1 and mTORC2 signaling. We saw that only 1) catalytic mTOR inhibition decreased pAKTS473 expression, 2) that both allosteric and catalytic mTOR inhibition increase pERKT202/Y204 expression, and 3) combined MEK and mTOR inhibition induced cell death better than single pathway inhibition alone. Finally, we noted that hierarchal clustering of KIRC_TCGA RPPA (reverse phase protein array) data by markers of mTOR and MEK activation revealed subclasses respective to mTOR and MEK/ERK signaling with significant differences in clinical outcome.
We next asked how allosteric versus catalytic mTOR inhibition affected the metabolically conserved process known as autophagy. While both allosteric and catalytic inhibition increased autophagic flux; catalytic mTOR inhibition did so to a greater degree. To determine if this was due to catalytic mTOR inhibitors’ ability to attenuate mTORC2 signaling we assessed autophagic flux in cell lines stably
expressing shRNAs targeting Raptor or Rictor, essential components for mTORC1 and mTORC2 signaling, respectively. Knock-down of Raptor results in an increase in autophagic flux, however knock-down of Rictor also increases autophagic flux
I dedicate this dissertation to Jennifer Streicker. Jenn is an unbelievable teacher, fighter, cancer survivor, and one aware of the opportunity to live life to the fullest. Words can’t
ACKNOWLEDGEMENTS
First, I would like to thank UNC Chapel Hill’s Biological and Biomedical Sciences Program for giving the opportunity to pursue my Ph.D. I’m extremely grateful for the opportunity that my mentor and P.I., Dr. William Y. Kim gave me to work in his
laboratory. Some of my most exciting times during the program have been conversing with him about data and experimental design. He taught me how important it is to stay in tune with the current literature and to always push to conduct clean and thoughtful science, and most importantly to never sell myself short.
I would like to thank my parents, Harold and Denise, for being extremely supportive, as I have made this journey. Their continuous support and confidence in me to not only reach for high goals, but also obtain them is something I will carry with me and pass on within my family. I would also like to thank my sister, Lauren, for her support and listening ear when times were tough, but also times of reward and
extremely excited to about our opportunity to achieve our carrier and life goals in Los Angeles, CA.
My opportunity as an undergraduate at North Carolina State University (NCSU) to work in Dr. Russell Borski’s lab was an experience that fueled my curiosity about molecular biology. My time at NCSU gave me my first independent research project and the confidence to pursue a graduate level education in science.
My opportunity to attend graduate school largely comes from the opportunity given by Beth Hollister at Piedmont Research Center (PRC). PRC saw potential in me and gave me my first job in pre-clinical drug development for oncology therapeutics. The skill set engrained into me by excellent training plays a pivotal role in why I am able to share this dissertation.
Finally, I would like to thank my many friends, colleagues, and lab members at UNC Chapel Hill. Specifically, I would like to thank Pat Phelps and Ashalla Freeman of IMSD for creating a group capable of not only career support, but also social comfort as well. I would like to give an enormous amount of gratitude to the GMB administrative staff for providing aid when needed the most. I also would like to thank Brian Gibbs, Daniel Dominguez, and Nick Gomez for being close friends and keeping the vision that hard work and commitment equal positive results. I would also like to thank all my close friends for trying to understand why I have been in school for so long and that the
journey to learn and the energy directed to achieving one’s goals is never over.
TABLE OF CONTENTS
Table of Contents ... viii
List of Tables ... xi
List of Figures ... xii
List of Abbreviations ... xiv
Introduction: Targeting mTOR in renal cell carcinoma ... 17
1.1 Renal cell carcinoma ... 17
1.1.1 VHL and ccRCC relevance ... 18
1.1.2 VHL and HIFα regulation ... 19
1.1.3 HIF and HIF target genes ... 21
1.1.4 HIF1-α and HIF2-α contribution in ccRCC ... 22
1.2 Therapeutic options for advanced ccRCC ... 23
1.3 mTOR signaling ... 25
1.4 Autophagy ... 30
1.4.1 Autophagy and cancer ... 32
1.5 ccRCC and mTOR signaling ... 33
1.6.1 Pharmacologic targeting of mTOR in ccRCC ... 34
1.6.2 Autophagy induction through mTOR inhibition ... 36
mTOR inhibition induces compensatory, therapeutically targetable
MEK activation in renal cell carcinoma ... 39
2.1 Overview ... 39
2.2 Introduction ... 40
2.3 Results ... 42
2.3.1 Novel renal cell carcinoma cell lines lack VHL and overexpress HIFα ... 42
2.3.2 Catalytic mTOR inhibitors block mTORC1 signaling more fully than allosteric mTOR inhibition ... 43
2.3.3 Catalytic mTOR inhibition is superior to allosteric mTOR inhibition at attenuating cellular proliferationand inducing apoptosis ... 45
2.3.4 mTORC2 activity negatively regulates the apoptotic response through phosphorylation of AKT ... 47
2.3.5 mTOR inhibition induces compensatory activation of MEK/ERK signaling ... 47
2.3.6 Combination of mTOR and MEK inhibition attenuates cellular proliferation and increases the apoptotic response ... 50
2.3.7 Subclasses of RCC can be defined by MEK and mTOR pathway activation ... 51
2.4 Discussion ... 54
2.5 Materials and methods ... 56
2.6 Supplemental Figures ... 61
Autophagy is a targetable compensatory survival pathways, increased in the context of mTOR inhibition in renal cell carcinoma ... 66
3.1 Overview ... 66
3.2 Introduction ... 66
3.3 Results ... 69
3.3.2 Both mTORC1 and mTORC2 restrain autophagic flux ... 73
3.3.3 Autophagy inhibition enhances the anti-proliferative effects of mTOR inhibition in RCC ... 75
3.3.4 Autophagy inhibition enhances the apoptotic effects of mTOR inhibition in RCC ... 77
3.4 Discussion ... 79
3.5 Materials and Methods ... 82
3.6 Supplemental Figures ... 85
Conclusions and Discussion ... 87
4.1 Compensatory pathway activation and potential molecular mechanisms induced by mTOR inhibition in RCC ... 87
LIST OF TABLES
LIST OF FIGURES
1.1. VHL regulation of HIFα ... 20
1.2. HIFα stabilization ... 21
1.3. mTOR complexes – regulation and function ... 26
1.4. mTORC1 and mTORC2 signaling ... 28
1.5. Autophagic flux pathway ... 32
2.1. Novel renal cell carcinoma cell lines lack VHL and overexpress HIF ... 43
2.2. Catalytic mTOR inhibitors block mTORC1 signaling more fully than allosteric mTOR inhibition. ... 45
2.3. Catalytic mTOR inhibition attenuates proliferation and induces apoptosis better than allosteric mTOR inhibition. ... 46
2.4. Combined mTOR and MEK inhibition attenuates cellular proliferation and increases the apoptotic response. ... 49
2.5. Subclasses of RCC can be defined by MEK and mTOR pathway activation. ... 53
SF 2.1. ... 61
SF 2.2. ... 62
SF 2.3. ... 62
SF 2.4. ... 63
SF 2.5. ... 64
3.1 Catalytic mTOR inhibition induces autophagic flux greater than allosteric mTOR inhibition. ... 72
3.2. Both mTORC1 and mTORC2 regulate autophagy. ... 75
3.4. Autophagy inhibition increases the apoptotic response in
conjunction with mTOR inhibition. ... 79
SF 3.1. ... 85
SF 3.2. ... 86
LIST OF ABBREVIATIONS
4E-BP1: eukaryotic translation initiation factor 4E (eiF4E)-binding protein 1 AGC: protein kinase A/protein kinase G/protein kinase C
AMPK: AMP-activated protein kinase ATG: autophagy regulating protein
BAD: BCL2-associated agonist of cell death BEZ: BEZ235
BNIP3: BCL2/Adenovirus E1B 19kDa Interacting Protein 3 CA9: carbonic anhydrase 9
ccRCC: clear cell renal cell carcinoma CQ: chloroquine
DEPTOR: DEP domain-containing mTOR-interacting protein EGFR: epidermal growth factor receptor
EPO: erythropoietin
FDA: Food and Drug Administration
FKBP12: FK506-binding protein of 12 kDa GAP: GTPase-activating protein
GEMM: genetically engineered mouse model GLUT1: glucose transporter protein type 1 GSK: GSK212
HRE: hypoxia response element IL-2: interleukin-2
INF-α: interferon alpha
IRS-1: insulin receptor substrate 1 KD: knock-down
KIRC: Kidney Renal Cell Clear Cell Carcinoma LDHA: lactate dehydrogenase A (LDHA) MAPK/ERK: mitogen activated protein kinase MEK: mitogen-activated protein kinase kinase mLST8: mammalian lethal with sec-13 protein beta
mSin1: mammalian stress-activated map kinase-interacting protein1 mTOR: mechanistic target of rapamycin
NDRG1: N-myc downstream regulated gene 1 protein PDH1: pyruvate dehydrogenase kinase 1
PEPCK: phosphoenolpyruvate carboxykinase PKCα: protein kinase C-alpha
PRAS40: proline-rich AKT substrate 40 kDa PROTOR: protein observed with rictor protein PTEN: phosphatase and tensin homolog Rap: rapamycin
Raptor: regulatory-associated protein of mTOR RCC: renal cell carcinoma
Rictor: rapamycin-insensitive companion of mTOR RTK: receptor tyrosine kinase
S6K1 - S6 kinase 1
SGK1: serum/glucocorticoid regulated kinase 1
SLC2A1: solute carrier family 2 (facilitated glucose transporter), member 1 TCGA: The Cancer Genome Atlas
TGFa: transforming growth factor alpha TKI: tyrosine kinase inhibitor
TSC1/2: tuberous sclerosis 1/2
ULK1: Unc-51 like autophagy activating kinase 1 VEGF-R: vascular endothelial growth factor receptor VEGF: vascular endothelial growth factor
VHL: von Hippel-Lindau
CHAPTER 1
INTRODUCTION: TARGETING MTOR IN RENAL CELL CARCINOMA
1.1 Renal cell carcinoma
tightly associated with mutations in the von Hippel-Lindau (VHL) tumor suppressor gene, and will be the main RCC subtype focused on within this document [3,6].
Table 1.1: Sporadic and hereditary RCC characteristics: Histological, incidence, genetic lesion, and inherited syndrome correlation of RCC
1.1.1 VHL and ccRCC relevance
The VHL gene has been shown to function as a tumor suppressor through both functional and genetic evidence [7]. VHL disease effects 1:35,000 individuals and is an autosomal dominant cancer syndrome consisting of a spectrum of tumors, but most commonly ccRCC, hemangioblastoma, and pheochromocytoma [6]. Interestingly, there are direct genotype-phenotype correlations for VHL disease patients. Specifically, Type1 or Type 2B VHL disease patients present with clinical manifestations associated with RCC. It’s important to note, in the case of inherited ccRCC, that loss of
heterozygocity of the remaining wild-type allele results in renal cysts followed by tumor initiation and these lesions are multifocal and can occur bilaterally in both kidneys [8].
Sporadic mutations and hypermethylation of VHL may also occur in individuals that are wild-type for both VHL alleles, and interestingly occurs in ~90% of patients with
Sporadic RCC Hereditary RCC
Histology Incidence (%) Gene Syndrome Inherited Gene
ccRCC ~65 VHL VHL disease VHL
Papillary ~15-20 MET HLRCC HPRC MET FH
Chromophobe 5 Birt-Hogg-Dubé syndrome BHD
Oncocytoma 4 Birt-Hogg-Dubé syndrome BHD
sporadic RCC [9]. As with inherited ccRCC, loss of the remaining wild-type allele is necessary for sporadic tumor formation. However, unlike hereditary ccRCC’s multi-focal presentation, sporadic ccRCC tumors form as multi-focal lesions in a unilateral fashion [8].
1.1.2 VHL and HIFα regulation1
The VHL gene is composed of 3 exons located on the short arm of chromosome 3 and codes for the protein VHL (pVHL). pVHL expression is not restricted to tissues effected by VHL disease [10]. pVHL functions in a ubiquitin ligase complex consisting of several proteins: elongin B, elongin C, Cul2, and Rbx1 [7]. When functional, and in normoxic cellular environments, this complex targets HIFα proteins for proteosomal degradation [11] (Figure 1.1).
11.1.2-1.1.4 modified from Jonasch E, Futreal A, Davis I, Bailey S, Kim WY, Brugarolas J, Giaccia AJ,
State-of-the-Figure 1.1: VHL regulation of HIFα. Functional pVHL post transcriptionally ubiquitinates HIFα targeting it for proteosomal degradation.
However, in the context of hypoxia, hereditary VHL disease associated RCC or sporadic ccRCC this negative regulation of HIFα is perturbed (Figure 1.2).
Normoxia
P OH
pVHL
Elongin B Cul2
Rbx1
Ubiquitin Ligase complex Elongin C
Ub
P OH
Proteosomal Degradation of HIF-α
Ub UbUb
HIF-α
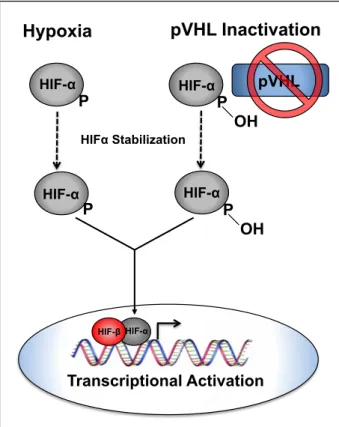
Figure 1.2: HIFα stabilization. Under hypoxic conditions or when pVHL is non-functional HIFα is not hydroxylated resulting in perturbation of pVHL binding and subsequent HIFα stabilization. Stabilized HIFα translocates to the nucleus to form a dimer with HIFβ and activate transcription of HIFα target genes.
The interaction between HIFα and pVHL is mediated by an enzymatic, post-translational hydroxylation of HIFα on conserved prolyl residues (by a family of HIFα prolyl hydroxylases (PHDs or EGLNs). In keeping with the notion that regulation of HIF is an important function of pVHL, the majority of disease associated VHL mutations are predicted to abolish the interaction between pVHL and HIFα resulting in an upregulation of HIFα target genes [12].
1.1.3 HIF and HIF target genes
The HIF proteins are a family of transcription factors that contain a basic helix-loop-helix domain and function in a heterodimeric complex [13]. There are three known
Hypoxia pVHL Inactivation
P OH P
pVHL
P
HIFα Stabilization
P OH
HIF-α HIF-α
HIF-α
HIF-α
HIF-α HIF-β
HIFα subunits (HIF1α, HIF2α, HIF3α) which heterodimerize with their binding partner ARNT (HIF1β) to transcriptionally regulate target genes containing hypoxia response elements (HREs). HIF1α and HIF2α, are best characterized and are known to regulate transcriptional programs associated with cellular and physiological adaptation to
hypoxia such as erythropoietin (EPO), vascular endothelial growth factor (VEGF), and carbonic anhydrase 9 (CA9), amongst others [14,15]. While there is significant overlap in genes that are transcriptionally activated by HIF1α and HIF2α, each HIF family member is thought to also transactivate unique target genes [16]. For example, HIF1α has been linked to regulating genes in pathways associated with glycolytic metabolism and autophagy such as, solute carrier family 2 (facilitated glucose transporter), member 1 (SLC2A1) also known as glucose transporter protein type 1 (GLUT1), pyruvate
dehydrogenase kinase1 (PDK1), lactate dehydrogenase A (LDHA), and
BCL2/Adenovirus E1B 19kDa Interacting Protein 3 (BNIP3) [17]. HIF2α is uniquely responsible for transcriptionally activating genes associated with proliferation and de-differentiation, transforming growth factor alpha (TGFα), CCND1 (Cyclin D1), and Oct4, respectively [13,18,19].
1.1.4 HIF1-‐α and HIF2-‐α contribution in ccRCC
mutations in HIF1α [24], while copy number analysis of ccRCC cell lines and primary tumors suggest that the HIF1α locus is frequently lost along with the long arm of chromosome 14 (14q) [25]. Secondly, while all VHL defective clear cell renal cell carcinomas appear to overexpress HIF2α, about one third of these tumors appear to lack HIF1α expression as well [26]. Finally, functional studies in vitro and in vivo suggest that over expression of HIF1α in VHL wild type cells restrains tumor growth while suppression of HIF1α in VHL deficient cells enhances tumor growth [18,25,27]. Together these studies show support for HIF1α as tumor suppressor gene in renal cancer development and HIF2α as a key driver for renal cancer progression.
While there are a number of reasons to explain the contrasting properties of HIF1α and HIF2α in ccRCC pathogenesis, one intriguing observation is that HIF1α and HIF2α have opposing roles on the regulation of c-Myc activity. Specifically HIF1α acts to suppress c-Myc activity while HIF2α promotes the transactivation or transrepression of c-Myc specific target genes [26,28,29]. In keeping with this notion, ccRCC tumors that exclusively express HIF2α have increased proliferation rates. Furthermore, intriguingly, a subset of clear cell RCC tumors appear to have copy number amplification of 8q24, where c-Myc resides [30,31].
1.2 Therapeutic options for advanced ccRCC
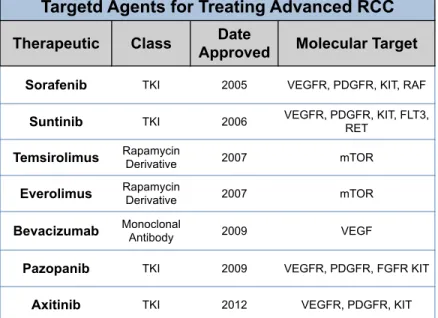
alfa (INF-α) and interleukin-2 (IL-2) [32]. Within the past 10 years, there have been seven targeted therapeutics approved by the Food and Drug Administrations (FDA) for treating advanced RCC. These seven drugs consist of small molecule receptor tyrosine kinase (RTK) inhibitors and biologicals (i.e. monoclonal antibodies) targeting angiogenic pathways, and targeted agents directed at inhibiting the mammalian target of rapamycin (mTOR) (Table 1.2) [33].
Table 1.2: FDA approved targeted agents for treating advanced RCC.
Interestingly, patients treated with inhibitors targeting vascular endothelial growth factor receptor (VEGF-R) appear to have the best response rates, with allosteric mTOR inhibitors (everolimus and temsirolimus) having the most modest responses, yet still prolonging overall survival [3]. The modest response rates seen with allosteric mTOR inhibition warrants a better understanding of RCC biology in the context of allosteric mTOR inhibition and/or inhibitors capable of more complete inhibition of mTOR. However, there is still much needed understanding of the consequences of mTOR inhibition in the context of RCC. Henceforth, advanced efforts to better understand the
Targetd Agents for Treating Advanced RCC
Therapeutic Class Approved Date Molecular Target
Sorafenib TKI 2005 VEGFR, PDGFR, KIT, RAF
Suntinib TKI 2006 VEGFR, PDGFR, KIT, FLT3, RET
Temsirolimus Rapamycin Derivative 2007 mTOR
Everolimus Rapamycin Derivative 2007 mTOR
Bevacizumab Monoclonal Antibody 2009 VEGF
Pazopanib TKI 2009 VEGFR, PDGFR, FGFR KIT
biologic consequences of mTOR inhibition has elucidated potential targetable
compensatory survival pathways capable of increasing efficacy and modest response rates.
1.3 mTOR signaling
mTOR is a serine/threonine kinase within the phophoinositide 3-kinase (PI3K)-related kinase family and is homologous to yeast TOR [34]. mTOR is one of the most widely studied nutritional sensors for cellular and organismal integrity. mTOR functions in two distinct complexes known as mTORC1 and mTORC2, and discoveries alluding to the realization that mTOR regulates signal transduction in two unique complexes was made possible by the observation that mTOR was a unique target of rapamycin, hence the acronym “TOR”. Rapamycin inhibits mTORC1 in an allosteric manner binding to FK506-binding protein of 12 kDa (rapamycin) to bind to the
FKBP12-rapamycin binding domain (FRB) of mTOR. A recent co-crystal structure of a truncated form of mTOR and mLST8 revealed that the FRB domain acts as a gatekeeper granting access of mTOR substrates to the catalytic-active site of mTOR. Of additional
importance, the FRB domain of mTOR cannot be accessed by FKBP12-rapamycin resulting in ineffective inhibition of downstream mTORC2 signaling [35]. More detail of the effects of rapamycin on mTORC1 and mTORC2 signaling will be discussed in later sections of this document.
associated protein of mammalian target of rapamycin (Raptor) are distinct to mTORC1, and mammalian stress-activated map kinase-interacting protein1 (mSin1), protein observed with Rictor1 and 2 (protor1/2), and rapamycin-insenstive companion of mTOR (Rictor) are specific to mTORC2 [36]. Importantly, Raptor and Rictor serve as essential components for mTORC1 and mTORC2 signaling, respectively [37,38].
At this time, regulation and function of mTORC1 is understood in more detail than mTORC2, most likely due to the use of rapamycin and its specificity to target the mTORC1 pathway. Specifically, mTORC1 has been described to act as signal
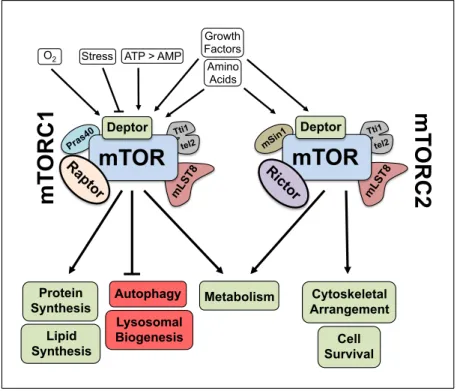
transduction hub processing extracellular and intracellular cues such as hypoxia, energy levels, growth factors, and nutrients to regulate macromolecular biosynthesis, cell cycle progression, cellular growth, autophagy, and metabolism (Figure 1.3) [36].
Figure 1.3: mTOR complexes – regulation and function.
The discovery that the tuberous sclerosis 1 (hamartin) and 2 (tuberin) complex (TSC1/2) functions upstream of mTORC1 to negatively regulate its activity is a hallmark
mLST 8 Pras 40 Tti1 tel2
mTOR
Deptor Ra pto rmT
ORC1
mLST 8 mSin1 Tti1 tel2mTOR
Deptor Ricto rmT
ORC2
StressO2 ATP > AMP
Growth Factors Amino Acids Lipid Synthesis Protein
Synthesis Metabolism
connecting augmented mTOR signaling to cancer [39]. Inactivation of TSC1/2 function correlates with the hereditary TSC syndrome which can manifest an array of different tumor types [40]. Hypoxic cellular conditions through regulated in development and DNA damage responses 1 protein (REDD1) and high AMP:ATP ratios through AMP-activated protein kinase (AMPK) directly activate TSC1/2 [41]. Active TSC1/2
negatively regulates mTORC1 through its GTPase-activating protein (GAP) activity to inhibit Ras homolog enriched in brain (Rheb) GTPase. In contrast, growth factors through stimulation of MEK/ERK and PI3K/AKT signaling cascades are capable of inhibiting TSC1/2 leading to a GTP bound activated Rheb to activate mTORC1 [36]. Interestingly, nutrient signaling (i.e. amino acids) dependent activation of mTORC1 does not appear to rely upon signaling through the TSC1/2 complex, and also appears to be the only essential extracellular signaling factor able to activate mTORC1 in isolation [42].
Activated mTORC1 is responsible for directly phosphorylating several effectors involved in anabolic processes such as protein synthesis, lipid biogenesis, and
metabolism [36]. mTOR also negatively regulates autophagy and lysosome biogenesis. Interestingly, lysosomes and the enzymes found within their vesicles are essential
components of the autophagic machinery.
The best understood effectors of mTORC1 are S6 kinase 1 (S6K1) a member of the protein kinase A/protein kinase G/protein kinase C (AGC) protein family, and
is part of a negative feedback loop involving RTKs responsible for regulating PI3K/AKT signaling (Figure 1.4) [44].
Figure 1.4: mTORC1 and mTORC2 signaling. Distinct signaling nodes specific to mTORC1 and mTORC2. mTORC1 phosphorylates S6K resulting in a negative feedback loop initiated by S6K mediated downregulation of IRS-1. Downregulation of IRS-1 regulates RTK mediated PI3K signaling. mTORC2 phosphorylates various AGC kinases: AKT, PKCα, SGK1. GF, growth factors; RTK, receptor tyrosine kinase.
One, well studied mechanism, is through insulin ligand signaling through insulin receptor substrate 1 (IRS-1). Kobayashi and colleagues demonstrated that active mTORC1 signaling through downstream effector, S6K1, can downregulate IRS-1 and this may occur through S6K phosphorylation of IRS-1 and subsequent subcellular relocation of IRS-1. The posttranslational phosphorylation of IRS-1 is thought to re-localize IRS-1, targeting it for proteosomal degradation and leading to subsequent decreases in PI3K/Akt signaling [45,46].
AKT
S6K 4E-BP1
mTORC1
mTORC2 GF
RTK RTK
PI3K
IRS1
TSC1
TSC2
RHEB
PDK1
Aside from enhancing various anabolic processes, mTOR is also responsible for negatively inhibiting autophagy. Autophagy is a homeostatic process involving the catabolism of aggregated proteins and damaged mitochondria to essentially recycle necessary building blocks for cellular homeostasis [47]. Recently, mTORC1 has been shown to inhibit autophagy through the direct phosphorylation of an essential autophagy regulating protein (ATG) known as Unc-51 like autophagy activating kinase 1 (ULK1) at Ser 757 [48,49]. Autophagy is activated in conditions of low nutrients, hypoxia, low energy, and various cellular stresses and will be discussed in more detail in a later section of this document [50-52].
As mentioned before, mTOR is also the catalytic kinase within the mTORC2 complex, and this complex also appears to be sensitive to hormones (i.e. insulin), growth factors, and nutrients (amino acids) [53]. In conjunction with mTORC1,
mTORC2 also regulates cellular metabolism, but autonomously regulates cytoskeletal organization and cell survival pathways [36]. Like mTORC1, mTORC2 is also capable of phosphorylating several members of the AGC protein family (Figure 1.4) [54]. mTORC2 is responsible for phosphorylating serum/glucocorticoid regulated kinase 1 (SGK1) and AKT within their hydrophobic motifs [55,56]. Furthermore, ablation of mTORC2 activity by knock-down of Rictor decreases expression of phosphorylated N-myc downstream regulated gene 1 protein (NDRG1) at Thr 346, a direct substrate of SGK1 [55,57]. It has also been shown that growth factors are dispensable for
mTORC2 phosphorylation of AKT at Ser 473 and protein kinase C-alpha (PKCα) at Ser 657, two additional AGC protein kinases capable of regulating cell survival and
Furthermore, work within the mTOR field has demonstrated that loss of the TSC1/2 complex attenuates mTORC2 signaling while elevating mTORC1 activity [58].
Needless to say there is not a clear mechanistic understanding of how mTORC2 is regulated, but it is important to note that the regulation of mTORC2 activity is complex and an area of much needed study. For example, mTORC2 activity was shown to be required for prostate cancer development in mice harboring a phosphatase and tensin homolog (PTEN) deletion arguing for the development of compounds specifically inhibiting mTORC2 activity [59].
As with the important discovery that mTOR is the functional target of rapamycin [34] and the dogma surrounding mTORC2’s insensitivity to rapamycin [38], it is also important to note the contrasting observation that treatment with rapamycin over
prolonged duration or within specific cellular context is capable of inhibition of mTORC2 [60,61].
One can see that the majority of research devoted to understanding mTOR signaling has been through the understanding of mTORC1, and this is due to the pharmacological tool, rapamycin. However, advances in understanding essential components of mTORC2 signaling has allowed researchers to design experiments to understand mTORC2 specific regulation and downstream signaling. Together, such advances and inevitably drug advancement to target mTORC2 aside from mTORC1 will further advance the mTOR field of research.
1.4 Autophagy
recycle cellular building blocks into essential cellular pathways to maintain cellular homeostasis in the context of various stresses such as low energy, low nutrients, hypoxia, and pharmacological inhibitors such as mTOR inhibitors. Autophagy is also involved in the regulation of gerosuppression (senecscnece) and molecular aging, various aspects of cancer progression and suppression, metabolism,
neurodegenerative diseases, and development [62-66].
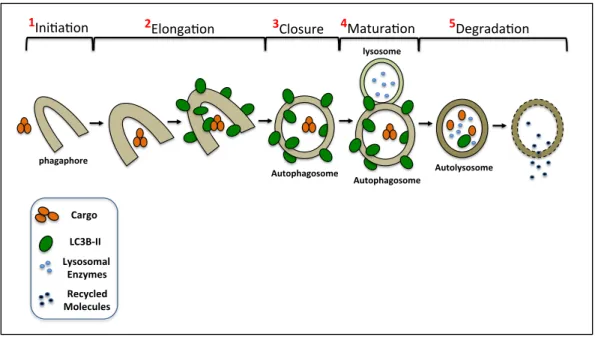
Autophagy can be thought of as a biological process that is in constant flux. Its initiation is molecular regulated by several complexes, ULK1/ATG/FIP200 and
Figure 1.5: Autophagic flux pathway
Furthermore, completion of the autophagy pathway supports cellular homeostasis through provision of essential building blocks for critical cellular and metabolic processes such as energy production, lipid formation, and protein synthesis.
1.4.1 Autophagy and cancer
Recent genetic and molecular understandings have revealed support for autophagy as a pro-tumorigenic mechanism [71-74]. This paradigm is thought to be through autophagy supporting tumor maintenance in hypoxic regions or areas under metabolic stress [75]. However, opposing data also show that autophagy can act as a tumor suppressive cellular function [76-78]. Germline mutations in autophagy
regulating gene, Becn1 (Beclin1) have been observed ovarian, prostate, and breast cancer [79-81]. Additionally, autophagy’s tumor suppressive function may be linked to tumors with defects in autophagy as well as apoptosis. Defects in both of these
pathways can lead to necrotic cell death and a subsequent inflammatory response, inevitably attenuating tumor progression [64]. Importantly, the context at which these 2
phagaphore(
1Ini$a$on' 2Elonga$on'
Autophagosome(
3Closure'
Autophagosome( lysosome(
4Matura$on'
Autolysosome(
5Degrada$on'
Cargo&
LC3B*II& Lysosomal&
paradigms establish themselves is unclear and involves complex cross-talk between both cellular processes, but may be linked to early stages of transformation [68].
Signal transduction pathways, in addition to mutations in specific autophagy regulating genes are also implemented in autophagy regulation of cancer development [62]. It has now been widely accepted that oncogenic and tumor suppressive pathways regulate various metabolic pathways. In addition to mTOR negatively regulating
autophagy, AKT and epidermal growth factor receptor (EGFR) have been shown
phosphorylate Beclin1 to negatively regulate autophagy through an mTOR independent mechanism [82,83]. As the field advances and elegant temporal and spatially controlled GEMMs are developed, a more clear understanding of ATGs, oncogenes, and tumor suppressors and their contribution to autophagy being tumor suppressive or tumor promoting will able to be addressed.
1.5 ccRCC and mTOR signaling
Previous studies and more recent TCGA (28% of core set samples) analyses has revealed alterations is various components responsible for increased mTOR signaling in patient ccRCC tumors [31,84]. Abnormal augmentation of oncogenic signaling
pathways suggests possible addiction to the altered pathway. This “oncogenic addiction” reveals possible therapeutic potential and supports why patients receiving temsirolimus or everolimus for advanced RCC show progression free and overall
survival benefit. However, not all patients respond and those that do present sensitivity eventually become refractory to treatment.
rapamycin [85,86]. Furthermore, Thomas and colleagues demonstrated RCC cells harboring loss of pVHL show sensitivity to derivatives of rapamycin, and the efficacy observed may be due to attenuation of translational regulation of HIF by mTOR [86]. Additionally, Toschi and colleagues used RNAi to dissect out the contribution of
mTORC1 and mTORC2 regulation of HIF1α and HIF2α. Their data revealed that RNAi directed to mTOR or Rictor+Raptor positively regulates HIF1α, while mTORC2 inhibition by Rictor KD alone is capable of inhibiting HIF2α [85]. Additionally, TCGA data
analyzing ccRCC tumor samples reported mutations in mTOR and genomic alterations associated with activation of the PI3K/mTOR signaling cascade [31].
Such strategies as those above have revealed some insight into mTOR signaling amplification and subsequent regulation of relative oncogenic and tumor suppressive pathways in ccRCC. These observations shed light into why subpopulations of patients may respond better than others to current therapeutic options for inhibiting mTOR. Lastly, development of therapeutic inhibitors (i.e. catalytic mTOR inhibitors) capable of indirectly inhibiting not only HIF1α but also HIF2α may show increased efficacy against tumor supporting pathways in ccRCC [87,88].
1.6.1 Pharmacologic targeting of mTOR in ccRCC
Rapamycin is a macrolide constructed by StreptomycesHygroscopicus bacteria with high specificity for inhibiting mTORC1 [89] and recent evidence for detecting aberrant mTOR signaling in a variety of cancers has yielded additional rapamycin derivatives (i.e. temsirolimus and everolimus) harboring more acceptable
the treatment of advanced stage renal cell carcinoma [91], and in 2009 everolimus, an orally available analogue of rapamycin, was approved as a second therapeutic option for patients who’s diseased progressed after tyrosine kinase inhibitor (TKI) treatment. However, patients typically acquire resistance to allosteric mTOR inhibitors resulting in progression of their disease [92]. This common clinical observation warrants new efforts to understand potential compensatory survival mechanisms capable of being targeted to improve clinical efficacy.
Advances in drug development has resulted in an array of various mTOR inhibitors capable of inhibiting the kinase activity of mTOR through binding and disruption of the interaction of ATP within the catalytic domain [59]. Disruption of mTOR kinase activity in RCC cells inhibits both mTORC1 and mTORC2 signaling cascades [93-96].
Specifically, catalytic mTOR inhibitors are capable of not only inhibiting S6K but also 4E-BP1 effectors downstream of mTORC1. Respective to mTORC2 inhibition,
treatment with catalytic mTOR inhibitors inhibits AKT compensatory mTORC2 survival signaling induced in the context of allosteric mTOR inhibition. Secondary, to direct inhibition of mTORC1 and mTORC2, catalytic mTOR inhibitors are capable of decreasing HIF2α, an essential component shown to regulate tumor growth and progression and also poor prognosis factor in VHL deficient RCC cells and ccRCC patients [20,94]. Functionally, catalytic mTOR inhibitors are better at decreasing cell viability and tumor growth than allosteric mTOR inhibitors in the context of RCC [94,96]. Clinically, cases have been reported for patients that had above average response rates receiving a derivative of rapamycin after failing VEGF targeted therapy. Deep
sites revealed alterations supporting for activation of the mTOR pathway, illustrating why these select patients responded well to a therapeutic targeting mTOR [97].
Although rapaymcin derivatives have shown to be promising in treating advanced RCC [91,98] there can be activation of compensatory survival pathways [94,95]. For instance, compensatory activation of mTORC2 by rapamycin has been demonstrated in a variety of cancer types [99] and may also serve as a survival mechanism in RCC [100]. Although catalytic mTOR inhibitors have been shown to improve efficacy over allosteric mTOR inhibitors in RCC [94,96] there too are consequences of such inhibition. For instance, rapamycin and catalytic mTOR inhibitors have been shown to induce mitogen activated protein kinase (MAPK/ERK) signaling and autophagy in cancer cells [101-106]. Furthermore, treatment with catalytic inhibitors may increase activity of these pathways more than rapamycin [107,108]. Deciphering the regulation of mTORC1 and mTORC2 on these compensatory pathways in RCC has yet to be investigated more thoroughly and will be the main focus of Chapter 2 of this document.
1.6.2 Autophagy induction through mTOR inhibition
It is well understood that mTOR negatively regulates autophagy, and it has been demonstrated that treatment with mTOR inhibitors is capable of inducing autophagy in cancer cells [93,103,109-112]. Furthermore, several groups have revealed that catalytic mTOR inhibitors appear to augment autophagic flux more than allosteric mTOR
[48,49,113]. Furthermore, only RNAi targeting mTOR was capable of decreasing expression of pULK1S757 in ovarian cancer cells, again suggesting that direct inhibition of mTOR may be the reason for the increased autophagy observed with catalytic mTOR inhibitors when compared to allosteric mTOR inhibitors [107].
Additionally, activation of autophagy via mTOR inhibition has been shown to function as a compensatory survival mechanism that can be targeted to enhance the efficacy of mTOR inhibition on cancer cell proliferation and survival [93,103,111,114]. Interestingly, in glioblastoma [103], it appears that inhibition of autophagy with
rapamycin does not yield the same effect of increasing apoptosis as catalytic
PI3K/mTOR inhibition and autophagy inhibition. However, in RCC cells it appears that a derivative of rapamycin plus autophagy inhibition can induce necroptosis as a
programmed cell-death signal [109]. Understanding the direct role of increasing autophagic flux by differing types of mTOR inhibitors may require a better
understanding of not only mTORC1, but also mTORC2’s regulation of autophagy. Chapter 3 will investigate autophagic flux response to allosteric and catalytic mTOR inhibition to determine if autophagic induction is indeed targetable in RCC cells treated with various mTOR inhibitors.
1.6.3 mTOR inhibition and MEK/MAPK signaling crosstalk
activation was found in 28% of the TCGA ccRCC samples and has been linked to several noted genetic lesions in a cohort of ccRCC patient tumors [31] supporting possible addiction to this pathway and respectable therapeutic targets. Unfortunately, patients with advanced RCC treated with mTOR inhibitors typically result in cytostatic responses followed by an acquired resistance to the current therapeutic regimen. Observations such as these imply the importance to understand potential resistance mechanisms to generate high-order combinatorial approaches prolong survival.
Specifically, compensatory targetable MAPK survival and proliferation signals have been observed in the context of mTOR inhibition [101,102,105,106,116]. Interestingly, it has been noted that allosteric and catalytic mTOR inhibitors have varying effects on MAPK signaling induction [102], but the molecular mechanisms deciphering the sensitivity to this induction are not well understood. A mTORC1-MAPK feedback loop dependent upon PI3K activation has been described through studies with rapamycin as a potential mechanism for the compensatory MAPK activation in the presence of mTOR inhibition [101]. Additionally, activation of p90RSK and the subsequent inhibition of downstream pro-apoptotic effectors are also plausible
mechanisms of resistance to allosteric mTOR inhibition [116]. The importance of mTOR inhibition and compensatory modulation of MAPK apoptotic signaling pathways in RCC has not been established. Therefore, understanding the genetic and molecular
CHAPTER 2
MTOR INHIBITION INDUCES COMPENSATORY, THERAPEUTICALLY
TARGETABLE MEK ACTIVATION IN RENAL CELL CARCINOMA2
2.1 Overview
Rapamycin derivatives allosterically targeting mTOR are currently approved by the FDA to treat advanced renal cell carcinoma (RCC), and catalytic inhibitors of mTOR/PI3K are now in clinical trials for treating various solid tumors. We sought to investigate the relative efficacy of allosteric versus catalytic mTOR inhibition, evaluate the crosstalk between the mTOR and MEK/ERK pathways, as well as the therapeutic potential of dual mTOR and MEK inhibition in RCC. Pharmacologic (rapamycin and BEZ235) and genetic manipulation of the mTOR pathway were evaluated by in vitro assays as monotherapy as well as in combination with MEK inhibition (GSK1120212). Catalytic mTOR inhibition with BEZ235 decreased proliferation and increased apoptosis better than allosteric mTOR inhibition with rapamycin. While mTOR inhibition
upregulated MEK/ERK signaling, concurrent inhibition of both pathways had enhanced therapeutic efficacy. Finally, primary RCC tumors could be classified into subgroups [(I) MEK activated, (II) Dual MEK and mTOR activated, (III) Not activated, and (IV) mTOR activated] based on their relative activation of the PI3K/mTOR and MEK pathways.
2Chapter 2 is from Sean T. Bailey, Bing Zhou, Jeffrey S. Damrauer,Bhavani Krishnan, Harper L. Wilson,
Patients with mTOR only activated tumors had the worst prognosis. In summary, dual targeting of the mTOR and MEK pathways in RCC can enhance therapeutic efficacy and primary RCC can be subclassified based on their relative levels of mTOR and MEK activation with potential therapeutic implications.
2.2 Introduction
Recent statistics suggest that there are predicted to be roughly 65,000 new cases and 14,000 deaths in 2013 from renal cell carcinoma (RCC) [1,3]. Clear cell renal cell carcinoma (ccRCC) is the most common histologic subtype of RCC and the vast majority of sporadic ccRCC have inactivation of the von Hippel-Lindau tumor
suppressor protein (pVHL). Patients with VHL disease have inherited mutations of VHL and renal cyst and/or tumors develop when these individuals undergo somatic
inactivation or loss of the remaining wild-type VHL allele [6,117]. pVHL’s most well understood function is to negatively regulate the hypoxia-inducible factor alpha (HIFα) family of transcription factors (HIF1α, HIF2α, HIF3α) in an oxygen dependent manner via its E3 ubiquitin ligase activity [12,89]. Importantly, pVHL’s tumor suppressor
function is dependent upon the downregulation of HIFα subunits and in particular HIF2α [20-22].
have been developed to inhibit vascular endothelial growth factor receptor (VEGFR) and platelet derived growth factor receptor (PDGFR) [117,119]. Additionally,
temsirolimus and everolimus, derivatives of rapamycin, are approved to treat advanced RCC [89]. While significant tumor responses are seen in the setting of VEGFR
inhibition they are much less common upon mTOR inhibition suggesting potential compensatory survival and proliferative mechanisms that can be co-targeted [91,98].
Rapamycin and its derivatives are allosteric inhibitors of the serine/threonine kinase mechanistic target of rapamycin (mTOR) that require rapamycin’s association with cytosolic protein, FKBP12 [35,89]. mTOR integrates extracellular growth signals with cellular responses such as proliferation, autophagy, metabolism, cell growth and survival [44]. The mTOR protein kinase interacts with several proteins to form two distinct complexes, mTORC1 and mTORC2. Both mTORC1 and mTORC2 are
warranted efforts to develop catalytic mTOR inhibitors capable of perturbing mTOR’s kinase activity and therefore blocking both mTORC1 and mTORC2 complexes [90].
However, recent reports have demonstrated that inhibitors of mTOR are capable of increasing MEK/ERK activation and its associated proliferation and survival signaling in cancer cells [101,105,106,120-123]. Interestingly, several groups have observed that catalytic mTOR inhibition increases compensatory MEK/ERK signaling greater than allosteric mTOR inhibition [102,105]. This particular observation has resulted in pre-clinical and pre-clinical studies utilizing mTOR inhibition in combination with MEK inhibition for treating several cancer types [106,124-126].
Here, we investigate, through both a pharmacologic and genetic approach, the compensatory proliferation and survival pathways observed in the context of allosteric and catalytic mTOR inhibition. The studies conducted here support that catalytic mTOR inhibition may be better than allosteric inhibition at restraining cellular proliferation and increasing apoptosis. However, we also observe that catalytic mTOR inhibition is more robust at initiating compensatory MEK/ERK signaling in RCC. We address these compensatory cross-talk pathways through pharmacologic inhibition and demonstrate that the selected combinatorial approaches reveal an enhanced effect at attenuating cellular proliferation and augmenting the apoptotic response in RCC cells.
2.3 Results
2.3.1 Novel renal cell carcinoma cell lines lack VHL and overexpress HIFα
Cell morphology of the cell lines remained consistent over time. To characterize the novel cell lines VHL, HIF1α, and HIF2α expression of the cell lines were determined by western blot (Figure 2.1B). RCC4 2-1 (VHL null) and RCC4 3-14 (VHL wt) were used as controls to validate current findings. Both the UNC-R1 and the UNC-R2 cell lines lacked appreciable expression of VHL. While both cells lines expressed HIF2α, only UNC-R1 expressed HIF1α (Figure 2.1B), suggesting that UNC-R2 cells have lost HIF1α expression as is seen in a proportion of ccRCC cell lines and primary tumors and
consistent with the notion that HIF1α is potentially a tumor suppressor gene [25].
Figure 2.1: Novel renal cell carcinoma cell lines lack VHL and overexpress HIF (A) Photomicrographs of H&E stains (left panels) and bright field images (right panels) of UNC-R1 and UNC-R2 PDX derived cell lines. (B) Whole cell extracts from UNC-R1 and UNC-R2s were immunoblotted with the indicated antibodies. RCC4 2-1 (VHL null) and RCC4 3-14 (VHL positive) were included as controls.
Previous studies have demonstrated that the dual catalytic PI3K/mTOR inhibitor, BEZ235, inhibits mTORC1 signaling better than allosteric mTOR inhibition with
Figure 2.2: Catalytic mTOR inhibitors block mTORC1 signaling more fully than allosteric mTOR inhibition. The indicated cell lines were treated with the allosteric and catalytic mTOR inhibitors (rapamycin and BEZ235 respectively) at the indicated concentrations for 24 hrs. Whole cell extracts were then immunoblotted with the indicated antibodies.
2.3.3 Catalytic mTOR inhibition is superior to allosteric mTOR inhibition at attenuating cellular proliferation and inducing apoptosis
Previous groups have demonstrated that BEZ235 is better than rapamycin at decreasing cellular proliferation in RCC [94]. We utilized CellTiter-Glo® to measure alterations in cellular viability over the course of 4 days. Consistent with previous results, our data show that BEZ235 inhibits cellular proliferation better than rapamycin (Figure 2.3A, Supplemental Figure 2.2). Interestingly, both primary cell lines (UNC-R1 and UNC-R2), but especially UNC-R2, seemed exquisitely sensitive to BEZ235 as evidenced by significantly fewer cells present at day 4 than to day 0 (Figure 2.3A).
While they prolong overall survival, allosteric mTOR inhibitors such as
everolimus and temsirolimus have displayed little cytotoxic effects in patients (i.e. they lead to few objective responses) [91]. Catalytic mTOR inhibitors have shown increased efficacy in generating an apoptotic response in preclinical studies, likely as a result of decreasing AKT mediated survival signals [111,127]. Treatment of RCC4, 786-0, and RCC10 cells with BEZ235 resulted in increased apoptosis as evidenced by the
increased expression of the apoptotic marker, cleaved PARP (poly ADP ribose polymerase) (Figure 2.3B). Moreover, BEZ235 also increased expression of another apoptotic marker, cleaved-caspase 3, in RCC4 and RCC10 cells (Supplemental Figure 2.3). Interestingly, 786-0 and RCC4 cells showed a decrease in cleaved-PARP
apoptosis by flow cytometry (Annexin V+/PI- fraction) also showed that RCC cells treated with BEZ235 had increased apoptosis respective to rapamycin treated cells (Figure 2.3C). Therefore, catalytic mTOR inhibition is superior to allosteric mTOR inhibition at attenuating cellular proliferation and inducing apoptosis.
assessed for viability on the indicated days using CellTiter-Glo®. Statistical significance was determined by comparing rapamycin and BEZ235 treated groups. (B) The
indicated cell lines were treated with rapamycin and BEZ235 for 48 hours and
immunoblotted with the indicated antibodies. (C) The indicated cell lines were treated with rapamycin and BEZ235 for 48 hours and assessed for apoptosis by flow cytometry analysis of the Annexin V+/PI – fraction. (D) 786-0 cells were stably infected with shRNAs targeting Raptor (mTORC1) or Rictor (mTORC2) and confirmed for knock-down by western blot. (E) Whole cell extracts from 786-0 shNS, shRaptor, and shRictor cells were immunoblotted with the indicated antibodies.
2.3.4 mTORC2 activity negatively regulates the apoptotic response through phosphorylation of AKT
We wanted to determine whether the enhanced apoptosis seen with BEZ235 treatment (relative to rapamycin) was due to its ability to inhibit mTORC2 and
subsequent downregulation of AKT dependent survival signaling. Since there are no pharmacologic inhibitors capable of specifically inhibiting mTORC2, we silenced Rictor expression, which is required for mTORC2 activity (Figure 2.3D). Knock-down of Rictor significantly decreased expression of pAKTS473 and pAKTT308 as well as increased cleaved-PARP (Figure 2.3E). In contrast, knock-down of Raptor, which is required for mTORC1 activity, appeared to slightly decrease cleaved-PARP expression while mildly increasing pAKTS473 or pAKTT308 expression. These results support the notion that the increased apoptosis seen with BEZ235 relative to rapamycin treatment are a result of BEZ235’s inhibition of mTORC2 activity.
2.3.5 mTOR inhibition induces compensatory activation of MEK/ERK signaling
Recent reports have demonstrated cross-talk between the mTOR and MEK/ERK signaling pathways [115]. To see whether this interplay was present in the context of RCC we examined the response of ERK and a canonical ERK substrate, p90RSK, to rapamycin or BEZ235. Both pERK and p-p90RSK were induced by allosteric and
resulted in a slightly larger increase in p-p90RSK in a subset of the cell lines, this was not accompanied by the same amount of induction of pERK. This could reflect
enhanced ERK activity that is not appreciable by pERK western blotting or mTOR inhibition induced p-p90RSK that is ERK independent. However, ERK is the only described kinase to phosphorylate p90RSK on the S380 site [129]. Overall, these results suggest that mTOR inhibition of RCC cells upregulates MEK/ERK signaling and that catalytic mTOR inhibition may do so in a more robust manner than allosteric
Figure 2.4: Combined mTOR and MEK inhibition attenuates cellular proliferation and increases the apoptotic response. (A) The indicated cells were treated for 24 hrs. with rapamycin or BEZ235 and immunoblotted with the indicated antibodies. (B)
786-0 and RCC4 cells were treated increasing doses of GSK212 for 24 hrs. and
assessed for viability on day 4 using CellTiter-Glo® 4. (F) 786-0 and RCC4 cells were plated, allowed to attach, and treated with the indicated drug(s). Photographs of wells containing 786-0 (day 11) and RCC4 (day 17) cells fixed with 4% PFA and stained with 0.1% crystal violet. (G) 786-0 and RCC4 cells were treated with the indicated
compounds for 24 hrs. Whole cell extracts were immunoblotted with the indicated antibodies.
2.3.6 Combination of mTOR and MEK inhibition attenuates cellular proliferation and increases the apoptotic response
Theobservation of increased MEK/ERK signaling in the context of mTOR inhibition led us to hypothesize that attenuation of this compensatory signal may decrease cellular proliferation and induce apoptosis. We saw that 10nM of the MEK inhibitor GSK1120212 (hereafter called GSK212) was sufficient to fully inhibit MEK activity as assessed by pERK T202/Y204 in several RCC cell lines (Figure 2.4B). Treatment of RCC cell lines with rapamycin or BEZ235 led to a decrease in the
percentage of cells in S phase as determined by Edu incorporation (Figure 2.4C). The combination of MEK inhibition with mTOR inhibition led to a potent reduction in S phase fraction, particularly when GSK212 was combined with BEZ235. As expected, MEK inhibition led to hypophosphorylation of Rb as well as downregulation of cyclin B1 and cyclin D1 consistent with increased cell cycle arrest. However, the addition of mTOR inhibition did not further change levels of these proteins (Figure 2.4D).
Despite the fact that the combination of BEZ235 and GSK212 potently inhibited cell cycle progression, there did not appear to be an additive effect on proliferation or colony formation (Figure 2.4E and 2.4F). We hypothesized that this lack of additivity was secondary to the high level of inhibition of proliferation and colony formation by 1
µM BEZ235 alone. Therefore, we determined the IC50 for BEZ235 in several RCC cell
inducing activation of MEK/ERK signaling (Supplemental Figure 2.4B), and examined its effects on proliferation on colony formation. The combination of 2 nM of BEZ235 with GSK212 resulted in significant decreases in proliferation (Supplemental Figure 2.5A) and colony formation (SupplementalFigure 2.5B) over either single agent alone. Furthermore, the combination of mTOR inhibition with MEK inhibition augmented the apoptotic response as evidence of increased C-PARP expression in 786-0 and RCC4 cells treated with the combination (Figure 2.4G). Together, these data support the notion that combined mTOR and MEK inhibition might be an effective therapy in RCC
2.3.7 Subclasses of RCC can be defined by MEK and mTOR pathway activation
To assess the potential relevance of MEK and /or mTOR inhibition in ccRCC we examined reverse phase protein array data (RPPA) from the TCGA clear cell kidney cancer project (KIRC) to determine the relative activation state of these pathways in human RCC [31]. Reverse phase protein arrays are a highly validated technique allowing the assessment of protein expression across hundreds of proteins simultaneously and because of the multiplatform nature of the TCGA allows for
correlations to other genomic aspects of a tumor. To this end, TCGA KIRC tumors were hierarchically clustered using log2 transformed, median centered, RPPA expression data of canonical phosphoproteins that represent activation of the MEK (pERKT202/Y204), PI3K (pAktT308), mTORC1 (p4E-BP1T70, p4E-BP1T37, pS6S235/236, pS6S240/244,
could be also visualized using a plot that graphed the relative expression of the
canonical markers of MEK activation (pERKT202/Y204) and mTORC1 activation (pS6S235) (Figure 2.5B).
Figure 2.5: Subclasses of RCC can be defined by MEK and mTOR pathway activation. (A) TCGA KIRC RPPA data was log2 transformed, median centered. Tumors were then hierarchically clustered and the indicated subgroups were
differences in overall survival by the Log Rank test and shown as a Kaplan-Meier plot of overall survival.
2.4 Discussion
Our studies investigate the relative efficacy of allosteric versus catalytic mTOR inhibition in RCC through both pharmacologic and genetic approaches. We show that as monotherapy, catalytic mTOR inhibition is better at decreasing cellular proliferation and inducing apoptosis than allosteric mTOR inhibition consistent with previous studies in RCC [94]. However, despite these potentially therapeutically beneficial
characteristics, we show that catalytic mTOR inhibition also induces a more robust induction of compensatory MEK/ERK signaling. Nonetheless, the compensatory upregulation in MEK/ERK signaling can be targeted with small molecule kinase inhibition, resulting in enhanced therapeutic efficacy. Finally, we demonstrate that primary RCC tumors can be classified based on their relative activation of the MEK and mTOR pathways and that these different MEK/mTOR subtypes are associated with differences in overall survival.
Dual inhibition of the MEK and PI3K/mTOR pathways has shown preclinical promise as a therapeutic strategy in a variety of tumors [106,122-124,130-132] and has entered into phase 1 trials in humans [125]. Inhibition of the MEK/ERK and PI3K/mTOR pathways is a rational strategy based on the extensive crosstalk between the two
pathways and the well documented compensatory signaling that occurs in the face of MEK or mTOR inhibition [115]. Nonetheless, neither dual inhibition nor the
compensatory cross-talk between the MEK and PI3K/mTOR pathways has been
advanced disease [91]. Therefore, our studies are the first to investigate this crosstalk and its potential clinical relevance in RCC.
Our studies showed that mTOR inhibition in RCC cell lines resulted in increased MAPK signaling in the context of both allosteric and catalytic mTOR inhibition (Figure 4A). Moreover, we noted that catalytic mTOR inhibition enhanced ERK
phosphorylation, as well as phosphorylation of the ERK substrate, p90RSK more than robustly than allosteric mTOR inhibition (Figure 4A and G). Precisely how mTOR inhibition in RCC results in increased MEK/ERK signaling remains to be determined. Further investigation into this is warranted but overall our results are consistent with the notion that kinase inhibition results in upregulation of compensatory pathways and kinome reprogramming [133].
Examination of the RPPA data from the TCGA-Kidney Renal Clear Cell Carcinomas (KIRC) project allowed us to assess the possibility that RCC could be divided into subclasses based on the relative activation of the MEK and mTOR pathways as well as evaluate their potential therapeutic significance [31]. We have named these groups, MEK activated, mTOR activated, dual MEK and mTOR activated, and not activated. We propose that rational targeted therapy for the MEK/mTOR
subgroups might include: MEK activated – MEK inhibitor, mTOR activated – allosteric or catalytic mTOR inhibitor, dual MEK and mTOR activated – combination MEK and
mTOR inhibitor, and not activated – VEGFR tyrosine kinase inhibitor.
shown in a phase III randomized trial to prolong the overall survival of patients with “poor prognosis” as defined by the MSKCC criteria [91,134]. While we cannot be sure that our mTOR activated group corresponds to the “poor prognosis” patients defined by the MSKCC criteria, if they do correlate, our data provides a biological explanation for this interesting clinical observation.
In summary, our studies demonstrate that catalytic mTOR inhibition is more effective than allosteric, but that catalytic mTOR inhibition appears to more robustly induce alternative compensatory pathways (i.e. MEK/ERK). Nonetheless,
compensatory upregulation of MEK/ERK signaling can be co-targeted with enhanced therapeutic effectiveness. Furthermore, we describe distinct subclasses of RCC that can be defined by the activation of the MEK and mTOR pathways, have clinically distinct prognosis, and would be predicted to have differential responses to MEK and mTOR kinase inhibition. In aggregate, our data suggests that catalytic mTOR inhibition should be investigated in RCC and that the compensatory upregulation of MEK/ERK signaling may actually be a potential synthetic vulnerability in RCC
2.5 Materials and methods
Patient-derived xenograft cell isolation
Xenografts were excised and washed in a solution of Pen-Strep, 1XPBS solution (1:1). In sterile conditions, xenografts were then cut into small 2x2mm fragments and dissociated in gentleMACSTM C-Tube (Miltenyi Biotec) using the gentleMACs
Dissociator (program: m_imp Tumor_02) in 5 mL of complete DMEM. Then 100 µL of
round of dissociation using the gentleMACSTM Dissociator (program: m_imp
Tumor_03). 5 mL of protein extraction buffer (PEB: buffer 0.5% FBS, 2mM EDTA in PBS) was added to the dissociated fragments and resuspended by pipetting. The cell suspension was transferred to a 50 mL conical tube through a 40 µm nylon mesh sterile
cell strainer (Fisher). An additional 20 mL of PEB buffer was added to the cell
suspension and it was then centrifuged at 300 g’s for 5 min. Supernatant was removed and cell pellet was resuspended in 6 mL of complete DMEM and placed in a 6 cm sterile cell culture plate. De-identified tumor tissue was obtained from the University of North Carolina Institutional Review Board (IRB) approved tissue procurement facility
after University of North Carolina IRB approval. The animal work was approved by the
University of North Carolina Institutional Animal Care and Use Committee.
Cell lines and culture conditions
RCC10, 786-0, RCC4, UNC-R1, UNC-R2 were cultured in complete DMEM (CORNING-Cellgro #10-013-CV) supplemented with 10%FBS, 1X Penn/Strep at 37°C, 5% CO2, 21% O2. 786-0 cells were obtained from ATCC. RCC4 cells were obtained from Dr. Kimryn Rathmell [11] and RCC10 cells were obtained from Dr. Michael Ohh [135]. RCC tumor tissue from de-identified patients were obtained from the University of North Carolina Institutional Review Board (IRB) approved tissue procurement facility
after IRB approval. UNC-R1 and UNC-R2 cell lines were generated as above from the
renal patient derived xenografts. BEZ235 (Center for Integrative Chemical Biology & Drug Discovery, UNC Eshelman School of Pharmacy), GSK1120212
Immunoblot conditions
Cells were lysed in RIPA buffer complemented with Set I and Set II phosphatase inhibitors at 1X (Calbiochem), and protease inhibitors at 1X (Roche). Whole cell lysate concentration was determined with Bio-Rad Protein Assay Dye Reagent Concentrate (Bio-Rad). Proteins were resolved on SDS-PAGE gels and electrotransferred to nitrocellulose membranes, 0.2 µm (Bio-Rad). Primary antibodies pS6S235/236, S6,
pAKTS473, AKT, p4E-BP1T37/46, 4E-BP1, Cleaved PARP, pAktT308, p62, Rictor, Raptor, HIF-1α, HIF-2α, pERK1/2T202/Y204 (mouse), ERK, p-p90RSKS380, RSK1/2/3, pBADS112, pBADS136, pEGFRY1068, cleaved-caspase3 were from Cell Signaling Technologies®. VHL (Santa Cruz #FL-181). mTOR primary antibody was from Millipore. Primary antibody dilutions were to manufactures’ specifications (See Supplemental Table 1). Tubulin (Sigma #T5168), KU-80 (GeneTex #GTX70485) and Actin-HRP (Santa Cruz #C-11) primary antibodies served as loading controls (LC) where noted. Secondary anti-Rabbit and ant-mouse antibodies were from (Fisher) and diluted in 5% milk, 1X TBS-T solution. ECL Western Blotting Detection reagents (GE Healthcare) were used for developing blots onto autoradiography film. For difficult to detect proteins
SuperSignal® West Femto Maximum Sensitivity Substrate (Thermo Scientific) was used
in combination with ECL.
Cell viability assay
protocol. Cells were counted and plated in quadruplicate in a 96 well opaque side/clear bottom cell culture plates (Corning) in culture medium containing the noted
concentration. Luminescence measurements were captured using a Biotek® Synergy 2 plate reader. 2-way ANOVA analysis was used to determine statistical significance.
Cell cycle analysis by flow cytometry
Cells were plated in triplicate and treated for 24 hrs with indicated drug. Cell cycle analysis was performed by EdU incorporation using Click-iT EdU Alexa Fluor 647 flow assay kit (Invitrogen, catalog number C-10424) according to the manufacturer’s instructions. After treatment cells were exposed to 10 µM EdU for 2h. Cells were then dissociated with 0.05% Trypsin/EDTA and fixed immediately, with 4% PFA, for
incorporated EdU detection. Total DNA content was stained with propidium iodide (PI) at 10 µg/ml after RNase A treatment. Flow cytometry was performed on a CyAnTM ADP flow cytometer (Dako, Glostrup, Denmark) and data analysis was performed using FlowJo software (Tree Star, Inc.). Statistical significance was measured by Student’s T-Test.
Apoptosis analysis by flow cytometry
Cells were plated in duplicate and treated with the indicated drug for 48 hrs. Percentage of apoptotic cells were determined by staining with Annexin V Alexa Fluor® 488 & PI (Dead Cell Apoptosis Kit, Invitrogen, cat# V13241) according to the
analyzed using FlowJo software. Statistical significance was measured by Student’s T-Test.
RNAi experiments
pLKO.1 shRNA plasmids were obtained form the UNC Viral Vector Core, packaged and infected per manufacture’s protocols. Addgene catalogue numbers: shNS (#1864), shRictor (#1853), shRaptor (#1857), shmTOR (#1853). Cells were incubated with viral media over-night, and replaced with fresh complete media. Selection with 1 µg/mL puromycin was started 48 hrs later.
Colony formation assay
RCC cells were plated at low-density in a 6 well plate (786-0: 50 cell/well and RCC4: 100 cells/well). Cells were allowed to attach and treated with indicated drug(s). Treatment conditions were changed every 72 hrs. Cells were fixed with 4% PFA and stained with crystal violet.
TCGA data analysis
Scatter and Kaplan-Meier plots were generated in R (http://cran.r-project.org). Survival differences were determined by log-rank test.
2.6 Supplemental Figures
Supplemental Figure 2.2: RCC10 cells were treated over the course of 4 days with the indicated drugs and assessed for viability using CellTiter-Glo®.