Obesity Alters the Immune Response to Influenza Virus Infection- A Mechanism for Immune Modulation
Alexia Genese Smith
A dissertation submitted to the faculty of the University of North Carolina at Chapel Hill in partial fulfillment of the requirements for the degree of Doctor of Philosophy in the
Department of Nutrition, School of Public Health.
Chapel Hill 2007
Approved by:
ABSTRACT Alexia Genese Smith
Obesity Affects the Immune Response to Influenza Virus Infection - A Mechanism for Immune Modulation
(Under the direction of Melinda A. Beck)
The incidence of obesity worldwide has reached epidemic proportions. This has had a significant economic and social impact due to the increase in co-morbidities associated with obesity (1). Obesity leads to changes in immune parameters under basal conditions (2), suggesting that obesity may result in impaired immune responses during an infection.
Influenza virus infection is a leading cause of morbidity and mortality worldwide, and proper immune regulation is necessary for clearance of virus with minimal damage to the host. Given that obesity leads to impairment in immune function, we hypothesized that obesity would result in an impaired immune response following infection with influenza virus.
lower induction of cytokines that promote anti-viral T cell responses, impaired proliferation and cytokine production by T cells, and delayed infiltration of T cells to the infected lung.
What was the cause of the immune dysfunction? Once possibility was the high circulating leptin levels found in obese mice. Leptin is a hormone that plays a role in both innate and cell-mediated immunity through phosphorylation of Signal transducer and activator of transcription 3 (STAT3) subsequent to binding to its receptor. Despite high circulating leptin, we found that obese mice had reduced STAT3 phosphorylation in immune cells during infection, indicating leptin signaling was impaired and may have mediated some of the immune changes that occurred in obese mice. When we analyzed the impact of direct leptin on immune cell function, we found that direct leptin signaling was not required for normal function. This was shown by correction of immune cell function when a functional neuro-specific leptin receptor was expressed in leptin receptor-deficient, db/db mice. Therefore, the impairment in immune responses that occur in obese mice is, in part, likely due to a lack of centrally mediated effects of leptin.
Dedication
First and foremost I want to thank my advisor, Melinda Beck, for being the person she is. Melinda allows her students the freedom to imagine possibilities, while patiently instilling the values that are necessary for succeeding in the reality of science. Secondly, I want to thank Patricia Sheridan, a great friend on whose shoulders I have stood throughout my time in graduate school. Her influence on me as a person and scientist is more than I would have ever expected, and for which I am eternally grateful. Finally I want to thank my mom, my
TABLE OF CONTENTS
Page
TABLE OF CONTENTS... vi
LIST OF TABLES... x
LIST OF FIGURES ... xi
LIST OF ABBREVIATIONS... xiii
CHAPTER I. BACKGROUND AND SIGNIFICANCE... 1
A. Specific Aims... 1
B. Obesity: A Public Health Perspective ... 2
C. Animal Models of Obesity ... 2
D. Obesity as a Modulator of Immune Function ... 3
1. Adipokine release from adipose tissue. ... 6
2. Leptin ... 6
2.1 Leptin Signaling... 7
2.2 Leptin Resistance. ... 12
2.3 Leptin and Immune Function... 13
2.3.2 Cell-Mediated Immune Response... 14
E. Influenza A: A Public Health Perspective... 16
F. Influenza A: Life Cycle ... 16
G. Immune Response to Influenza Infection ... 19
1. Innate Immune Response... 19
1.1 Respiratory Epithelial Cells ... 19
1.2 Macrophage (MΦ) ... 20
1.3 Dendritic Cells (DC) ... 20
1.4 Natural Killer (NK) Cells... 21
2. Cell-Mediated Immune Response... 21
2.1 Major Histocompatibility Complex ... 22
2.2 T cells... 22
2.2.1 CD4+ T cells ... 23
2.2.2 CD8+ T cells ... 24
3. Virus Induced Cytokine Signaling... 26
3.1 Viral Recogition... 26
3.2 Type I Interferon ... 26
3.3 Type II Interferon... 28
3.4 IL-12 ... 29
3.5 IL-6 ... 29
3.6 IL-10 ... 30
II. INCREASED MORTALITY AND ALTERED IMMUNE FUNCTION IN DIET INDUCED OBESE MICE INFECTED WITH INFLUENZA VIRUS
A. Abstract ... 34
B. Introduction ... 35
C. Materials and Methods ... 37
D. Results ... 41
E. Discussion... 45
III. SELECTIVE IMPAIRMENT IN DENDRITIC CELL FUNCTION AND ALTERED ANTIGEN-SPECIFIC CD8+ T CELL RESPONSES IN DIET-INDUCED OBESE MICE A. Abstract ... 58
B. Introduction ... 59
C. Materials and Methods ... 60
D. Results ... 65
E. Discussion... 71
IV. CENTRAL LEPTIN RECEPTOR SIGNALING RESCUES DEFECT IN NATURAL KILLER CELL CYTOXICITY IN db/db MICE DURING INFLUENZA INFECTION A. Abstract ... 84
B. Introduction ... 85
C. Methods... 87
D. Results ... 92
E. Discussion... 95
V. SYNTHESIS A. Overview of Research Findings... 108
C. Selective impairment in dendritic cell function and altered antigen-specific CD8+ T cell responses in diet-induced obese mice
infected with influenza virus... 111 D. Central leptin receptor signaling rescues defect in natural killer cell
cytoxicity in db/db mice during influenza infection ... 115 E. Future Studies... 117
1. Catecholamine/Neuropeptide-mediated changes in immune
function during obesity ... 117 2. Central versus periperal mediation of leptin's effects on
other immune responses... 117 3. Memory response to influenza infection... 118 4. Different dietary fatty acid sources on the immune response
to influenza infection ... 118 F. Public Health Significance ... 118 REFERENCES ... 120
LIST OF TABLES
Page Table 1.1 Factors that may link obesity and immune function………... Table 1.2 Cytokines and chemokines expressed during influenza virus infection.…… Table 1.3 SOCS proteins and their target molecules……….. Table 3.1 Total number of cells in lung during influenza infection……….... Table 4.1 Phenotype of Nse-Rb db/db transgenic mice……….. Table 4.2 Serum glucose, insulin, and leptin in Nse-Rb db/db mice..……….... Table 4.3 Effects of influenza infection on db/db, Nse-Rb db/db,
and Nse-Rb +/+ mice……….
5 31 33 78 101 102
LIST OF FIGURES
Page Figure 1.1 Leptin Signaling Through Ob-Rb………...……….… Figure 1.2 Leptin’s Effects on cells of the Immune System………..………... Figure 1.3 Life Cycle of the Influenza Virus……… Figure 1.4 Activation of Th1 response by virus infected macrophage………. Figure 1.5 Overview of cytokine/receptor signaling pathways…..……….. Figure 2.1 Blood glucose and serum insulin and leptin levels in influenza infected
obese and lean mice ……….……….. Figure 2.2 Effect of influenza virus infection on mortality, viral titers, and lung
pathology ……….……... Figure 2.3 Lung mRNA expression of antiviral cytokines………... Figure 2.4 NK cell cytotoxicity and lung mRNA expression ….……….…… Figure 2.5 Pro-inflammatory cytokine expression in influenza infected lungs from
lean and obese mice ……….………,,,…………....…... Figure 2.6 Lung mRNA expression of chemokines in influenza infected lean and
obese C57BL/6 mice ……..……… Figure 3.1 Gating strategy to identify cell populations in lungs ………. Figure 3.2 IL-6+ cells in lung during infection ………..……….. Figure 3.3 Population of DN and pDC in total DC population during influenza virus
infection...……….………….. Figure 3.4 Migration of lung DC to LN. DC in the LN were identified by their
expression of CD11c ………..……… Figure 3.5 Stimulation of T cells by viral antigen presented by DCs.... ………. Figure 3.6 Increased frequency of antigen specific CD8+ T cells in obese mice………
Figure 4.2 Obesity blocks STAT3 activation during influenza infection……….. Figure 4.3 Obese mice have reduced proliferation and IFNγ production in response to
PHA...………...……….... Figure 4.4 Central leptin signaling correct impaired NK cytotoxicity in db/db mice
infected with influenza virus ….………...………... 104
105
LIST OF ABBREVIATIONS
AA arachidonic acid
AgRP agouti-related protein
AM alveolar macrophage
AMPK AMP-activated protein kinase APC antigen presenting cell
α-MSH α-melanocyte-stimulating hormone
BALF bronchoaveolar lavage fluid cDC conventional dendritic cell
d day
DC dendritic cell
DIO diet induced obesity
ELISA Enzyme-Linked ImmunoSorbent Assay ELISPOT Enzyme-linked Immunosorbent Spot
EPI epinephrine
FACS fluorescence-activated cell sorting
FITC fluorescein
FFA free fatty acid
GAPDH glyceraldehyde-3-phosphate dehydrogenase HAU hemagglutinating units
IFN interferon
IL interleukin
IRF interferon regulatory factor IRS insulin receptor substrate
JAK janus kinase
JNK c-Jun N-terminal kinase
LF low-fat
LN lymph node
MAPK mitogen-activated protein kinase MCP monocyte chemotactic protein MDCK Madine Darby canine kidney MHC major histocompatibility complex MIP macrophage inflammatory protein
NE norepinephrine
NK natural killer
NPY neuropeptide Y
Ob-Rb leptin receptor
OVA ovalbumin
pDC plasmacytoid dendritic cell
PE phycoerythrin
PHA phytahemagglutinin
p.i. post infection
PolyI:C Polyinosinic:polycytidylic acid
POMC pro-opiomelanocortin
qRT-PCR quantitative reverse transcriptase polymerase chain reaction
RANTES Regulated upon Activation, Normal T-cell Expressed, and Secreted ROS reactive oxygen species
SNS sympathetic nervous system SOCS3 suppressor of cytokine signaling-3
STAT signal transducer and activator of transcription TCID50 50% tissue culture infective dose
Th1 T helper cell 1
Th2 T helper cell 2
TLR Toll-like receptor TNFα tumor necrosis factor-α
CHAPTER I
BACKGROUND AND SIGNIFICANCE A. Specific Aims
The incidence of obesity worldwide has reached epidemic proportions. This has had a significant economic and social impact due to the increase in co-morbidities associated with obesity (1, 20). Obesity leads to changes in immune parameters under basal conditions (2), and therefore suggests that obesity may result in impaired immune responses during an infection.
Influenza virus infection is a leading cause of morbidity and mortality, and proper immune regulation is necessary for clearance of virus with minimal damage to the host. Given the impairment in immune function observed in obesity, we hypothesized that obesity would result in dysregulation of the immune responses during influenza virus infection. The present studies outline a series of experiments that addressed the role of obesity on modulating innate and cell-mediated immune responses during influenza virus infection.
Specific Aims
1. Determine if innate immune responses are impaired in influenza infected obese mice. 2. Determine if the cell mediated immune responses are impaired in obese mice infected with influenza virus.
B. Obesity: A Public Health Perspective
Obesity rates, worldwide, are at an all time high and continue to escalate. In the United States greater than 60% of the population is overweight or obese. Because obesity is a major risk factor for metabolic syndrome, Type 2 Diabetes, and cardiovascular disease, prevalence of these diseases has increased as well. In addition to its adverse effects on metabolic diseases, obesity also results in impaired immune function (23-25), although little is known about the impact of obesity on infectious disease. Obesity is a significant
contributor to health care costs due to the increase in co-morbidities associated with it. Raebel et al reported that the cost of healthcare for an obese individual was 250 dollars more per year than non-obese individuals (28). More importantly, the pervasiveness of obesity has extended to the young and it is so dramatic that a potential decline in lifespan has been proposed for the next generation (29).
C. Animal Models of Obesity
Obesity in humans is primarily the result of an imbalance in caloric intake and caloric expenditure (30, 31). In mice, obesity can develop in the same way through feeding of a high fat diet. C57BL/6 mice are one of the most commonly used strains for diet induced obesity. When fed a high fat diet these mice develop significant increases in adipose tissue mass, circulating glucose, insulin, and leptin (32, 33). The effects of the high fat diet in C57BL/6 mice are analogous to humans, making it an excellent model for studies related to obesity.
of obesity are the ob/ob and db/db models, both of which have single-gene loss-of-function leading to a premature stop codon in the leptin gene and abnormal splicing of the long form of leptin receptor, respectively. The lack of leptin signaling in these mice leads to extreme hyperphagia, hyperglycemia, and hyperleptinemia, as well as hypercorticosteronemia and infertility (35, 36), effects which are not normally seen in obese humans (37).
D. Obesity as a Modulator of Immune Function
Obesity is implicated in immunosuppression in both humans and mice (23, 25, 38). In humans, obesity has been shown to be a risk factor for infections and poor wound healing after a variety of surgical procedures (23, 25), as well as for increasing the risk of infection and sepsis in burn patients (24). Additionally, obesity results in changes in the circulating T cell population (2) and diminished bacterial killing capacity of polymorphonuclear cells (39).
Studies of immune function in diet-induced obese (DIO) mice have focused primarily on mononuclear cell function ex vivo (48-51) with little work done in regard to immune responses to infectious disease (52). However, the current research does indicate that diet induced obesity also impairs immune function. For example, diet-induced obese mice have impaired antigen presentation and stimulation of T cell proliferation (53), while rats fed a cafeteria diet to induce obesity, display helper T cell lymphopenia and decreased natural killer (NK) cell function (48, 49). Additionally, DIO mice have decreased hepatic NKT cells and alterations in mitogen stimulated splenocyte proliferation and cytokine production (50, 51). So, there is clearly a dysregulation of immune function in DIO mice.
It is currently unknown why obesity leads to changes in immune function, but many pathways that are altered during obesity have important roles in immune responses. These include: nuclear factor kappa B (NF-κB), Phosphoinositide-3 kinase (PI3K), glucocorticoids,
Table 1.1. Factors that may link obesity and immune function
Factor Metabolic Effect Immune Effect During obesity References Adiponectin + AMPK
+ GLUT4 - SREBP1
Anti-inflammatory - NF-κB + PPARα
- Scavenger R on macrophage
Reduced (3-5)
Leptin + Lypolysis - Food intake + PI3K
Inflammatory +NFκB +JAK/STAT + Th1 Increased (but downregulation of signal) (6-8)
Glucose (High) + Insulin +ROS +PKC
Inflammatory +NFκB
+JNK, p38
Increased (9, 10)
FFA - Insulin-stimulated glucose uptake + PKCθ
+ IKK + JNK
Increased/no change (no change in DIO mice)
(11-13)
Insulin + Glucose uptake - Food intake - Lypolysis
- Inflammation Increased (but downregulation of signal)
(14)
Macrophage in WAT
- PI3K + Local NFκB
+inflammation
Increased (15) (16) Catecholamine NE EPI +Lypolysis - Adipocyte proliferation + Thermogenesis +/- Th2/Th1 - NK cell activity
Increased NE Decreased EPI
(17-19)
Glucocorticoids + Adipogenesis + Gluconeogenesis + Food intake
-NK cell activity - Inflammation
Increased / no change
(17, 21) (22)
Neuropeptides NPY POMC
- Lipolysis + Food intake
+ Ag presentation - T cell response
Increased/no change NPY Decreased POMC
1. Adipokine release from adipose tissue
Adipose tissue is now recognized as a major endocrine and secretory organ (54), secreting molecules that function in a variety of physiological pathways, such as regulation of food intake (55), angiogenesis (56), and immune responses (57). The molecules that mediate these effects are collectively known as adipokines, which are are secreted by adipose tissue and act on cells in an autocrine and paracrine manner. For example the adipokine leptin is produced mainly by adipocytes and acts in the hypothalamus to decrease food intake, but also signals adipocytes to induce lipolysis (58). Leptin and adiponectin are the most abundantly produced adipokines, but resistin and visfatin are also important adipokines (3). Other adipokines include molecules that are classically associated with the immune response, such as IL-6, TNF-α, and C-reactive protein (59).
2. Leptin
Leptin is the 16 kDa product of the ob gene that is produced primarily by adipocytes and is member of the family of long helical cytokines (60). Leptin increases proportionately to adipose mass, and therefore circulates at high levels in obesity (61). Through central and peripheral actions leptin regulates adiposity, fertility, glucose tolerance, and immune function (62-64).
Leptin acts in several regions of the hypothalamus, but leptin signaling is most readily detectable in the arcuate nucleus in two distinct neuronal populations. One population
that suppress Ob-Rb mediated growth and reproduction. Leptin inhibits their expression while at the same time activating the anorexigenic neuropeptide POMC and its downstream effector α melanocyte-stimulating hormone (αMSH) (65, 66).
Leptin also mediates it effects via direct action on peripheral cells. In adipose tissue, for example, adenovirus induced overexpression of leptin leads to fat depletion in both intact and denervated fat pads, whereas no change in mass occurs in fat pads from fa/fa rats which lack leptin receptors (67). Similarly, leptin also appears to exert direct action on immune cells. For instance, Tian et al. demonstrated that leptin directly enhances NK cell cytolytic activity. When ex vivo cytotoxicity assays were performed in the presence of IL-15, an activator of NK cells, NK cells from both WT and db/db mice display normal killing
capacity. However, the addition of leptin augmented the cytotoxic function of WT NK cells, whereas in NK cells from db/db mice it had no effect (68).
2.1 Leptin Signaling
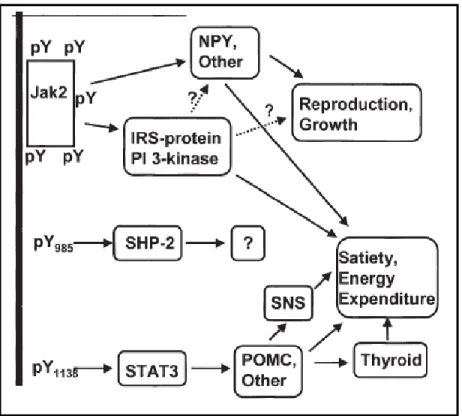
Upon binding to its receptor, leptin stimulates three main signaling cascades that begin with the phosphorylation of tyrosine residues on the receptor’s intracellular domain by a noncovalently bound Janus kinase (JAK) (73). Specifically, JAK2 leads to the activation of signal transducers and activators of transcription (STAT) signaling pathway, the PI3K
pathway, and the mitogen-activated protein kinase (MAPK) pathway.
Activation of the PI3K pathway occurs through insulin-receptor substrate (IRS)-2 and
mediates some of leptin’s anorectic effects. This is evidenced by an increase in feeding and a
decrease metabolic rate in IRS-2 knock out mice despite of high leptin levels (74). Moreover,
inhibition of PI3K activity in the hypothalamus attenuates leptin-mediated hyperpolarization
of NPY/AgRP neurons (75). PI3K signaling is also required for leptin mediated sympathetic
nervous system activation (76).
The effects of leptin activation on the MAPK signaling pathway are less well defined, but it appears that the immunomodulatory effects of leptin are mediated through constituents of this pathway. Leptin signaling through the Ras/Raf/MAPK cascade leads to the activation of genes involved in cell proliferation and differentiation (65). Additionally, leptin also increases p38 phosphorylation in mononuclear cells, suggesting that its ability to promote T cell survival (77) is mediated through this pathway (78). Activation of Ob-Rb also stimulates JNK (c-Jun N-terminal kinase), a stress-activated protein kinase that is activated by
-muscle cells (79), an effect that is important for leukocyte extravasion across the vascular endothelium (80). Additionally, leptin has been shown to enhance TNFα production in
Kupffer cells through this pathway (81). Therefore, leptin augmentation of immune responses may be mediated through this pathway.
The phosphorylated Ob-Rb also recruits signal transducers and activators of
transcription (STAT) to the receptor complex. STAT3, 5, and 6 mediate the transcriptional effects of leptin upon entry into the nucleus (82). STAT3, in particular, has been shown to mediate a number of leptin’s effects. This was shown in mice that had a mutation in the tyrosine residue required for STAT3 recruitment to Ob-Rb (s/s mice). In comparison to db/db mice, s/s mice were; more fertile, normal length, and less hyperglycemic. Additionally, these mice had relatively normal hypothalamic NPY levels, but had low POMC expression and were extremely obese (83). This indicates that STAT3 mediates leptin’s effects on the melanocortin system and adipose accumulation, and points towards another pathway for affecting NPY, reproduction, and glucose homeostasis. Additionally STAT3 mediates leptin’s effects of growth and function of cells through activation of genes such as activator protein-1, c-fos, and egr-1 (84, 85).
STAT3 functions in a number of other pathways, including IL-6, IL-10 and IL-27 signaling (86). The overall effect of these pathways appears to be anti-inflammatory, since mice that have a targeted STAT3 deletion in macrophage and granulocytes develop
2.2 Leptin Resistance
With the discovery of leptin, many thought the cure for obesity had been found. However, the limited effect exogenous leptin had on obese humans, and the fact that they already had high circulating leptin, indicated that signaling by leptin may be diminished (71) Evidence for both central and peripheral leptin resistance is mounting. For instance,
attenuated leptin signaling with a concomitant increase in SOCS3 levels occurred in the hypothalamus during leptin administration to ob/ob mice (91). In diet-induced obese rats, chronically high leptin resulted in downregulated expression of leptin receptor in liver and kidney. In the kidney, the number of leptin binding sites was inversely correlated with the concentration of serum leptin (92). In another rat model of diet-induced obesity, a decrease in leptin receptor expression was seen under basal conditions and leptin binding to its receptor was reduced upon bolus injection of leptin. Furthermore, post receptor signaling was completely abolished in the livers of obese rats following leptin injection compared to lean controls (93). This has been more recently shown in T cells from obese mice. Diet-induced obese mice were injected with leptin and STAT3 DNA binding was examined in T cells. This study found that while there was a 5 fold increase in STAT3 binding in lean mice, there was no change from baseline in obese mice (77). In this study, it was hypothesized that an upregulation of SOCS3 led to the reduction in STAT3, because there was no difference in Ob-Rb on the cell surface.
setting of chronically high leptin, as well as a reduction in leptin binding sites (92) may be to blame. Therefore in an environment where leptin concentration is continually elevated, leptin signaling may be impaired.
2.3 Leptin and Immune Function
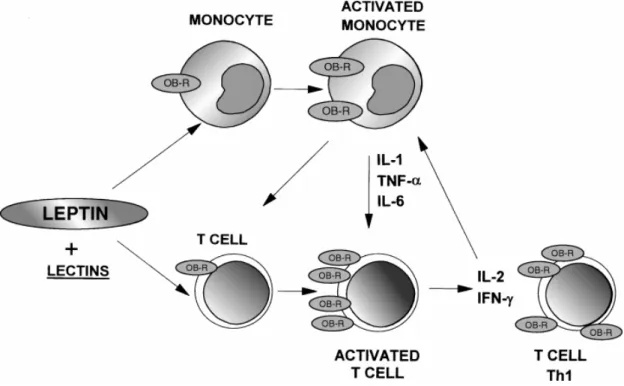
Though originally described as a satiety hormone, leptin’s ability to modulate immune function was discovered when db/db mice were found to have thymic atrophy (55). It is now clear that leptin has direct and indirect effects on both innate and cell-mediated immune response. In fact, the drop in leptin is thought to be, in part, responsible for the immunosuppression that occurs during starvation, as leptin administration abrogated the immune defects in mice following a 48h fast (6). Immunomodulatory effects of leptin include; NK cell development and cytotoxicity (95), upregulation of pro-inflammatory cytokines, and T cell proliferation and activation (6, 8, 96, 97). Leptin can induce cytokine production by dendritic cells (98) and macrophages, as well as promoting NK cell
cytotoxicity and type I helper T cell responses (8).
2.3.1 Innate Immune Responses
Leptin’s effects on innate immune responses are generally thought to increase an inflammatory response, seeing that leptin increases during an infection and augments the secretion of the pro-inflammatory cytokines IL-1β, TNFα and IL-6 (99). Leptin’s role in
inflammation, leptin also promotes the secretion of cytokines from dendritic cells. Analysis of dendritic cells stimulated with lipopolysaccharide (101) and leptin, demonstrated
synergistic effects on cytokine production than cells cultured with LPS alone (98). Similarly, leptin increases phagocytosis and cytokine secretion from monocytes and macrophage (97). Moreover, leptin promotes NK cell development and cytotoxicity as demonstrated by impaired NK cell function in db/db mice, which lack the leptin receptor (102).
2.3.2 Cell-Mediated Immune Responses
Analogous to innate responses, cell mediated immune responses are also affected by leptin. In CD4 T cells, leptin promotes IFNγ production, thus polarizing a Th1 response (103,
104). Evidence of this has been shown in children who lack leptin. These children have significantly impaired T cell proliferative responses and IFNγ production following mitogen
stimulation. This is corrected, however, once leptin supplementation is initiated (103). Leptin also induces T cell proliferation and survival, IL-2 secretion, and adhesion molecule
E. Influenza A: A Public Health Perspective
Influenza infection affects millions every year. In the United States it is responsible for over 36,000 deaths and 200,000 hospitalizations, making it the sixth leading cause of death (105). Worldwide it is estimated 5-40% of the population is infected with influenza annually (106). Individuals with chronic medical conditions such as diabetes or heart disease are at increased risk of influenza-associated morbidity and mortality (107).
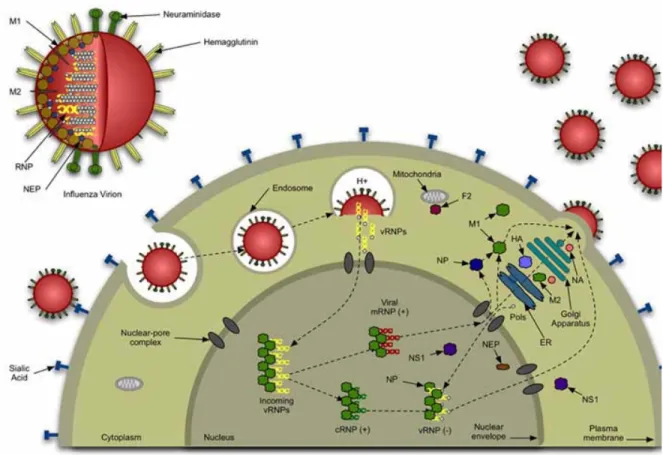
F. Influenza A: Life Cycle
Influenza virus, a member of the Orthomyxovirus family, is a single-stranded, negative sensed, segmented RNA virus that infects epithelial cells that line the respiratory tract (108). Influenza is classified by its surface hemagglutinin (HA) and neuraminidase (25) glycoproteins. Infection begins when the viral hemagglutinin (HA) molecule binds to sialic acid-containing receptors on the surface of the host cell, and the viral envelope fuses with the host cell membrane. Infectivity requires cleavage of HA into disulfide linked products, which in the case of Influenza A/PR8, is performed by a ubiquitous set of proteases (109). The virus is internalized by clathrin-coated pits and is transported by endosomes where HA-mediated fusion of the viral envelope with the endosomal membrane occurs. This fusion is succeeded by entry of viral ribonucleoproteins into the nucleus (110).
mRNA and requires the formation of viral proteins. Viral progeny are produced from complementary RNA that was generated from the parental RNA (112).
Newly generated vRNAs are exported from the nucleus. This is mediated by the interaction of viral nucleoprotein (NP) and matrix protein (M1) (113). The encapsidated vRNAs assemble at the plasma membrane where they are packaged into virions. The
interaction M1 with HA and neuraminidase (25) facilitate concentration of viral components and exclusion of host proteins. Virions egress the cell by budding through the plasma
G. Immune Response to Influenza Infection
Host response to and recovery from influenza virus infection requires an intact innate and acquired immune system. A coordinated pattern of cytokine secretion (116) is
responsible for inhibiting viral replication (117), stimulating an inflammatory response (118), and recruiting immune cells to the site of infection (119).
1. Innate Immune Response
The innate immune response is an immediate, relatively non-specific, response to pathogen. The purpose of the innate immune system during influenza is to control the spread of virus and concomitantly activate a virus specific response. This is done primarily through the actions of cytokines and chemokines secreted from virally infected cells
1.1 Respiratory Epithelial Cells
Infection of lung epithelial cells with influenza leads to the production of cytokines and chemokines that initiate immune responses. Infection of human primary lung bronchiolar and alveolar epithelial cell cultures with influenza indicate that these cells produce
interleukin (IL)-β, IL-6, and regulated on activation, normal T cell expressed and secreted
(RANTES) in responses to influenza (120). These cells are also a major source of interferon (IFN)-α/β (121). Infected epithelial cells die by necrosis which triggers cytokine production
1.2 Macrophage
Recruitment of monocytes/macrophages into the lung is a hallmark of the innate immune response. These cells are fully susceptible to infection, however they die by apoptosis before the virus completes one replicative cycle (122). Infected monocytes and macrophages contribute to the host response by the transcription and production of pro-inflammatory cytokines, such as tumor necrosis factor (TNF)-α, IL-1β, IL-6 and IFN-α/β,
and the chemokines RANTES, monocyte chemotactic protein (MCP)-1 and macrophage inflammatory protein (MIP)-1α (123, 124). The production of these cytokines induces the
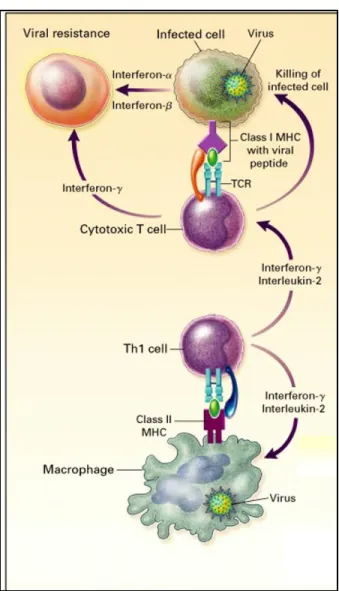
activation and migration of additional blood monocytes, as well as T and B cells to the site of infection. In the lung and LN, macrophage present antigen to T cells, this leads to the killing of virus-infected cells and initiation antigen specific T cell responses, respectively.
1.3 Dendritic Cells (DC)
Dendritic cells (DC) are principal antigen presenting cells and are the initiators and modulators of the immune response (125). Like macrophage, DCs can be directly infected with influenza, however, they are also very good at viral uptake through macropinocytosis or phagocytosis. Endocytosed virus is processed it into peptide fragments which are then
presented to T cells on the major histocompatibility complexes. Presentation of antigen by DCs is far superior than that of macrophage due to their high expression of MHC-peptide complexes and co-stimulatory molecules. Antigen presentation to T cells occurs following migration of the dendritic cell to the draining lymph node through which T cells are
influenza infection, DCs produce IL-12 which acts as a potent stimulator of Th1 responses and also functions directly on CD8+ T cells to augment cytolytic activity and IFNγ
production (125, 126). Through their production of IFNα/β and IL-12 dendritic cells also
play a critical role in NK cell expansion and activation (127).
1.4 Natural Killer (NK) Cells
Natural Killer (NK) cells are cytotoxic lymphocytes that kill virally infected cells. The ability of NK cells to recognize virally infected cells relies on a system of recognition by their killer-activating receptorsand killer-inhibitory receptors. Thekiller-activating receptors recognize molecules present on the surface of all host cells whereasthe killer-inhibitory receptors recognize MHC class I molecules. All nucleated cells have MHC Class I and thus engage the inhibitory receptor on the NK cell to prevent NK cell activation. Therefore, the down regulation of MHC Class I molecules by influenza virus, which can help it evade some immune responses, attenuates the signal from the killer-inhibitory receptor and leads to activation of NK cell killing (128).
NK cell activity is augmented by IFN α/β and IL-12, the latter also induces IFNγ
production by the NK cell, which activates antiviral gene expression and increases antigen presentation by macrophage (127).
2. Cell-Mediated Immune Responses
Due to the fact the cell-mediated immune response must be generated de novo and relies on “information” from the innate immune response, peak activation of this response occurs days after initial antigen insult. During influenza infection, the cell-mediated response is
characterized predominantly by T cells, which are recruited to the infected lung and eradicate virally infected cells.
2.1 Major Histocompatibility Complex (MHC) Molecules
For a specific immune response to be generated, antigen must first be presented to naïve T cells via major histocompatibility complex (MHC) molecules. These molecules are expressed on the surface of cells and function to display both self and non-self antigens. Two main classes of MHC exist, Class I and Class II. Class I is present on all nucleated cells and presents peptides from cytosolic antigens (128) to T cells with the CD8 receptor. Class II, however, is exclusively on antigen presenting cells. This MHC molecule presents antigenic peptides generated from lysosomal degradation to T cells with a CD4 receptor.
2.2 T cells
complex of molecules on the T cell. This leads to rapid clonal expansion to produce the large numbers of progeny that will differentiate into armed effector T cells. Activation also induces synthesis of IL-2, which is produced by the activated T cell and drives clonal expansion and differentiation. Therefore one T cell can give rise to thousands of progeny that all have the same receptor for antigen (129).
There are two classes of T cells that are distinguished by the expression of the cell-surface proteins CD4 and CD8. These two types of T cell differ in the class of MHC molecule they recognize; CD4 binds to MHC class II and CD8 binds to MHC class I.
2.2.1 CD4+ T cells
Naive CD4+ T cells can differentiate into helper T cells with either a Th1 or Th2 phenotype. To which helper subtype the CD4+ T cell differentiates depends on the pathogen and by the cytokines that are secreting during presentation on MHC Class II. During
influenza infection, IL-12 secretion by the DC will polarize the CD4+ T cell toward a Th1 phenotype. This results in IL-2 and IFNγ production by the CD4+ cells which activate CD8+
T cells. Conversely, induction of a Th2 response leads to the secretion of 4, 5, and IL-10, which downregulate Th1 responses and promotes B cell activation and antibody
2.2.2 CD8+ T cells
Unlike naïve CD4+ T cells, naive CD8+ T cells are programmed to become cytotoxic cells. Proliferating CD8+ T cells gain effector function upon MHC Class I-peptide binding in concert with co-activating molecules. During influenza infection, CD8+ T cells traffic from the lymph node into the tissue parenchyma, where effector function is critical for appropriate clearance of virus. During an active infection, CD8+ T cells compose almost 70% of the lung lavage population, of which, almost 90% are specific for four viral epitopes (131), (132).
Upon encounter with antigen, CD8+ T cells produce IFNγ which will inhibit viral
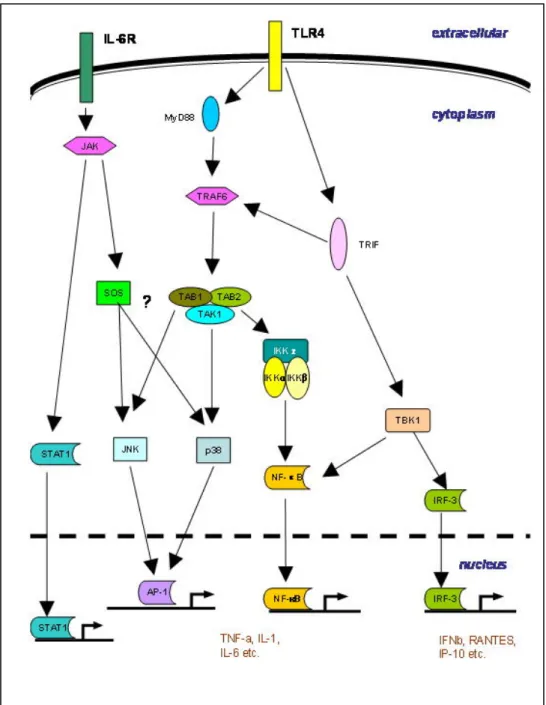
3. Virus Induced Cytokine Signaling
Infected cells limit viral replication via receptor and cytokine signaling pathways. Viral RNA is recognized through various receptors found on cell surfaces and in endosomal compartments. Binding of viral components initiates signaling cascades that result in
cytokine production by infected cells. Cytokines signal primarily through receptors that require the Janus kinase/ Signal transducer and activator of transcription (JAK/STAT) to activate components of the immune response (Figure 1.5).
3.1 Viral Recognition
Influenza viral RNA is recognized through various receptors including; Toll-like receptors (TLR 3, 7, and 9), retinoic acid inducible gene I (Rig), and Rig-like receptors (134). Binding of viral RNA to these receptors activates separate, but often overlapping, signaling pathways which result in the transcriptional activation of Type I IFNs (IFNα/β) via interferon
regulatory factor (IRF) DNA binding (135). TLR’s also activate NF-κB and MAPK signaling
pathways which promotes the transcription of cytokines and chemokines (136). Additionally, viral nucleic acids activate protein kinases and RNase L which non-specifically block
translation and degrade RNA, respectively (137, 138) and lead to apoptosis (139).
3.2 Type I Interferons
expression, increase viral recognition receptors, as well as increase their own expression (135). Their importance in immune activation is illustrated by the ability to promote
differentiation of monocytes to DCs (142), activate NK cells (127), upregulate MHC Class I and II expression (143), enhance priming of Th1 cells (144), and induce NF-kB and MAPK activation (145, 146). Their role in IFNγ production by NK cells is mediated through STAT4
activation (127). The necessity of Type I IFN during influenza infection is unclear, as some studies have reported higher viral titers and increased mortality in mice lacking the IFNβ
gene (147), while others have shown little effect on viral replication or CD8+ T cells responses in mice lack IFNAR (148). Type I IFNs are necessary for NK cell cytotoxicity, however (127) and general disruption of STAT1 results in extreme susceptibility to infection (149). (See Table 1.3 for list of cytokines/chemokine induced during influenza virus
infection).
3.3 Type II Interferon
IFNγ, Type II IFN, can also promote NF-κB and MAPK activation through synergy
with TLRs in macrophage (150). Unlike Type I IFNs, which are induced by viral nucleic acids, IFNγ is induced by T cell receptor crosslinking, as well as by APC derived cytokines
TNFα and IL-12, and by autocrine action (151, 152). It mediates numerous antiviral effects
characteristic of the Th1 response and IFNγ is critical for antigen-specific CD8 T cell
homeostasis during influenza infection (154).
3.4 IL-12
IL-12 is produced by DC, macrophage, and neutrophils (155, 156) and signals by recruiting STAT3 and 4 to phosphorylated JAK2 on the IL-12R. This mediates IL-12 effector functions which includes induction of IFNγ by NK cells (157). Importantly, IL-12 acts in a
non-redundant way to promote Th1 polarization (158) and is itself induced by IFNγ (159).
Mice that lack STAT4 have minimal IFNγ production, reduced NK cytotoxicity, and less
proliferation of activated lymphocytes (158).
3.5 IL-6
IL-6 is cytokine that is induced by TLR signaling in macrophage. It signals through a gp130 receptor and transduces its effects through JAK/STAT signaling. Macrophage
production of IL-6 induce antiviral responses through STAT1 activation of IFN-induced genes (160), but also inhibits LPS-induced TNFα production through STAT3 (161), thereby
acting to both induce and repress immune responses. A role for IL-6 in T cell homeostasis was shown in T cell specific STAT3 knock out mice. These mice had reduced T cell proliferation due to increased apoptosis which was prevented by IL-6 administration in normal cells (162).
immune function since diet-induced obese rodents do not have increased circulating cytokines therefore making it difficult to study experimentally.
3.6 IL-10
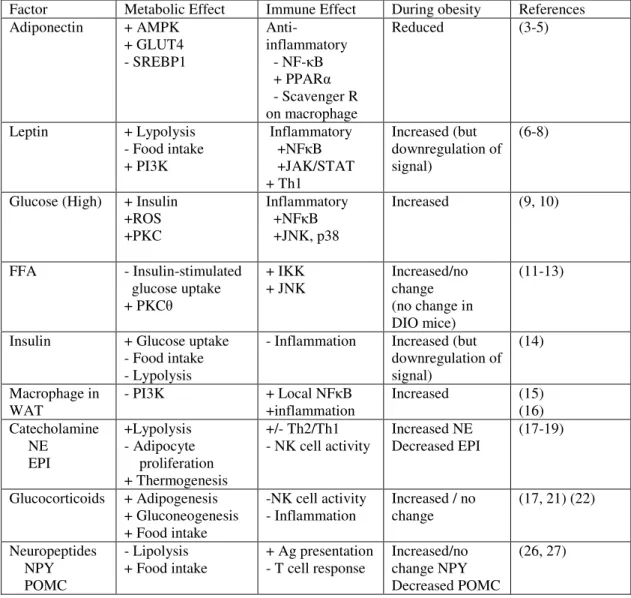
Table 1.2 Cytokines and chemokines expressed during influenza virus infection [Adapted from (133)]
Chemokine/cytokine Function Produced by
IFNα/β Inhibit viral replication
Promote NK cell proliferation and cytoxicity
Activate antigen-specific T cells
Dendritic cells
Respiratory epithelium
IFNγ Inhibits viral replication
Stimulates CTL mediated killing Increases MHC I expression
Activates macrophage and neutrophils Promotes T-cell proliferation
T cells NK cells
TNFα Direct antiviral effects Neutrophil chemoattractant
Stimulates macrophage phagocytosis and production of IL-1
Increases vascular permeability
T cells
Monocytes/macrophage Dendritic cells
Neutrophils
IL-1 Increases expression of adhesion factors on endothelium
Increases vascular permeability Stimulates IL-6 production
Monocytes/macrophage Dendritic cells
IL-6 Pro-inflammatory cytokine Activates T cells
Respiratory epithelium T cells
Monocytes/macrophage Dendritic cells
IL-12 Promotes differentiation of naïve T cells to Th1
Enhances cytotoxic activity of NK cells and T cells
Stimulates IFNγ production by dendritic cells and NK cells
Macrophage Dendritic cells
MIP-1α/β Monocytes/ T cell chemoattractant
Activates neutrophils
Monocytes/macrophage Neutrophils
T cells
Dendritic cells
RANTES Monocyte/T cell/Dendritic cell chemoattractant
Activates T cells
T cells
3.7 Signaling deactivation
Phosphatases have been shown to play a role in JAK/STAT deactivation. For
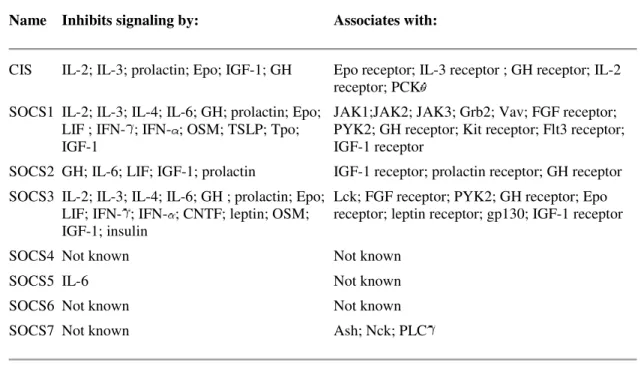
Table 1.3. SOCS proteins and their target molecules (170)
Name Inhibits signaling by: Associates with:
CIS IL-2; IL-3; prolactin; Epo; IGF-1; GH Epo receptor; IL-3 receptor ; GH receptor; IL-2
receptor; PCK SOCS1 IL-2; IL-3; IL-4; IL-6; GH; prolactin; Epo;
LIF ; IFN- ; IFN- ; OSM; TSLP; Tpo; IGF-1
JAK1;JAK2; JAK3; Grb2; Vav; FGF receptor; PYK2; GH receptor; Kit receptor; Flt3 receptor; IGF-1 receptor
SOCS2 GH; IL-6; LIF; IGF-1; prolactin IGF-1 receptor; prolactin receptor; GH receptor
SOCS3 IL-2; IL-3; IL-4; IL-6; GH ; prolactin; Epo; LIF; IFN- ; IFN- ; CNTF; leptin; OSM; IGF-1; insulin
Lck; FGF receptor; PYK2; GH receptor; Epo receptor; leptin receptor; gp130; IGF-1 receptor
SOCS4 Not known Not known
SOCS5 IL-6 Not known
SOCS6 Not known Not known
SOCS7 Not known Ash; Nck; PLC
CHAPTER II
INCREASED MORTALITY AND ALTERED IMMUNE FUNCTION IN DIET INDUCED OBESE MICE INFECTED WITH INFLUENZA VIRUS Authors: Alexia G. Smith, Patricia A. Sheridan, Joyce B. Harp, Melinda A. Beck Published in: Journal of Nutrition. 2007;137(5):1236-1243
ABSTRACT
Obesity is associated with an impaired immune response, an increased susceptibility to bacterial infection, and a chronic increase in pro-inflammatory cytokines such as IL-6 and TNFα. However, few studies have examined the effect of obesity on the immune response to viral infections. Because infection with influenza is a leading cause of morbidity and
mortality worldwide, we investigated the effect of obesity on early immune responses to influenza virus exposure. Diet-induced obese and lean control C57BL/6 mice were infected with influenza A/PR8/34 and lung pathology and immune responses were examined at d 0 (uninfected), 3, and 6 post infection. Following infection, diet induced obese mice had a significantly higher mortality rate than the lean controls and elevated lung pathology. Anti-viral and pro-inflammatory cytokine mRNA production in the lungs of the infected mice was markedly different between obese and lean mice. IFNα and β were only minimally expressed
immune system to appropriately respond to influenza infection and suggests obesity may lead to increased morbidity and mortality from viral infections.
B. INTRODUCTION
Obesity has been associated with immune dysfunction (24, 171, 172). In humans, responses of peripheral lymphocytes to mitogen stimulation are reduced (39). Some studies have reported higher T cell counts (173), whereas others report no change (174) or lower T cell counts (175), while still others demonstrate changes in the T cell population frequency (176). In addition, obese individuals have a low level of circulating TNF-α and IL-6,
suggesting a state of chronic inflammation. Studies using animal models of obesity, both genetic and diet induced, also report immune dysfunction (43, 49, 63). In vitro response to mitogens is diminished in obese animals (177) and secretion of IL-4 and IFN-γ is altered
(51). Because obesity is associated with immune dysfunction, it is plausible that obese mice infected with a viral pathogen would be unable to mount an effective immune response. To test this hypothesis, we infected lean and diet induced obese mice with influenza virus, a serious human pathogen. Studies examining the effect of obesity on infection are minimal and to our knowledge, this is the first report on the effect of obesity on an influenza virus infection.
pulmonary and/or cardiovascular conditions (178). Interestingly, obesity is also associated with chronic pulmonary and cardiovascular diseases (179, 180). Upon infection with influenza virus, dendritic cells, macrophages, and lung epithelial cells upregulate the expression of cytokines and chemokines. These molecules play essential roles in the early inhibition of viral replication (181), the stimulation of an inflammatory response (118) and recruitment of immune cells to the site of infection (119). Additionally, cytokines activate natural killer (NK) cells which are among the first cell types to become mobilized during an influenza infection. NK cells assist in eliminating infected cells and help limit viral spread until a specific cell-mediated response can be assembled (182). The expression of cytokines and chemokines during an influenza virus infection occurs in a coordinated and specific cascade. Antiviral and pro-inflammatory cytokines are induced first, followed by IL-6 expression, and finally chemokines, such as monocyte chemotactic protein (MCP)-1 and macrophage inflammatory protein (MIP)-1α are expressed (183). Changes in the expression
of any of these molecules can alter subsequent immune responses (184).
In this study, we asked whether obesity could affect the early immune response to influenza virus infection, and therefore alter viral pathogenesis. We found that diet-induced obese mice had a marked increase in mortality compared to lean mice. Furthermore,
C. MATERIALS AND METHODS Animals
Weanling C57BL/6J mice were obtained from Jackson Laboratories (Bar Harbor, MA). All mice were housed in the University of North Carolina Animal Facility, which is fully accredited by the American Association for Accreditation of Laboratory Animal Care. Animals were maintained under protocols approved by the Institutional Animal Use and Care Committee. Mice were randomized to receive either a low fat/no sucrose diet (LF) or a high fat/high sucrose (HF) diet for 22 wk. Mice were housed four per cage with free access to food and water, with the exception of an 8 h food fast prior to blood draws for glucose and insulin measurements as well as NK cell cytotoxicity.
Diets
The diets, which have been previously described (185), were obtained from Research Diets, Inc. (New Brunswick, NJ). The LF diet (D12328) consisted of 16.4% protein, 73.1% carbohydrate (83% starch, 17% maltodextrin), 10.5% fat (38% soybean, 62% coconut oil). The HF diet (D12331) consisted of 16.4% protein, 25.5% carbohydrate (51% sucrose, 49% maltodextrin), 58% fat (93% coconut oil, 7% soybean oil).
Virus and Infection
(0.6mg/kg)/xylazine (0.35mg/kg) solution and infected intranasally with 0.05 mL of 2 hemagglutinating units (HAU) of A/PR8 virus diluted in PBS. Preliminary studies from our lab determined that this dose of virus is sufficient to effectively elicit an immune response while causing little mortality in infected control mice.
Measurement of blood glucose, serum insulin and leptin
To determine if blood glucose and insulin levels were affected by infection, mice were fasted for 8 h and blood samples were collected prior to infection (after 22 wk on the diet) and at d 3 and 7 p.i. Blood glucose levels were measured with a Freestyle blood glucose monitor (Abbott Laboratories, Abbott Park, IL). Serum insulin was measured by ELISA (LINCO Research, St. Charles, MO). Serum leptin was measured by ELISA (R & D Systems, Minneapolis, MN) in unfasted mice prior to infection and at d 3 and 6 p.i.
Histopathology of lungs
Lungs were removed at d 0, 3, and 6 p.i. and perfused with 4% paraformaldehyde, paraffin embedded, cut in 6µm sections and stained with hemotoxylin and eosin (H&E).
Pathology was graded semi-quantitatively as previously described (187).
Quantitation of viral titers
Lung viral titers were determined by a modified Tissue Culture Infections Dose 50 (TCID50) using hemagglutination as an endpoint, as previously described (188). Briefly, half
containing 20ug/ml trypsin. Each diluted supernatant (100µL) was added, in duplicate, to
80% confluent MDCK cells and incubated at 37oC for 72 h. A 0.5% suspension of human O RBC (50µL) was added to each well and incubated at room temperature for 2 h. Viral titer
was expressed as the reciprocal of the highest dilution at which the RBC agglutinated. This value was then normalized to total protein in the sample. Total protein was determined by bicinchoninic acid assay, as previously described (189).
Quantitation of lung mRNA cytokine levels
Half of the right lobe of the lung was removed at d 0 (uninfected), 3, and 6 p.i. Total RNA was isolated using the TRIzol method (Invitrogen, Carlsbad, CA). Reverse
transcription was carried out using Superscript II First Strand Synthesis kit (Invitrogen) using oligo (dT) primers. Levels of mRNA levels for murine IFNα, IFNβ, IFNγ, IL-1β, 6,
IL-10, IL-12, TNFα, MCP-1, MIP-1α, regulated upon activation, normal T-cell expressed, and
Enumeration of NK cell populations in the lung and spleen
Lungs were removed at d 3 p.i. and incubated in a collagenase solution (1500 units/set of lungs) for one hour. Both spleen and lung tissue was processed into single cell suspensions by mechanical agitation of a Stomacher (Seward, UK) and strained through a 40µm nylon filter. Cells were stained with fluorescein (FITC)-labeled anti-DX5 and
Phycoerythrin (PE)-labeled anti-CD3 (BD Pharmingen, San Diego, CA) and analyzed by FACSCaliber. The lymphocyte population was gated and NK cells were identified as CD3 -DX5+ within that gate.
Determination of natural killer cell cytotoxicity
To determine if obesity had an effect on the ability of NK cells to lyse a target, isolated lung and spleen cells were analyzed in a standard NK cell cytotoxicity assay (190), using 51Cr-labeled YAC-1 tumor cells (ATCC) as targets. Briefly, serially dilutions of 0.1 mL lung or spleen effector cells, starting at 1 x 10⁷ cells/mL, were plated with 1 x 10⁴ cells
51Cr labeled YAC-1 target cells in a 96-well V-bottom microplate. The resulting effector to
target (E:T) ratios were 100:1, 50:1, and 25:1. All samples were prepared in triplicate. To determine maximum lysis, 0.1mL of 10% sodiumdodecylsulfate was added to labeled YAC-1 cells. To determine spontaneous release 0.YAC-1 mL of the culture media was added to
Statistical Analysis
Statistical analyses were performed using JMP Statistical Software (SAS Insititute, Cary, NC). Normally distributed data was analyzed by two-way ANOVA with diet and day post infection as main effects. Where appropriate, Student’s t-test was used for post hoc analysis α = 0.05. Non-parametric data was analyzed using Kruskal Wallis test, P ≤ 0.05.
D. RESULTS
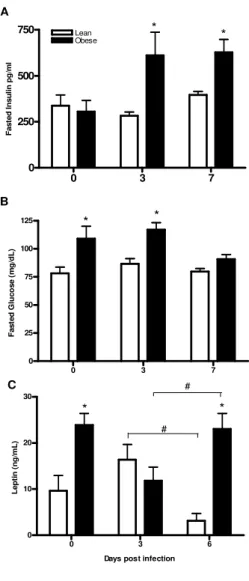
Elevated insulin levels in obese mice during influenza infection
Because diabetes is a risk factor for complications of an influenza infection (191), we wanted to determine if mice fed the HF diet had elevated glucose and insulin levels both before and during infection. As shown in Figure 2.1A insulin levels at baseline were similar between lean and obese mice, but increased during infection in the obese mice. Glucose levels were significantly elevated at baseline and at d 3 p.i. in the obese mice, but decreased by d 7 p.i to levels similar to lean mice (Figure 2.1B). Conversely, glucose levels in lean mice were unaffected by influenza infection. The fact that insulin levels are significantly elevated in obese mice during infection suggests that the obese mice developed transient insulin resistance during influenza infection.
Obesity reduces serum leptin levels during influenza infection.
during infection differed between the two groups. In lean mice, circulating leptin levels tended to increase transiently following infection, with the concentration at d 6 p.i. being similar to the uninfected levels, but significantly less than at d3 p.i. On the other hand, obese mice had a transient decrease in serum leptin during infection, with levels at d3 p.i. being significantly lower than at d 0 or 6 p.i. (Figure 2.1C).
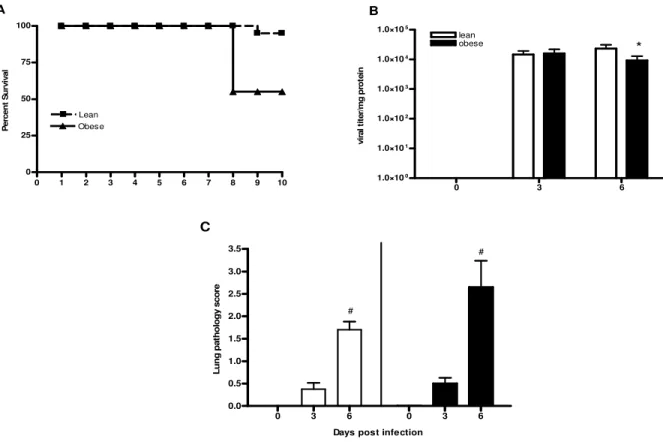
Obesity results in high mortality during influenza infection.
As shown in Figure 2.2A, obese mice had a mortality rate that was 8 fold greater than lean mice (5.5% in lean versus 42% in obese). The obese mice died at d 8 p.i.
Viral titers and lung pathology are similar between lean and obese mice.
The high mortality rate in the obese mice indicated that an influenza virus infection is significantly altered by obesity. To determine if the increased mortality was associated with an increased viral load in the obese mice, we measured lung viral titers at d 3 and 6 p.i. As shown in Figure 2.2B, viral titers were similar between lean and obese mice at d 3 p.i., although by d 6 p.i. the lung virus titer was decreased in the obese mice compare to lean. However, viral titers were still high in both groups.
Lung inflammation is a significant contributor to increased mortality in influenza-infected mice. To determine if obese mice had significantly elevated lung pathology
indicate that although an excessive amount of influenza virus in the lungs was not the cause of the high mortality in the obese mice, augmented lung pathology may have contributed to the higher mortality rate.
Obese mice have reduced expression of antiviral cytokines.
The expression of IFNα and IFNβ is induced by double stranded RNA (193) early
during infection and these cytokines function to control viral replication. Additionally, they act as potent activators of NK cell cytoxicity (127). As shown in Figure 2.3, lean mice had a robust increase in mRNA expression of IFNα and IDNβ at d 3 p.i. unlike obese mice whose
antiviral cytokine expression remained low throughout the infection. It is important to point out that lung viral titers are equivalent between lean and obese mice at d 3 p.i., suggesting that an unequal amount of virus did not cause the difference in IFNα/β expression.
Reduced NK cytotoxicity in influenza infected obese mice
Because IFNα and β were greatly reduced in obese mice, we reasoned that NK cell
of obese mice. As shown in Figure 4B, the proportion of NK cells in the lungs of obese mice was 22% whereas NK cells made up 30% of the lung lymphocyte population in lean mice. Analogous to the lungs, NK cell killing in the spleens of obese mice was also dramatically reduced (Figure 2.4C). However, unlike the lung, this was not due to a difference in NK cell frequency, because the percentage of splenic DX5+CD3- cells were equivalent between lean and obese mice (Figure 2.4D).
Since NK cell cytotoxicity can be affected by other cytokines, we also measured the mRNA expression of IL-12 and IL-18 which are known to enhance NK cell cytotoxicity (194, 195). Although IL-12 mRNA levels were not different between lean and obese mice, IL-18 mRNA levels were significantly lower in obese mice post infection (Figure 2.4E and 2.4F), suggesting a role for IL-18 in the decreased cytotoxicity of NK cells in obese mice.
Lung mRNA expression of pro-inflammatory cytokines and the anti-inflammatory cytokine IL-10.
In addition to antiviral cytokine responses and NK cells, inflammatory responses are a key part of the innate immune response to influenza infection. Paradoxically, they can also contribute to lung pathology due to increased inflammatory infiltrate. We examined gene expression of the pro-inflammatory cytokines IL-6, TNFα, and IL-1β in the lungs of obese
and lean mice. As shown in Figure 2.5, lung mRNA expression at d 3 p.i. for all three cytokines was significantly lower in obese mice. Interestingly, the expression of TNFα and
To determine if the differences in pro-inflammatory cytokine expression at d 3 p.i. could be attributed to upregulation of IL-10, a cytokine that counteracts the pro-inflammatory effect, we measured its expression in the lungs of obese and lean mice. Similar to the pro-inflammatory cytokines, IL-10 mRNA levels were significantly lower in the obese mice at d 3 p.i. compared to the lean mice (Figure 2.5). Unlike IL-6, however, there was no significant increase in the expression of IL-10 at d 6 p.i., indicating that the lungs of obese mice were in a pro-inflammatory state 6 d after the initial infection.
Decreased lung MCP-1 and RANTES mRNA expression in influenza infected obese mice.
The induction of chemokines is an important component of infection with influenza virus because they function as attractants for immune cells at the site of infection (184). As shown in Figure 2.6, lung mRNA expression of MCP-1 and RANTES was significantly decreased in obese mice 3 d post influenza infection. However, there was no difference in the expression of MIP-1α between lean and obese mice, indicating that obesity may cause
selective recruitment of immune cells to the site of infection.
D. DISCUSSION
diet induced obesity on infection with influenza virus. With over 30% of the population in the U.S. obese, and influenza virus infecting 5-20% of the entire U.S. population each year, it is important to understand how obesity may impact the host’s ability to respond to infection with influenza virus.
In our study, diet-induced obese mice had an 8-fold higher mortality rate post-infection. Along with the increase in mortality was an altered immune response, including diminished NK cell cytotoxicity and delayed pro-inflammatory cytokine expression. To our knowledge, this is the first report of obesity interfering with normal host responses to influenza infection.
It is well established that leptin levels in diet-induced obese mice are higher
infection was more detrimental to obese mice than lean, the obese group may have stopped eating. Limited food intake will result in lower serum leptin levels (6, 199). This decrease in food intake may also have occurred in the lean mice given the high levels of IL-1β and
TNFα. However, in addition to their anorectic effects, these cytokines increase leptin
production (200, 201), therefore leptin levels in the lean mice may have been appropriately balanced.
Given leptin’s influence on immune function, the reduction in leptin may have impaired the innate immune responses in the obese mice. However, it should be noted that although the obese mice had a drop in leptin at d 3 p.i., the concentration of serum leptin at this time was similar to lean mice. Therefore, if obese mice were still sensitive to leptin, this level should be sufficient to generate a response. Usually during an infection, leptin’s effects on the innate immune system are generally thought to increase an inflammatory response. Leptin acts on macrophages and DCs and augments their production of the pro-inflammatory cytokines IL-1β, TNFα and IL-6 (99). In our study, we found that obesity resulted in a
notable delay in lung pro-inflammatory cytokine expression; obese mice did not significantly upregulate these cytokines until d 6 p.i., whereas the lean mice had the expected peak
change was observed from cells taken from the obese mice (77). This study clearly shows obesity can cause T cells to become insensitive to leptin and suggests that other cells of the immune system would be similarly affected.
An alternative explanation for the reduced early cytokine expression in obese mice is a reduction in number and/or maturation of macrophages in the lungs during infection. Work by Krishnan et al. demonstrated that obese humans have similar numbers of circulating monocytes, but the number of monocytes that matured into macrophages was almost three times less in these individuals (171). Moreover, the ability of a mature macrophage to elicit an anti-microbial and cytotoxic response may be inhibited, as Cousin et al. showed an
impairment in these functions in thioglycollate elicited macrophages from ob/ob mice (202). Because macrophages are a major contributor to pro-inflammatory cytokine production, fewer macrophages in the lungs, as well as a decrease in their functional capacity, could explain the reduction in cytokine levels. It is of note, however, that infiltration of monocytes may also be reduced in the obese mice as they expressed significantly lower levels of MCP-1 at d 3 p.i.
Despite the early lack of induction of inflammatory genes in obese mice, expression of IL-6 and TNFα did increase by d6 p.i. to levels comparable to what lean mice expressed at
d 3 p.i. This late response may be due to increased numbers of infected lung cells and infiltration of cytokine producing T cells into the lung. Importantly, the late rise in
lung pathology tended to be more severe in obese mice, and it is likely that the upsurge in cellular infiltrate was due to this high level of inflammatory gene expression. Furthermore, because T cells contribute significantly to lung pathology and peak T cell responses do not occur until 8-10 d after the initial influenza infection (203), it is possible that lung pathology continued to escalate after d 6 p.i. and resulted in the death of the obese mice.
In addition to dysregulation of pro-inflammatory mediators, obesity resulted in the impairment of other important components of the early immune response. The induction of the antiviral cytokine response, induced primarily by viral factors, was severely blunted in obese mice despite equivalent lung viral titers. The lack of IFNα/β expression in obese mice
indicates that obesity interferes with induction of mRNA expression of these cytokines. This may be due to impaired janus kinases (JAK)/STAT signaling caused by an elevation in suppressor of cytokine signaling (SOCS) proteins in obese mice. SOCS proteins are activated by cytokines signaling through JAK/STAT pathways and function as negative regulators of the pathways. However in obese animals, these suppressor proteins are persistently elevated (204, 205). Specifically, SOCS1 and 3 are amplified in obese animals and these proteins inhibit signaling by type I interferons (206, 207). Since IFNα/β upregulate their own
expression (181), it is possible the lack of induction of these cytokines is due to impediment of the signal.
Because IFNα/β are required for NK cell proliferation and cytotoxicity (127), a
type I interferons (INFα/β), provide an innate defense against infection (208). In response to
intranasal infection with influenza A virus, C57BL/6 NK activity peaks within 3-4 d in the spleen, lung, and draining lymph nodes (209-211). In the current study, obese mice had over a 50% reduction in lung and splenic NK cell activity at d 3 p.i. The reduction of NK activity in the obese mice is in agreement with previous studies showing that NK cell function is decreased in rats fed a high fat diet (212, 213). This reduction in activity may be caused by a decrease in cellular arachidonic acid (AA), as splenic lymphocytes from rats fed diets high in saturated fat, show reduced levels of AA (212). AA plays an important role in the cytolytic activity of NK cells, likely through the production of leukotriene B4 (214, 215). Thus, the reduced cytotoxicity of NK cells in obese mice may be a result of a change in splenocyte fatty acid composition, leading to an impaired immune response.
Additionally, since obese mice had a lower proportion of NK cells in their lungs, the reduction in lung cytoxicity may also be the result of impaired NK cell recruitment to the site of infection. Previous studies have shown that MCP-1 and RANTES are important in NK cell recruitment (216), therefore the reduced expression of these cytokines in the lungs of obese mice may be responsible for the decreased proportion of NK cells.
Figure 2.1. Blood glucose and serum insulin and leptin levels in influenza infected obese and lean mice. Following an 8h fast (2400 to 0800), serum insulin (A) and blood glucose (B) was measured at 0 (uninfected), 3, and 7 day p.i. (C) Serum leptin was measured in fed mice at days 0 (uninfected), 3, and 6 p.i. Values are expressed as mean ± SEM (n=6-8). *, p< 0.05 vs. lean, #p< 0.05.
0 3 7
0 250 500 750 Lean Obese * * A F a s te d I n s u li n p g /m l
0 3 7
0 25 50 75 100
125 * *
B F a s te d G lu c o s e ( m g /d L )
0 3 6
0 10 20 30 C * * # #
Days post infection
Figure 2.2. Effect of influenza virus infection on mortality, viral titers, and lung pathology. (A) Percent survival was calculated based on the mice remaining in the experiment at day 8 p.i., as mice were sacrificed at day 0, 3, and 6 p.i. for the experiment. (B) To measure viral titers, lungs were removed from mice at day 0 (uninfected), 3, and 6 post-infection and homogenized. Supernatants were serially diluted and added to MDCK cells and incubated for 72 h. Human O red blood cells were added to each well and viral titer was expressed as the reciprocal of the lowest dilution at which the RBCs agglutinated. This value was then normalized to total protein in the sample and is expressed as the mean normalized titer ± SEM (n = 6-8). (C) Lung pathology was scored following blinded examination of hemotoxylin-eosin stained sections of paraffin embedded lungs at day 0, 3, and 6 p.i. Pathology was scored semi-quantitatively on a scale ranging from 0-4. Values are shown as mean ± SEM (n = 6-8). *, p<0.05 vs. lean, #, p<0.05 vs. baseline.
0 1 2 3 4 5 6 7 8 9 10
0 25 50 75 100 Lean Obese A P e rc e n t S u rv iv a l 0.5 1.0 1.5 2.0 2.5 3.0 3.5 # # C L u n g p a th o lo g y s c o re
0 3 6
Figure 2.3. Lung mRNA expression of antiviral cytokines. The mRNA expression of antiviral cytokines IFNα and IFNβ was quantified by real-time PCR using total RNA
extracted from lungs of 6-8 mice per group for days 0, 3, and 6 p.i. Values are normalized to GAPDH and are expressed as mean fold increase ± SEM over lean, uninfected controls. *, p<0.05 vs lean mice
0 3 6
0 20 40 60 80 Obese Lean * IFNα IF Nαααα f o ld i n c re a s e
0 3 6
0 500 1000 1500 2000 * IFNβ
Days post infection
![Table 1.2 Cytokines and chemokines expressed during influenza virus infection [Adapted from (133)]](https://thumb-us.123doks.com/thumbv2/123dok_us/8289864.2195235/46.918.120.851.171.1020/table-cytokines-chemokines-expressed-influenza-virus-infection-adapted.webp)