DEVELOPMENT OF AN ELECTROSTATIC AIR SAMPLER AS AN ALTERNATIVE METHOD FOR AEROSOL IN VITRO EXPOSURE STUDIES
Jose Zavala
A dissertation submitted to the faculty of the University of North Carolina at Chapel Hill in partial fulfillment of the requirements for the degree of Doctor of Philosophy in the Department of
Environmental Sciences and Engineering in the Gillings School of Global Public Health.
Chapel Hill 2014
Approved by:
J. Jason West
Kenneth G. Sexton Harvey E. Jeffries Ilona Jaspers
© 2014 Jose Zavala
ABSTRACT
Jose Zavala: Development of an Electrostatic Air Sampler as an Alternative Method for Aerosol In Vitro Exposure Studies
(Under the direction of J. Jason West)
There is growing interest in studying the toxicity and health risk of exposure to
multi-pollutant mixtures found in ambient air, and the U.S. Environmental Protection Agency (EPA) is moving towards setting standards for these types of mixtures. Additionally, the
Health Effects Institute's strategic plan aims to develop and apply next-generation multi-pollutant approaches to understanding the health effects of air multi-pollutants. There's increasing concern that conventional in vitro exposure methods are not adequate to meet EPA’s
strategic plan to demonstrate a direct link between air pollution and health effects. To meet the demand for new in vitro technology that better represents direct air-to-cell inhalation
exposures, a new system that exposes cells at the air-liquid interface was developed. This new system, named the Gillings Sampler, is a modified two-stage electrostatic precipitator that provides a viable environment for cultured cells. The performance of the sampler was
evaluated under controlled laboratory conditions. Fluorescent polystyrene latex spheres were used to determine deposition efficiencies (38-45%), while microscopy and imaging
techniques verified particle deposition. Negative control cell exposures indicated the sampler can be operated for up to 4 hours without inducing any significant toxic effects on the cells.
when exposing cultured cells with the Gillings Sampler. Further testing exposing cells to various test atmospheres included diesel exhaust, kerosene soot, secondary organic aerosols,
and ozone. Results showed various cell types (human and mouse) can be used with the
Gillings Sampler and estimated doses less than 1 g/cm2 can elicit acute biological effects on
cultured cells. These tests demonstrated the advantages of the sampler and also highlighted
limitations to be addressed in the future. The Gillings Sampler is intended to be used as an alternative research tool for aerosol in vitro exposure studies and while further testing and optimization is still required to produce a "commercially ready" system, it serves as a
To my family, for all their support, motivation, and words of encouragement that have helped me get to where I am today. ¡Si Se Pudo!
ACKNOWLEDGEMENTS
I would like to thank all of those that have helped me throughout the years, both
personally and academically during my tenure at UNC-Chapel Hill.
My research advisor - Dr. Kenneth Sexton; I am grateful that I had the opportunity to work side-by-side with you and learn from your knowledge. I have learned tremendously
from you. Thank you!
My committee – Drs. Harvey Jeffries, Jason West, Ilona Jaspers, and Johnny Carson;
Thank you for all of your guidance, contributions, and willingness to always help me in any way possible.
Funding; This work was supported in part by grants from the National Institute of Environmental Health Sciences (T32 ES007018, R01 ES15241-S1, and R01 ES013611) and the Gillings School of Global Public Health’ s Gillings Innovation Laboratory Program for
Research and Innovations Solutions.
Collaborators; I would like to thank Dr. Glenn W. Walters and D.J. Fedor from the
Environmental Sciences and Engineering (ESE) Design Center for their collaboration in the design and manufacturing of the Gillings Sampler. My research couldn't have been possible without their great work. I thank Dr. David Leith for his guidance and involvement in my
and Lung Biology (CEMALB), for all of their technical help. Lastly, I thank Dr. William
Vizuete, for all of his guidance and assistance throughout the years.
My Co-workers/Mentors; I would like to thank Drs. Kim Lichtveld and Seth
Ebersviller for all of their guidance and support over the years, even after graduating they continued to provide much help and support. Thank you for everything that you have taught
me and for setting the bar so high. I couldn't have asked for better
co-workers/mentors/friends.
My Friends; To the friendships that I have made while at UNC, thank you for your support and the great memories that I will always have. To Angel Rodriguez and Claudia Morua, thank you for your support and all the great wishes you have sent me all the way
from California.
My Family; To my parents, brothers, sisters, nieces, and nephews, I couldn't have
accomplished any of this without your love and support. It's been difficult being all the way across the country, but it has been worth it. Every visit and every phone call always renewed
my desire to continue pursuing my goal and never giving up. To my in-laws, you have been a great motivation. Thank you for believing in me.
My wife Alexandra; We have grown up together these past 9 years. It has been a great
journey thanks to you being by my side this whole time. You're the one who taught me about research when I had no clue what research was. Seeing how passionate you were about doing
TABLE OF CONTENTS
LIST OF TABLES ... x
LIST OF FIGURES ... xi
LIST OF ABBREVIATIONS ... xvii
CHAPTER 1: BACKGROUND AND SIGNIFICANCE... 1
Rationale ... 1
Cellular Response of In Vitro Models ... 2
Exposure Methods under Submerged Culture Conditions ... 3
Exposure Methods at an Air-Liquid Interface ... 4
Research Objective ... 5
Engineering Design Process ... 6
Conclusion ... 9
CHAPTER 2: THE GILLINGS SAMPLER – DESIGN AND TESTING OF A PORTABLE IN VITRO AEROSOL EXPOSURE SYSTEM ... 10
Introduction ... 10
Materials and Methods ... 12
Results ... 20
CHAPTER 3: A POSITIVE AEROSOL CONTROL METHOD FOR QUALITY
ASSURANCE TESTING OF IN VITRO EXPOSURE SYSTEMS ... 32
Introduction ... 32
Materials and Methods ... 36
Results ... 40
Discussion ... 51
CHAPTER 4: PERFORMANCE TESTING OF THE GILLINGS SAMPLER UNDER VARIOUS TEST ATMOSPHERE ... 55
Introduction ... 55
Materials and Methods ... 58
Results and Discussion ... 66
Conclusion ... 87
CHAPTER 5: OVERALL CONCLUSIONS, LIMITATIONS, AND FUTURE WORK ... 89
Summary of Research Objective ... 89
Summary of Findings ... 90
Limitations ... 95
Future Work ... 104
Overall Conclusion ... 107
LIST OF TABLES
Table 3-1: Comparison of Positive Controls used for Testing Air-Liquid
Interface (ALI) Exposure Systems ... 34
Table 4-1: Exposure times, cell types used and biological endpoints measured
for the exposures conducted... 66
Table 4-2: Exposure conditions from burning a kerosene lamp for soot
LIST OF FIGURES
Figure 1-1: The phases in the engineering design process ... 6
Figure 2-1: Side-view schematic of the Gillings Sampler. A vacuum pump on the sampler outlet pulls air through the device. Air first enters the Heated Humidification System where the air is warmed and
humidified. The air then enters the Cell Exposure System where two perforated screens disperse the air into the charging region. In the charging region, a corona wire sitting below the flow path produces positive ions to electrically charge the incoming particles. The charged particles then enter the precipitation region where they are subjected to a positive electric field that forces the particles downwards onto the deposition plate. The particles deposit inside the wells of the
deposition plate where cultured cells are exposed. The air then leaves
via the outlet. ... 13
Figure 2-2: A demonstration of how one precipitation pattern occurs with an "air parcel" containing particles is shown here. One precipitation cycle in this 2-part, pulsed-precipitation pattern consists of having the electric field turned off for 4 seconds to allow the precipitation region to be filled with particles, followed by turning on the electric field for 1.5 seconds to force down the particles onto the collection area. At 0 seconds, all the particles are in the charging section, above the corona wire. At 2 seconds into the cycle, the charged particles are flowing over the deposition plate. At 4 seconds, the charged particles have "filled up" the volume over the deposition plate. At 5.5 seconds, the end of the cycle, all particles have been deposited on the deposition plate. Most particles have deposited inside the wells where cultured
cells will sit and some particles will deposit on the masking lid. ... 15
Figure 2-3: The standard curve was generated by making serial dilution standards from the YG-PSL sphere stock solution and obtaining their fluorescent output. This cure was then used to convert the raw
fluorescence measurements obtained in the deposition efficiency tests
into mass collected. ... 21
Figure 2-4: TEM micrographs of YG-PSL spheres collected on a TEM grid using the Gillings Sampler. Micrograph A shows the size of individual YG-PSL spheres was observed to be 214 nm, while micrographs B and
C show various clusters of YG-PSL spheres. ... 21
Figure 2-5: Number size distribution of the nebulized YG-PSL spheres
Figure 2-6: Calculated deposition efficiency using YG-PSL spheres with the 6-well and 9-well deposition plates. Statistical comparison via t-test indicates no statistical significant difference between the two
deposition plates... 22
Figure 2-7: An illustration of 1000 deposition cycles to calculate the
deposition efficiency on a Millicell-CM insert. ... 24
Figure 2-8: Infrared, episcopic fluorescence, and TEM images are observed here: A) View of a new Millicell-CM membrane without
magnification. B) View of an infrared image of the IR-PSL spheres collected on a Millicell-CM membrane without magnification. The gray shades indicate fluorescence of the IR-PSL spheres. C) An episcopic fluorescence image of YG-PSL spheres collected on a Millicell-CM membrane at 20X magnification over a randomly selected area of the membrane. The top-right and top-left corners of this image lack brightness due to the microscope lighting itself, and not the lack of YG-PSL deposition in those areas. D) A TEM
micrograph of YG-PSL spheres collected on TEM grid placed on top of Millicell-CM membrane over a randomly selected area of the TEM grid. The smallest dots are the single YG-PSL spheres, while the larger dots are the multiplets. The larger the dots, the larger the number
particles present in the clusters. ... 25
Figure 2-9: Ozone measured at the outlet of the Gillings Sampler during a 4-hour clean air exposure where the charging section was powered on only. An average of 69 ppb of ozone was generated by the corona
wire. ... 26
Figure 2-10: Fold increase in cytotoxicity, as measured by LDH, from 4-hour long (2,620 cycles) exposures to clean air using the Gillings Sampler at various operational conditions. No statistical difference observed when comparing exposed cells to unexposed controls under any
conditions. ... 27
Figure 2-11: Fold increase in inflammation, as measured by IL-6, from 4-hour long (2,620 cycles) exposures to clean air using the Gillings Sampler at various operational conditions. No statistical difference observed when comparing exposed cells to unexposed controls under
any conditions. ... 27
observed when comparing exposed cells to unexposed controls under
any conditions. ... 28
Figure 3-1: A schematic of the experimental set up used for mineral oil aerosol exposures. A clean air generator serves as the source of air. The mineral oil (with and without TOLALD) is first nebulized using a Collison nebulizer. Clean air is added to dilute the aerosol output which then enters a personal cascade impactor. The mineral oil aerosol is then introduced into a 3.8-liter glass chamber. The air sampled by the Gillings Sampler, the SMPS, and the midget impinger is drawn
from the glass chamber. ... 37
Figure 3-2: Number size distribution of the mineral oil aerosol was measured with and without a personal cascade impactor as a size selective inlet
in the experimental setup. ... 41
Figure 3-3: Number size distribution of the mineral oil aerosol for all experiments was measured with an SMPS for all experiments
conducted. Repeatable size and concentrations were achieved. ... 41
Figure 3-4: GC-MS chromatograph from all three experiments containing TOLALD. The ureacted PFBHA is observed at retention time of 17 minutes. The TOLALD peak is detected at the retention time of about
30.5 minutes. ... 43
Figure 3-5: Fold increase in LDH and IL8 mRNA levels of exposures to mineral oil only and mineral oil with TOLALD compared to their respective controls. The asterisk symbol (*) indicates a statistically significant difference (t-test; p < 0.05) over unexposed controls. The pound sign (#) indicates a statistically significant difference (t-test; p < 0.05) between the mineral oil only exposure and the mineral oil with TOLALD exposure. The caret symbol (^) indicates results obtained
from the clean air exposures presented in Chapter 2. ... 45
Figure 3-6: Images captured with a 10X objective lens of cells at 9-hours post-exposure for (A) unexposed controls and (B) exposed cells to the mineral oil aerosol containing TOLALD. Changes in the cell
morphology are observed after cells have been exposed to the toxic
mineral oil aerosol... 46
Figure 3-7: Fold increase in LDH levels of exposures mineral oil with TOLALD compared to their respective controls for every ng/cm2 of TOLALD dose delivered to the cells. ANOVA analysis indicates no
Figure 3-8: Fold increase in IL8 mRNA levels of exposures mineral oil with TOLALD compared to their respective controls for every ng/cm2 of TOLALD dose delivered to the cells. ANOVA analysis indicates no
statistical difference in replicate exposures. ... 48
Figure 3-9: IL-8 protein in the supernatant was measured via ELISA in all cell exposures conducted to the mineral oil aerosol. Results show that IL-8 protein levels are suppressed after exposure, however these results show interference with the biochemistry of the assay. After conducting qRT-PCR (results shown in Figures 3-5, 3-7, and 3-8), it was observed that IL-8 mRNA levels increased. This indicates that
ELISA interference is occurring. ... 49
Figure 3-10: GC-MS chromatograph from the "cocktail" mineral oil aerosol
containing acetone, acrolein, methacrolein, and TOLALD. ... 51
Figure 4-1: Injection of diesel exhaust into the rooftop chamber and sampling
of the chamber contents in the laboratory. ... 60
Figure 4-2: Schematic of experimental setup for generating secondary
organic aerosols as a result of reacting ozone with limonene. ... 63
Figure 4-3: Number size distribution of diesel exhaust particles sampled from the UNC rooftop chamber while cell exposures were being conducted
with the Gillings Sampler. ... 67
Figure 4-4: GC/MS chromatograph of the measured carbonyls of the diesel exhaust in the morning (Fresh) and evening (Photochemically-aged) inside the UNC rooftop chamber while cell exposures were being
conducted with the Gillings Sampler. ... 68
Figure 4-5: TEM micrograph of photochemically-aged diesel exhaust
particles collected on a TEM grid placed on the deposition plate inside
the Gillings Sampler during cell exposure. ... 69
Figure 4-6: Biological analysis of cytotoxicity (LDH), inflammation (IL-6 mRNA and IL-8 mRNA), and oxidative stress (HO-1 mRNA) from A549, EpiAirway, BALB/cJ, and C57BL/6J exposed cell cultures to photochemically-aged diesel exhaust. The * denotes statistical
significance (p<0.05). ... 70
Figure 4-7: Number size distribution of kerosene soot produced from igniting a double-wick kerosene lamp measured with an SMPS for the three
Figure 4-8: GC/MS chromatograph of the measured carbonyls from the kerosene soot sampled from the indoor chamber while cell exposures
were being conducted with the Gillings Sampler. ... 73
Figure 4-9: Biological analysis of inflammation (IL-6 mRNA, IL-8 mRNA, and COX-2 mRNA) from A549 exposed cell cultures to kerosene soot. Data is presented as fold change over control. The * denotes statistical
significance (p<0.05). ... 74
Figure 4-10: Images captured with a 10X objective lens of cells at 9-hours post-exposure for (A) unexposed controls and (B) exposed cells to 0.6 mg/m3 of kerosene soot. Changes in the cell morphology are observed
after cells have been exposed to kerosene soot ... 75
Figure 4-11: Electron micrograph of an unexposed A549 cell, outlined in red, observed under SEM. The "hair-like" membranes seen on the surface of the cell is microvilli, which helps to increase the surface area of the
cell and are involved in a variety of functions. ... 76
Figure 4-12: Electron micrograph of an exposed A549 cell, outline in red, to kerosene soot observed under SEM. The morphology of the cell has
completely changed compared to the unexposed cells. ... 77
Figure 4-13: TEM micrograph of kerosene soot particles collected on a TEM grid placed on the deposition plate inside the Gillings Sampler during
cell exposure. ... 78
Figure 4-14: Number size distribution of secondary organic aerosols produced from reacting ozone with limonene during the exposures
conducted. ... 79
Figure 4-15: GC/MS chromatograph of the measured carbonyls produced from reacting ozone with limonene during the "Gases Only" exposure
(top) and "Gases + Particles" exposure (bottom). ... 80
Figure 4-16: Biological analysis of cytotoxicity (LDH) and inflammation (IL-6 mRNA and IL-8 mRNA) from A549 exposed cell cultures to
secondary organic aerosols produced from reacting ozone with limonene. The asterisk symbol (*) indicates a statistically significant difference (t-test; p < 0.05) over unexposed controls. The pound sign (#) indicates a statistically significant difference (t-test; p < 0.05) between the Gases Only exposure and the Gases + Particles exposure. The caret symbol (^) indicates results obtained from the clean air
Figure 4-17: IL-8 protein in the supernatant was measured via ELISA in both cell exposures conducted in Chapter 4 to the secondary organic
aerosols. Results show that IL-8 protein levels are suppressed after exposure, however these results show interference with the
biochemistry of the assay. After conducting qRT-PCR (results shown in Chapter 4), it was observed that IL-8 mRNA levels increased. This
indicates that ELISA interference is occurring. ... 84
Figure 4-18: Analysis of cytotoxicity (LDH) and inflammation (IL-8 protein) from A549 exposed cell cultures to ozone. The asterisk symbol (*) indicates a statistically significant difference (t-test; p < 0.05) over unexposed controls. The pound sign (#) indicates a statistically significant difference (t-test; p < 0.05) between the GIVES exposure
and the Gillings exposure. ... 85
Figure 4-19: Ozone measurements at inlet and outlet of Heated Humidification System. Measurements indicated that ozone concentrations diminish as it flows through the system due to the
humid environment present inside. ... 86
Figure 5-1: Observed YG-PSL deposition versus the expected deposition
pattern as the deposition cycle time change. ... 98
Figure 5-2: Calculated deposition efficiencies using the 6-well deposition plate as the pulse-precipitation cycle times are adjusted. HV = High
Voltage in the Cell Exposure System ... 99
Figure 5-3: Example of suggested deposition testing plan by varying each operational variable. First, testing can be conducted by varying the particle size and fixing the other parameters. In a new set of
experiments, the charging current can be varied while maintaining the other parameters fixed. In the next two sets of the experiments the
charging frequency and electric field strength can then be changed. ... 105
Figure 5-4: Recommended experimental flow chart for conducting future cell
LIST OF ABBREVIATIONS
ALI air-liquid interface
CES Cell Exposure System COX-2 cyclooxygenase-2
DE diesel exhaust
EAVES Electrostatic Aerosol in Vitro Exposure System EES Electrical Enclosure System
ELISA enzyme-linked immunosorbent assay GIVES Gas In-Vitro Exposure System
HHS Heated Humidification System HO-1 heme oxygenase-1
IL-6 interleukin-6
IL-8 interleukin-8
IR-PSL infrared polystyrene latex
LDH lactate dehydrogenase L/min liters per minute MOA mineral oil aerosol
O3 ozone
PFBHA o-(2,3,4,5,6-pentafluorobenzyl) hydroxylamine chloride
PM particulate matter ppb parts per billion PSL polystyrene latex
SMPS scanning mobility particle sizer TOLALD p-tolualdehyde
CHAPTER 1: BACKGROUND AND SIGNIFICANCE
Rationale
There is growing interest in the scientific community in studying the toxicity of multi-pollutant mixtures found in ambient air, and the U.S. Environmental Protection Agency
(EPA) is moving towards setting standards for these types of mixtures.1, 2 The EPA strategic plan calls for demonstrating a direct link between air quality and health effects.1
Additionally, the Health Effects Institute (HEI) strategic plan aims to develop and apply
next-generation multi-pollutant approaches to understanding exposure to and health effects of air pollutants.3 While epidemiological studies have shown that some measured air pollutants
in cities are highly correlated with tens of thousands of deaths a year, there are many problems in relating ambient monitoring data to health effects.4-7 Laboratory toxicological studies of the single-pollutants often show few health effects from the exposure levels seen in
ambient air.5-8 There is currently limited scientific knowledge on how exposures to multi-pollutant mixtures in real-world settings affect human health.2 For example, in the
atmosphere, it is unclear whether particulate matter (PM) toxicity is being driven by particle size, composition, the chemical transformation and interaction with gas phase molecules, or some synergistic combination of all these factors. This limited knowledge on the health
Cellular Response of In Vitro Models
Animal exposure studies have been conducted to investigate the health effects
associated with multi-pollutant exposures, however they can be costly and require extra labor to conduct these complex studies.2Alternatively, in vitro studies are relatively inexpensive
and can be used for rapid screening of pollutants or components of complex mixtures.9In vitro exposure studies can be a practical approach to identify underlying mechanisms by
which air pollutants damage cells, while in vivo studies can provide interpretation of the underlying pathophysiological mechanisms.9, 10 Molecular tools and "omics" approaches
make it possible to understand many of the underlying cellular pathways and biochemical processes which drive a cell's response to a toxicant. The respiratory tract has the potential to contain key markers that document a response to exposures of a specific chemical. There is
increasing evidence that certain cytokines play key roles in the initiation of response, cell recruitment, tissue repair, and resolution aspects of inflammation. Determining the effect of a
chemical exposure on specific gene expression levels within in vitro models should provide useful information to assess potential adverse health effects.11 Measuring inflammatory
mediators and cytotoxicity can quantitatively assess the degree of inflammation or injury.
The airway epithelial cells themselves are capable of responding to stimulation by the release of inflammatory mediators, such as, interleukin-6, Interleukin-8, cyclooxygenase-II
enzyme, and Tumor Necrosis Factor- (IL-6, IL-8, Cox-2, and TNF-), upon exposure to
particles and other forms of air pollutants.12-15 These inflammatory mediators can be
expressed and secreted during the hours after exposure. They can then be measured either in the culture medium or through mRNA analysis. Further Injury to the epithelial cells results
dehydrogenase (LDH). LDH can be considered an indicator of cell injury,16 and increased release of LDH is considered to be a sign of cellular death. As with the inflammatory
mediators, the LDH is secreted into the culture medium after injury and therefore can be quantified. While the measurement of these mediators can provide useful information to
assess potential adverse health effects of air pollutant, the challenge of in vitro toxicology, however, is that conventional in vitro exposure methods do not properly emulate human
exposures and are not adequate to meet EPA's strategic plan.
Exposure Methods under Submerged Culture Conditions
Conventional in vitro exposure methods to ambient air pollutants rely on submerged
culture conditions, whereby the pollutant of interest is added to a culture medium and
subsequently placed over the cells.9, 10, 17, 18 A common method for collecting air pollutants is
to sample the air through filters. Filters collect particulate matter efficiently. After filter collection, PM is resuspended in a liquid medium and subsequently deposited onto the cells.
In this recovery process, the particles’ physical and chemical characteristics are altered, leading to particle agglomeration and the loss of volatile organic compounds (VOCs).19, 20 Impactors can also be used collect large diameter PM on plates relatively efficiently,21 but, as
with filters, VOCs can be lost during collection and the particle's characteristics are altered when transferred to a liquid medium. In addition, impactors can only be used to sample
particles of relatively large diameter due low collection efficiency for small particles.22, 23 An alternative method to filter and impactor collection is to use impingers to collect the air mixture. Impingers pass air containing PM through a liquid medium in which portions of
chemical characteristics are altered, and particle agglomeration can take place. A major limitation to the use of exposure methods under submerged culture conditions is that the
number or mass of particles that actually interact with the cells cannot be determined.10 For these reasons, alternative in vitro methods were developed to produce more realistic aerosol
exposures.
Exposure Methods at an Air-Liquid Interface
Alternative in vitro exposure methods are needed to overcome the shortcomings of conventional methods. Exposing cells at the air-liquid interface (ALI) is the most realistic approach to emulate in vivo inhalation exposures. The apical surface of the cells is exposed to
the air while the basolateral surface of the cells is fed with a culture medium through a porous membrane.10, 28In vitro technologies currently exist, developed both in-house and
commercially, whereby cells are exposed at the ALI 19, 29-38 creating a more realistic air-to-cell inhalation exposure. These exposure systems use different mechanisms to deposit
particles onto the cells including diffusion, sedimentation, cloud settling, and electrostatic precipitation. The CULTEX and VITROCELL Systems are the only two commercially available devices which rely on diffusion and sedimentation to deposit particles onto the
cells. Studies have reported deposition efficiencies of less than 2% for particles ranging from 50 to 500 nm using the CULTEX glass modules.18, 39 Electrostatic precipitation is one of the
main mechanisms to improve the deposition efficiencies. In a study by Savi et al., the deposition efficiencies were greatly improved to 15-35% using bipolar charging of particles and an alternating electric field. To improve these results, a high efficiency electrostatic
Electrostatic precipitators (ESP) use electrostatic forces to collect charged particles for aerosol sampling and air cleaning.22 Traditionally, ESP have been used as a method for
aerosol collection in the control of airborne dust in residential and industrial settings.40 When using ESP, the particles in the air are electrically charged and then subjected to a strong
electric field that causes the particles to drift across the flow, and ultimately to deposit on a grounded collection plate.41, 42 Our research group previously developed a prototype in vitro
exposure system using electrostatic precipitation as its principle of operation named the
Electrostatic Aerosol in Vitro Exposure System (EAVES).19 A direct particle-to-cell deposition is achieved using the EAVES by exposing cells at the ALI. Particles are
electrically charged and then subjected to an electric field that causes them to repel away from a plate of similar charge and subsequently deposit in a collection plate where cultured lung cells are exposed.19 This electrical charge placed on the particles does not induce any
observed toxicological response from the cells.19 The EAVES deposition efficiency was calculated between 35-47% and was shown to be more sensitive than exposing cells under
submerged culture conditions.19, 20
While the development of the EAVES and other ALI exposure systems have contributed to advancing the knowledge of multi-pollutant exposure, these systems are
limited to a laboratory setting. Currently, there are no portable in vitro systems which can be deployed in a real-world setting.
Research Objective
The objective of this dissertation consists of the development of a portable aerosol
Engineering Design Process
To meet my research objective of developing a portable aerosol sampler, I followed a systematic engineering design process (Figure 1-1). The portable aerosol sampler will be
referred to as the Gillings Sampler.
Figure 1-1: The phases in the engineering design process
The first task was to establish a set of goals or requirements that the final product
should meet. The portable aerosol sampler should meet the following design goals:
1) Maintain the features and principle of operation of the EAVES
3) Incorporate a humidification and heating system to remove the need for a tissue
culture incubator
4) Provide the flexibility to co-expose up to 9 commercially available tissue inserts without needing to modify them
The portable aerosol sampler should also meet the following operational goals:
1) Deposit particles over the entire tissue insert cell growth area
2) Deposit particles across all tissue inserts with minimal variation from insert to insert
3) Do not induce toxicity to the cells from the use of the in vitro system
4) Allow an exposure time of up to 4 hours
Once all goals were established, the design and development phases began. With the collaboration of the Environmental Sciences and Engineering (ESE) Design Center located in the Gillings School of Global Public Health, University of North Carolina at Chapel Hill, a
prototype of the portable aerosol sampler was manufactured. Wiring of all electronic components of the sampler was conducted in the laboratory. Testing and evaluation of the
Gillings Sampler was divided into four sub-phases: electrical, particle deposition, cell viability, and performance.
Electrical Testing:
waveform, frequency, and amplitude, were monitored. All heating elements and sensors were
monitored using proportional-integral-derivative (PID) controllers.
Particle Deposition Testing:
The objective of this sub-phase was to ensure that sufficient particle deposition in the
desired tissue insert cell growth area occurred. To maximize the particle collection
efficiency, the electrical charging of the sampled particles needed to be optimized. Several design iterations of the charging mechanism were manufactured to ensure the Gillings
Sampler adequately charged the sampled particles. The collection surface consists of a deposition plate that houses the tissue inserts where cells are cultured for exposure. Several design iterations of the deposition plate were necessary until an optimal design was achieved
that yielded high particle collection efficiencies.
Cell Viability Testing:
The operational parameters (flow rate, voltages, currents, etc.) were identified for optimal particle collection efficiency. Cell viability testing was required, however, to ensure
that cell cultures could be housed inside the sampler at the operational parameters to be used without inducing adverse effects onto the cells. Possible factors that could adversely affect the cell cultures were: the material of the deposition plate, the sample flow rate, the high
electric field the cells are subjected to, and the ozone (O3) produced by the charging system.
Only the material of the deposition plate proved to be an issue. This resulted in several
Performance Testing:
The performance of the Gillings Sampler was evaluated under controlled laboratory
conditions. Five test atmospheres containing toxic air pollutants were generated to expose cultured cells using the sampler. The test atmospheres used consisted of a synthetic toxic mineral oil aerosol (MOA), diesel exhaust (DE) particulates, kerosene soot, secondary
organic aerosols (SOA), and O3. Testing of the sampler under various conditions provided
valuable insights into the qualities of the system and highlighted various limitations that
should be addressed moving forward. A detailed overview of the Gillings Sampler’s design, performance and efficacy is described in the following chapters.
Conclusion
The Gillings Sampler was developed to meet the needs to the scientific community to
better address the link between air quality and health effects. This new technology is
intended to be used as an alternative research tool for aerosol in vitro exposure studies, which
can help achieve EPA and HEI's strategic plan to towards setting standards for multi-pollutant mixtures and next-generation multi-multi-pollutant approaches.1, 3 Successful development and dissemination of this innovative technology can help bridge the gap
between toxicology and epidemiology, which in turn can affect policy decision-making by more accurately representing toxic effects and risk of exposure to air pollutants. Further
testing and optimization is still required to produce a "commercially ready" in vitro system. The Gillings Sampler, however, is a stepping-stone in the development of cost-effective in
CHAPTER 2: THE GILLINGS SAMPLER – DESIGN AND TESTING OF A PORTABLE IN VITRO AEROSOL EXPOSURE SYSTEM
Introduction
Scientific studies have shown that exposures to airborne particulate matter (PM) have a
negative impact on human health.4-6, 10 In a report from the World Health Organization, more than 2 million premature deaths each year can be attributed to air pollution43 and PM is
responsible for about 0.8 million of these premature deaths.44 Adverse health effects
observed have been associated with PM10 and PM2.5 (aerodynamic particle diameter < 10 μm
and 2.5 μm) exposures in humans.45
The smaller particles can penetrate deeper in the airway
and have been shown to increase morbidity and mortality.46 In addition, PM composition may play a role in particle-associated adverse health effects.10 In the atmosphere, it is unclear
whether toxicity is driven by particle size, composition, the chemical transformation and interaction with gas phase molecules, or some synergistic combination of all these factors.
In vitro studies use cell culture models as a surrogate for biological responses allowing
for rapid screening of pollutants. A major limitation of conventional in vitro methods is the difficulty of exposing cells to PM in a manner that better emulates direct air-to-cell inhalation
exposures. Typical toxicological in vitro exposure studies use submerged culture conditions, where PM is added to a culture medium.9, 10, 17, 18 In this process, the particles’ physical and chemical characteristics are altered, and the number or mass of particles that actually interact
can quantify the dynamic changes in the toxicity of particles while maintaining their size,
composition, and interaction with other gasses.
In vitro technologies currently exist whereby cells are exposed at an air-liquid interface (ALI),19, 29-38 creating a more realistic air-to-cell inhalation exposure. In this type of
exposure, the apical surface of the cells is exposed to air while the basolateral surface is
nutritionally supported with culture media through a porous membrane.18, 47 Cells grown on membrane inserts can be exposed to PM by depositing particles directly onto the cell
surface.19 Current commercial ALI exposure systems rely on diffusion and sedimentation to deposit particles onto cells.30, 31, 35 Studies have reported efficiencies between 0.7-2% for
these systems for particle sizes of 50 to 500 nm.18 Although current commercial ALI systems are a step forward, they lack the efficiency suitable for studying urban PM2.5. In addition,
new field-capable systems that are suited for all particle sizes are needed to study the entire
toxic potential of ambient PM.
Our research group has previously developed an in vitro system named EAVES, which uses electrostatic precipitation to expose cells at the ALI to PM.19 A TSI 3100 electrostatic
aerosol sampler was retrofitted to accommodate four co-exposed tissue inserts for up to one hour while housed in an incubator at 37°C.19 The EAVES efficiency is between 35-47% and
was shown to be more sensitive than exposing cells under submerged culture conditions.19, 20 The proof of concept and advantages of a system like the EAVES have been shown19, 20, 48, 49
and disseminating this technology to other researchers can have a positive impact in future studies. Duplicating the EAVES, however, is not ideal since this system requires retrofitting a TSI 3100 electrostatic aerosol sampler (no longer commercially available) and must be
Corporation) used with the EAVES require their height to be manually reduced from 10.5 mm to 5 mm using a micro-lathe.19 The membranes then undergo a wash process to be
sterilized before being used for culturing cells. For these reasons, it was determined that a new system needed to be developed.
The focus of this chapter is to introduce the development of an improved in vitro
system, named the Gillings Sampler. The following design goals were established prior to the design and development phase of the in vitro system: 1) maintain the features and principle
of operation of the EAVES, 2) use commercially available components for ease of
manufacturing and assembly, 3) incorporate a humidification and heating system to remove
the need for a tissue culture incubator, 4) provide the flexibility to co-expose up to 9 tissue inserts without needing to modify them. Operational goals were also established and consist of the following: 1) deposit particles over the entire tissue insert cell growth area, 2) deposit
particles across all tissue inserts with minimal variation from insert to insert, 3) do not induce toxicity to the cells from the use of the in vitro system, and 4) allow an exposure time of up
to 4 hours. These design and operational goals are what our research group believe are essential components and characteristics of an ideal in vitro system. The Gillings Sampler was evaluated under controlled laboratory conditions to determine if all established design goals were accomplished. A detailed overview of the Gillings Sampler’s operating
performance and efficacy is described in the following sections.
Materials and Methods
Air Sampler Components and Operating Conditions
The Gillings Sampler is comprised of three sub-systems: Electrical Enclosure System
principle mechanism to deposit particles directly onto cells using a two-stage electrostatic
precipitator is described in Figure 2-1.
Figure 2-1: Side-view schematic of the Gillings Sampler. A vacuum pump on the sampler outlet pulls air through the device. Air first enters the Heated Humidification System where the air is warmed and humidified. The air then enters the Cell Exposure System where two perforated screens disperse the air into the charging region. In the charging region, a corona wire sitting below the flow path produces positive ions to electrically charge the incoming particles. The charged particles then enter the precipitation region where they are subjected to a positive electric field that forces the particles downwards onto the deposition plate. The particles deposit inside the wells of the deposition plate where cultured cells are exposed. The air then leaves via the outlet.
The EES is the source of power to both the CES and the HHS. All of the low and high voltage power supplies, as well as the temperature and humidity controllers, are safely
housed in this compartment. The HHS was manufactured using commercially available components in the ESE Design Center located in the Gillings School of Global Public
Health. This removable system is used to pre-heat and moisten the incoming airflow before it reaches the cells, as required by the sampling conditions. If one were conducting a field study
entry to 31°C in the pharynx and 35°C in the trachea.50 This system is, therefore, a critical
component as it represents the pre-heating and humidification of inhaled air.
The CES was manufactured using commercially available components in the ESE Design Center. It is a modified, temperature-regulated (37°C), two-stage electrostatic
precipitator. An electrical current is applied to the corona wire to produce a corona discharge
that produces high concentrations of unipolar ions used to charge the incoming particles in the sampled flow.22, 51 A high voltage is applied to the precipitation plate in a
pulsed-precipitation pattern to generate an electric field, similar to that described by Liu and colleagues.51 One precipitation cycle in this 2-part, pulsed-precipitation pattern consists of
having the electric field turned off for 4 seconds to allow the precipitation region to be filled with particles, followed by turning on the electric field for 1.5 seconds to force down the particles onto the collection area. The specified times in this cycle depend on the sample flow
rate, electric field strength, and volume inside the CES. To help explain how this pulse-precipitation method to deposit particles works, a demonstration is shown in Figure 2-2. In
the precipitation region, a 6-well or 9-well deposition plate allows 30 mm Millicell-CM membranes to be co-exposed. The multi-well deposition plates are composed of two parts; the compartmentalized well plate and a masking lid. The masking lid fits over the well plate
Particle Deposition Efficiency and Imaging Analysis
Particle deposition efficiency was calculated using fluorescent 200 nm standard
microspheres. The size of the microspheres was selected since it falls in the 50 - 500 nm size range of interest. Polystyrene latex (PSL) spheres were selected as test particles since they
have been used as calibration standards in other applications. The PSL spheres, referred to as
YG-PSL spheres, (0.20 m, Yellow-Green Fluoresbrite Microspheres, Polysciences, Inc.)
were nebulized using a glass micro spray nebulizer to a concentration of ~1 mg/m3. Prior to
nebulization, 0.5 mL of the YG-PSL stock solution was diluted in 8 mL of HPLC-grade water. The nebulized aerosol flow passed through a charge neutralizer (model 3012, Kr-85, 2
mCi, 74 MBq, TSI, Inc.), then into a 20 L glass jar before sampling through the sampler, as previously described by de Bruijne.19 A 25 mm diameter foil substrate was placed over each Millicell-CM membrane to collect the YG-PSL spheres. The YG-PSL spheres were sampled
and collected for 1,000 precipitation cycles (91.7 minutes). After collection, the foil
substrates were placed inside glass tubes filled with 5 mL of ethyl acetate to dissolve the
YG-PSL spheres and release the fluorescent dye. Variations of this method have been used previously by others to test the efficiency of their systems.19, 52, 53 Each sample was analyzed using a spectrofluorometer (FluoroLog, Horiba Scientific) at the peak excitation (440 nm)
and emission (486 nm) wavelengths.
A scanning mobility particle sizer (SMPS) (model 3936L25, TSI, Inc.) with a sheath
flow rate of 2.0 liters per minute (L/minin) and an aerosol sample flow rate of to 0.3 L/minin was used to measure the size distribution of the particles ranging from 19 to 882 nm in aerodynamic diameter. A Teflon membrane filter (47 mm diameter; Pall Corporation) was
determine the mass concentration in the air. The filter was weighed before and after to
determine the total mass collected.
Three different imaging techniques were used to qualitatively assess the distribution of the deposited PSL spheres. These techniques also serve to demonstrate, as proof of principle, that the PSL spheres are in fact being collected on the membrane surface, ensuring that
particles will be directly deposited on the cells during future exposures to PM. Each
technique allows us to observe the deposition at different magnification levels.
An infrared imaging system (Odyssey Imaging System; LI-COR Biosciences) was used to observe the PSL sphere deposition over the entire membrane area. To conduct this technique, a different set of 200 nm PSL spheres, referred to as IR-PSL, (200 nm, Red
Fluorophorex Fluorescent Microspheres, Phosphorex, Inc.) was used. These IR-PSL spheres were nebulized as described above and collected directly onto the membrane. Prior to
nebulization, 0.75 mL of the IR-PSL stock solution was diluted in 7 mL of HPLC-grade water.
Episcopic fluorescence microscopy and transmission electron microscopy were used to observe the YG-PSL sphere deposition at greater magnifications. The YG-PSL spheres were collected directly on the membrane. Using an inverted light microscope configured for
epifluorescence, the membrane was observed using an FITC filter block to reveal fluorescence of the YG-PSL spheres. On a separate membrane, a transmission electron
microscope (TEM) grid was used to collect the YG-PSL spheres. The impacted particles were viewed directly on the grid in a Zeiss EM900 TEM at an accelerating voltage of 50
Cell Culture Conditions and Biological Analysis
The cell line A549 is a human pulmonary type II epithelial-like cell line derived from human alveolar cell carcinoma of the lung.54 A549 cells were grown on collagen-coated Millicell-CM membranes in F12-K media with 10% fetal bovine serum (FBS) plus 0.01%
penicillin/streptomycin. Cells were plated at a density of 7.5 x 10⁵ cells per insert 28 hours prior to exposure and placed in commercial 6-well plates inside an incubator at 5% carbon
dioxide (CO2). The basolateral side received 1.2 mL of media, while 0.8 mL of media was
added to the apical side. When the cells reached ~80% confluency, 4 hours prior to exposure, the FBS-containing media was replaced with serum-free media containing F12-K media and
1.5 micrograms (g) per mL bovine serum albumin, plus 0.01% penicillin/streptomycin.
Immediately before exposures, the membranes were transferred to the 9-well deposition plate and 2.8 mL of fresh serum-free media was added to the basolateral side only. After each
exposure, the membranes were transferred to new commercially available 6-well tissue culture plates, along with 1.2 mL of serum-free media from the well that contained the
membrane during exposure. Membranes were then placed into an incubator for an additional 9 hours to allow for the cells to produce and release biological markers of toxicity. A set of unexposed cells housed in an incubator were used as controls for each test presented in this
study.
It is understood that an immortalized cell line may not accurately represent the
biological response of primary passage, differentiated human airway epithelial cells. The goal of this work was to test the development of new technology. The A549 cells are
signal in response to pollutant exposures. These cells were, therefore, ideally suited for this
work as it allows for reliable replication of experiments.
For each cell exposure conducted, the basolateral supernatants for each membrane sample (n=6) were collected for toxicological analysis 9 hours post-exposure. Interleukin-8 (IL-8) and IL-6 protein, both markers of inflammation in the supernatant, were measured via
enzyme-linked immunosorbent assay (ELISA; BD Biosciences) for the clean air exposures conducted. IL-8, among other cytokines, has been observed in humans when stressed by
exposure to ozone and other air pollution mixtures in human clinical trials and measured in asthmatic and chronic obstructive pulmonary disease (COPD) patients,55-58 therefore it was
selected as an appropriate endpoint for our study. Cytotoxicity was measured via levels of lactate dehydrogenase (LDH) in the collected basolateral supernatant using a coupled enzymatic assay (Takara Bio Inc.). These endpoints serve to demonstrate the efficacy of the
Gillings Sampler; different endpoints for any in vitro model can be selected for any other research needs.
Data for LDH, IL-6 and IL-8 are presented as the mean ± standard error from the mean and expressed as fold increase over control. Data were analyzed using an unpaired Student’s
t-test and differences were considered significant if p ≤ 0.05.
A549 Cell Exposure Testing
To effectively evaluate the Gillings Sampler, a series of clean air cell exposures were conducted at various operating configurations. The laboratory is equipped with a clean air generator, which was the source of air for all negative control tests. No toxicity should be
2,620 precipitation cycles (4 hours) at constant temperature (37°C), flow rate (2.2 L/minin),
and relative humidity (RH) above 75%, and at 5% CO2 levels.
Results
Particle Deposition Efficiency
The YG-PSL sphere mass collected was quantified using a spectrofluorometer. The
raw fluorescent readings obtained were converted into mass collected using standard curves generated by using the manufacturer's specified particle concentration in the YG-PSL stock solution (Figure 2-3). Using TEM, a diameter of 214 nm for the YG-PSL spheres was
measured (Figure 2-4) and it was observed that multiplets (clusters of 2 or more spheres) were present. The SMPS was able to measure these multiplets (Figure 2-5). Formation of
multiplets is a common problem that arises from atomizing these types of monodisperse aerosols.22 While the initial intent was to test the efficiency of 200 nm size particles, the resulting aerodynamic particle sizes ranged from 209 nm at the lower end to greater than
1000 nm at the higher end due to the multiplets formed. This wide range in particle sizes allowed us to demonstrate the ability of the sampler to collect both small and larger sized
Figure 2-3: The standard curve was generated by making serial dilution standards from the YG-PSL sphere stock solution and obtaining their fluorescent output. This cure was then used to convert the raw fluorescence measurements obtained in the deposition efficiency tests into mass collected.
Figure 2-5: Number size distribution of the nebulized YG-PSL spheres obtained with the SMPS
Particle deposition efficiency () was calculated to be 45% for the 6-well deposition
plate (coefficient of variability [CV] = 24.5%), and 38% (CV = 28.7%) for the 9-well deposition plate (Figure 2-6) using the equation below.
Figure 2-6: Calculated deposition efficiency using YG-PSL spheres with the 6-well and 9-well deposition plates. Statistical comparison via t-test indicates no statistical significant difference between the two deposition plates.
0.0E+00 2.0E+04 4.0E+04 6.0E+04 8.0E+04 1.0E+05 1.2E+05 1.4E+05
10 100 1000
dN /d lo gDp (# /c m
3 )
Particle Diameter (nm)
209 nm 279 nm 334 nm 372 nm 552 nm 638 nm 461 nm 763 nm 850 nm 710 nm
6-Well Plate 9-Well Plate
Here, efficiency is defined as the average mass collected (Mc) on a specified collection area
over the total mass (Mt) in the volume sampled above that collection area. The collection
area of interest is the Millicell-CM membrane growth area. I am only interested in how much PM is delivered to the membrane growth area. I assume the sampled air is uniformly
distributed over the entire CES. To calculate the total particle mass in the volume sampled, the particle concentration (Cp) and total volume (Vt) must be known. The particle
concentration (Cp) was determined by quantifying the mass collected with a Teflon filter over
a specified period of time. Since the Gillings Sampler was operated with a pulsed deposition voltage, the volume of aerosol sampled is independent of the aerosol flow rate and depends
only on the collection area (A) of the collecting surface, the distance (H) from the collection surface to the precipitation plate, and the number of precipitation cycles (n).51, 59
An example of the efficiency calculation is provided next and an illustration can be
seen in Figure 2-7. Various assumptions were made for the purpose of demonstrating how the efficiency equation is used for a particular collection area. We made the following
assumptions: 1) the particle concentration (Cp) remains constant at 1 mg/m3 and is uniformly
distributed over the entire volume above the cell inserts, 2) the sampler has been operated for 1,000 cycles, and 3) the height (H) is 2 cm. The collection area (A) is 4.2 cm2, given by the
cell growth area of the Millicell-CM insert.
For the sake of this example, I assume that we are collecting the YG-PSL spheres, as
described in the methods section of Chapter 2. I also assume that our measured mass
(quantified using a spectrofluorometer) is 3.78 g. Now we have all the information needed
Figure 2-7: An illustration of 1000 deposition cycles to calculate the deposition efficiency on a Millicell-CM insert.
Qualitative Analysis of Particle Deposition
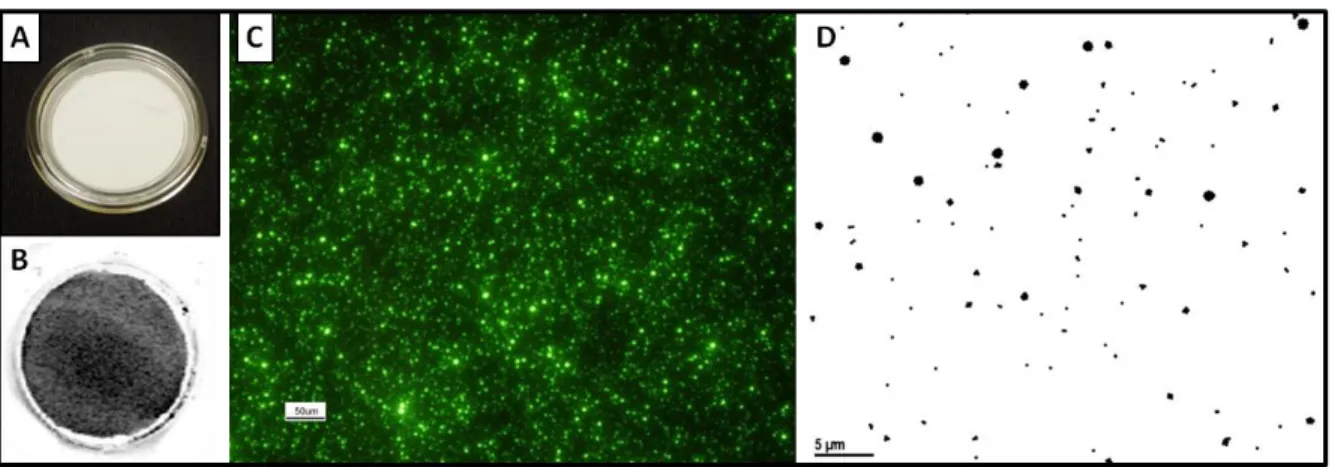
Three techniques were used to visually confirm the collection of the PSL spheres on the membranes at different magnification levels. First, IR-PSL spheres were collected directly onto the membranes and were observed using an infrared imaging system (Figure
2-8A & 2-8B). This technique allowed the entire 4.2 cm2 surface area of the membrane to be visualized at once, and it can be seen that the IR-PSL spheres deposit over the entire surface.
Episcopic fluorescence microscopy was then used to observe YG-PSL sphere deposition at 20 times magnification. Figure 2-8C shows the episcopic fluorescent image, and
demonstrates randomly distributed deposition of the YG-PSL spheres. The YG-PSL spheres were also collected on a TEM grid that was placed on top of a membrane. An electron
This image shows the variation in size of the singlets versus the multiplets. After observing the images in Figure 2-8, it is clear that particle deposition does take place and is randomly
distributed over the surface area of each Millicell-CM membrane.
Figure 2-8: Infrared, episcopic fluorescence, and TEM images are observed here: A) View of a new Millicell-CM membrane without magnification. B) View of an infrared image of the IR-PSL spheres collected on a Millicell-CM membrane without magnification. The gray shades indicate fluorescence of the IR-PSL spheres. C) An episcopic fluorescence image of YG-PSL spheres collected on a Millicell-CM membrane at 20X magnification over a randomly selected area of the membrane. The top-right and top-left corners of this image lack brightness due to the microscope lighting itself, and not the lack of YG-PSL deposition in those areas. D) A TEM micrograph of YG-PSL spheres
collected on TEM grid placed on top of Millicell-CM membrane over a randomly selected area of the TEM grid. The smallest dots are the single YG-PSL spheres, while the larger dots are the multiplets. The larger the dots, the larger the number particles present in the clusters.
Negative Control Exposures to Clean Air
Cells were first exposed to clean air while all high voltages remained turned off. This allowed us to investigate any potential problems with cell culture media evaporation that
could lead to cell desiccation. No statistical difference in LDH, IL-6 and IL-8 levels between controls and exposures were observed. The exposure was repeated with the high voltages
applied to the charging section of the CES only to investigate any potential toxicity from the O3 produced during corona discharge. An average O3 concentration of 69 parts per billion
(ppb) was measured at the outlet of the sampler during the 4 hours the charging section was
Figure 2-9: Ozone measured at the outlet of the Gillings Sampler during a 4-hour clean air exposure where the charging section was powered on only. An average of 69 ppb of ozone was generated by the corona wire.
The exposure was repeated, but this time only a high voltage was applied to the precipitation plate to address potential toxicity interference from the electric field. No difference in LDH, IL-6 and IL-8 levels was observed. From these data, it was determined
that the individual components and parameters of the Gillings Sampler do not induce any elevated levels of cytotoxicity and inflammation, as measured by LDH, IL-6 and IL-8. The exposure was repeated a final time with all high voltages turned on to verify that, when all
components are working together, there are no potential LDH, IL-6 and IL-8 responses resulting from the Gillings Sampler itself. These results validate that the Gillings Sampler
Figure 2-10: Fold increase in cytotoxicity, as measured by LDH, from 4-hour long (2,620 cycles) exposures to clean air using the Gillings Sampler at various operational conditions. No statistical difference observed when comparing exposed cells to unexposed controls under any conditions.
Figure 2-11: Fold increase in inflammation, as measured by IL-6, from 4-hour long (2,620 cycles) exposures to clean air using the Gillings Sampler at various operational conditions. No statistical difference observed when comparing exposed cells to unexposed controls under any conditions.
0.0 0.5 1.0 1.5 2.0 All Voltages Turned OFF Charging Section VoltagesTurned ON Only Precipitation Section VoltagesTurned ON Only All Voltages Turned ON Exposure Unexposed Controls L DH (F o ld i n c re a s e o v e r c o n tr o l) 0.0 0.5 1.0 1.5 2.0 All Voltages Turned OFF Charging Section VoltagesTurned ON Only Precipitation Section VoltagesTurned ON Only All Voltages Turned ON
Unexposed Controls Exposure
Figure 2-12: Fold increase in inflammation, as measured by IL-8, from 4-hour long (2,620 cycles) exposures to clean air using the Gillings Sampler at various operational conditions. No statistical difference observed when comparing exposed cells to unexposed controls under any conditions.
Discussion
Exposing cells to PM at ALI conditions better emulates exposure in humans compared
to cell exposures under submerged conditions and has been shown to be more sensitive.19, 20 Exposing cells in submerged conditions, however, is still widely accepted due to the ease of
PM collection and resuspension procedures. Understanding the advantages of exposing cells at ALI has encouraged our research group to develop an instrument that is easy to
manufacture and can be shared with other researchers. A list of design and operational goals believed to be essential components and characteristics of an ideal in vitro system were outlined prior to the design and development phase of the Gillings Sampler. This new system
was then evaluated under controlled laboratory conditions to determine if the established goals were met.
The Gillings Sampler maintained the features and principle of operation of the EAVES,
and was manufactured and assembled using commercially available components, such as 0.0 0.5 1.0 1.5 2.0 All Voltages Turned OFF Charging Section VoltagesTurned ON Only Precipitation Section VoltagesTurned ON Only All Voltages Turned ON
Unexposed Controls Exposure
power supplies, heaters, and controllers. The use of heaters and temperature controllers allows the temperature throughout the entire system to be maintained at 37°C, while the use
of the HHS allows the sampler to be operated at optimal RH conditions. The temperature and humidity regulation system implemented in the Gillings Sampler introduces a portability
feature that allows for potential usage in a wide range of settings. In an effort to provide the flexibility to co-expose multiple commercially available tissue inserts, interchangeable deposition plates were developed. These deposition plates can be customized to fit multiple
configurations without needing to manually modify each insert. These unique deposition plates provide researchers the flexibility to conduct time-series studies, co-expose multiple
cell types, or simply increase their statistical power with a higher number of samples. Here, 6-well and 9-well deposition plates were manufactured to accommodate the 30 mm
Millicell-CM membranes, which are already 5 mm in height, and do not need to be modified.
One of the biggest concerns in these types of exposure systems is the distribution of particle deposition within each membrane insert. A difficult task is to ensure that cells within
each membrane are uniformly exposed to the particles. It is not ideal, for example, if particle deposition is localized, for example, in the center or at the edges of the membrane. The infrared image obtained using the IR-PSL was crucial to this work as it provided
visualization of the particle deposition distribution over the entire area. From this
observation, it was determined that the Gillings Sampler adequately deposits particles across
the entire 4.2 cm2 membrane area.
Another concern when using these types of exposure systems is ensuring minimal variation in particle deposition from insert to insert so the dose of PM delivered to each tissue
there exists some variation in mass deposition from insert to insert as observed by the coefficient of variability between 24-29% calculated. This suggests that the exposure dose,
when conducting future experiments, will not be identical in each cell culture insert. With the current data available, it cannot be determined to what extent the variation in dose from insert
to insert will affect the toxicological results of the co-exposed samples. The resulting biological response can vary depending on cell type and type of PM sampled. One outcome could be that the variation in dose across all co-exposed samples is insignificant when
analyzing the toxicological results or, on the other extreme, the variation in dose can significantly affect the overall toxicological results. This will be further investigated in the
next chapters where the sampler will be evaluated under various test atmospheres.
Testing individual components of the Gillings Sampler demonstrated that the
instrument itself does not induce toxicity, based on the three biological endpoints measured.
Additionally, the Gillings Sampler was operated successfully for up to 4 hours. The two main concerns that could have limited the maximum exposure time were media evaporation and
the O3 generated by the corona wire. The plate design has a masking lid fitted over the cell
culture media surrounding the inserts. This design significantly decreases evaporation, thereby allowing for longer exposure times. The 69 ppb of ozone produced by the corona
wire proved to be insignificant as it did not increase the cytotoxicity and inflammation expression levels measured.
The Gillings Sampler was successful in meeting all established design and operational goals. It is acknowledged that several improvements can still be made in two major areas, deposition efficiency and variability of deposition from insert to insert. Increasing the
particles. Currently, two diffuser screens are placed in the flow path to disperse the incoming aerosol over the entire volume inside the CES. Visual inspection of the deposition inside the
entire CES indicates that the diffuser screens are not dispersing the flow as uniformly as expected. Redesigning the inlet head of the sampler can help with better flow dispersion
resulting in less insert to insert variation.
The Gillings Sampler has the potential to be a very useful device for future in vitro
exposure studies. The next steps are to further evaluate this new system under controlled
laboratory exposures to determine the reproducibility and sensitivity of the sampler. The Gillings Sampler also needs further evaluation under various testing conditions to determine
its feasibility for conducting future exposure studies. Testing with both immortalized cell lines and primary cell cultures would be ideal to better understand the limitations of this
CHAPTER 3: A POSITIVE AEROSOL CONTROL METHOD FOR QUALITY ASSURANCE TESTING OF IN VITRO EXPOSURE SYSTEMS
Introduction
Human exposure to airborne PM has been associated with increased morbidity and
mortality.43-46 Inhalation exposure to airborne PM can take place indoors (e.g. residential and occupation settings) and outdoors (e.g. stationary and mobile sources). Animal inhalation
exposure studies have been conducted in an effort to assess the toxic effects of inhaled aerosols and have been considered the “gold standard.”10, 18
The use of animal research in the field of inhalation toxicology can be ideal to observe changes in the living model organism,
but due to animal testing protocols and guidelines imposed by the Institutional Animal Care and Use Committee (IACUC) studies are limited to controlled laboratory conditions. In
addition to these logistical issues, ethical reasons have caused the European Guideline Registration, Evaluation and Authorization of Chemicals (REACH) to demand the reduction and replacement of animal testing with alternate methods.18, 60 Additionally, the Health
Effects Institute (HEI) strategic plan aims to develop and apply next-generation multi-pollutant approaches to understanding exposure to and health effects of air multi-pollutants.3 For
these reasons there is a need to develop alternative in vitro methods and exposure systems. The development of new in vitro exposure systems could permit future cell exposure studies outside of the laboratory and in specific micro-environments (e.g. downwind from a power
provide new insights into the pollutant-cell interactions that lead to the observed adverse
health effects in humans,9 but they must first be validated and standardized.
The standardized method for traditional in vitro exposures studies relies on submerged culture conditions where the airborne pollutant is added to a culture medium and then directly added to cells.9, 10, 17, 18 In this exposure method a particle dose is delivered to the
cells in a liquid suspension altering the particles’ physical and chemical characteristics.19, 20 This method also assumes that all particles deposit over the cells’ surface, but the number or
mass of particles that actually interact with the cells cannot be determined.10 The major challenge in developing an alternative to this method is achieving a direct air-to-cell
inhalation exposure. In the last 15 years alternative exposure systems through the use of new
in vitro technology have been developed where cells are exposed at an ALI. These exposure systems allow the apical surface of the cells to be exposed to the air while the basolateral
surface is nutritionally supported with culture media through a porous membrane.18, 47
Various ALI exposure systems have been developed both in-house and commercially (Table 1).19, 32, 36, 37, 60-64 Each of the exposure systems shown in Table 1 uses different
mechanisms to deposit particles, which include diffusion, sedimentation, cloud settling, and electrostatic precipitation. When developing this new technology, researchers ensured that
basic conditions such as direct pollutant-cell interaction, tissue culture environments, and uniform exposures to pollutants were met.35, 60 Using various test atmospheres, the ALI
exposure systems were shown to be more sensitive than the traditional submerged culture conditions.20, 37, 65 These test atmospheres varied and included photochemically-aged diesel exhaust, concentrated ambient coarse PM, and cookstove emissions. While all exposure