1
INFLUENZA-SPECIFIC T CELL MEMORY: INFLUENCE OF OBESITY, WEIGHT LOSS, WEIGHT GAIN
Jennifer Rebeles
A dissertation submitted to the faculty at the University of North Carolina at Chapel Hill in partial fulfillment of the requirements for the degree of Doctor of Philosophy in the Department of
Nutrition (Nutritional Biochemistry) in the Gillings School of Global Public Health.
Chapel Hill 2017
iii
ABSTRACTJennifer Rebeles: Influenza-Specific T Cell Memory: Influenza of Obesity, Weight Loss, Weight Gain
(Under the direction of Melinda A. Beck)
Obesity is a global epidemic, with 10% of men and 14% of women obese worldwide. Obesity is a known risk factor for increased complications and death from infection with influenza virus, and impairs the T cell response to both influenza infection and vaccination. As obesity is primarily a metabolic disorder, and immune cell function is dictated by metabolism of the immune cell, the effect of obesity on memory T cell metabolism following a secondary influenza infection was investigated. This dissertation addressed whether the metabolic environment at the time of memory T cell generation or at the time of re-challenge would influence T cell metabolism and function.
C57BL/6J high fat diet-induced obese mice were infected with X-31 influenza virus to generate memory T cells, then switched to a low-fat diet to induce weight loss. Following weight loss and normalized fasting glucose levels, mice were re-infected with influenza Puerto Rico/8/34 (PR8) to activate the memory T cells in a newly generated lean state. Conversely, lean mice were infected with X-31 to generate memory T cells followed by a diet switch to a high fat diet to induce obesity. Following weight gain and elevated fasting glucose levels, mice were re-exposed to PR8. Compared with mice that were always lean, mice that were obese for both primary and secondary influenza infections had impaired T cell metabolism and function. Mice that lost weight
iv
had gained weight, and were previously lean, maintained a metabolic profile similar to the mice that were always lean, although also had T cell subset alterations and diminished function.
Altogether, this data demonstrates that metabolic environment present at the time of memory T cell generation and at time of secondary immune challenge both impact T cell function. For the first time, obesity has been shown to alter T cell metabolism, and we demonstrate that weight loss will not restore T cell metabolism or function.
v
To my mother Rose, my father David, and my brother Sam, thank you for the unwavering support, love, and encouragement all these years in achieving my biggest dream. I dedicate this
vi
ACKNOWLEDGEMENTS
I would like to thank my advisor, Melinda A. Beck, for the support, faith, and
vii
TABLE OF CONTENTS
LIST OF TABLES ... x
LIST OF FIGURES ... xi
LIST OF ABBREVIATIONS AND SYMBOLS ... xiii
CHAPTER I – OVERVIEW AND SPECIFIC AIMS ... 1
Overview ... 1
Specific AIMS……….. ... 3
CHAPTER II – BACKGROUND AND SIGNIFICANCE ... 4
Obesity Introduction ... 4
Metabolic syndrome ... 5
Obesity and Inflammation ... 6
Obesity and vaccination ... 9
Animal models of obesity ... 11
Influenza virus epidemiology ... 13
Influenza virus structure ... 15
Innate immune response to influenza ... 15
Adaptive immune response to influenza ... 17
viii
Memory cell metabolism ... 21
Obesity effects on the immune response to influenza infection ... 23
CHAPTER III – OBESITY IMPAIRS T CELL METABOLISM AND FUNCTION, WHICH
IS NOT CORRECTED WITH WEIGHT LOSS………28
Introduction ... 28
Results ... 30
Discussion ... 37
Experimental model and subject detail ... 45
CHAPTER IV – CORRELATION OF METABOLIC PROFILE TO T CELL
FUNCTION IN ADULTS VACCINATED WITH INFLUENZA QUADRAVALENT
INACTIVATED VACCINE………..63
Introduction ... 63
Materials and methods ... 64
Results ... 66
Discussion ... 71
CHAPTER V – INCREASED RISK OF INFLUENZA AMONG VACCINATED
ADULTS WHO ARE OBESE……….………83
Introduction ... 83
Materials and methods ... 85
Results ... 88
Discussion ... 90
CHAPTER VI – SYNTHESIS ... 104
Overview of research findings ... 104
ix
Conclusions ... 109
x
LIST OF TABLES
Table 4.1. Flow cytometry subject demographics ... 74
Table 4.2. CD4+ and CD8+ T cell metabolic profiling subject demographics ... 74
Table 5.1. 2013-2014 Influenza Season Enrollment ... 95
Table 5.2. 2014-2015 Influenza Season Enrollment ... 96
Table 5.3. Influenza-like Illness during the 2013-2015 Flu Seasons ... 97
Table 5.4. Seroconversion during Influenza-like Illness during 2013-2014
and 2015-2016………...98
xi
LIST OF FIGURES
Figure 2.1. Structure of influenza virus ... 13
Figure 3.1. Development of a model to study the effects of weight
Loss and weight gain on memory T cells…………..……….53
Figure 3.2. Obesity at any time results in dysregulated generation of
memory T cell populations and function to influenza infection………..……….55
Figure 3.3. Metabolic profile is programmed at time of memory
T cell generation. ... 57
Figure 3.4. Obese mice at any point have impaired Glut1 and
cytochrome c expression ... 59
Supplementary Figure 3.1. Lung infection titers, total protein, and pathology ... 60
Supplementary Figure 3.2. Representative diagram of flow
cytometry analysis for memory T cell populations and functional
markers……….….……….….61
Supplementary Figure 3.3. Metabolic profile programmed at time of
memory T cell generation……….……….……….63
Figure 4.1. Frequency of CD4+ and CD8+ T cell populations from healthy weight,
obese non-diabetic and obese metformin-treated diabetic adults . ... 76
Figure 4.2. Frequency of CD4+ and CD8+ T cell activation markers
CD28 and CD69 from healthy weight, obese non-diabetic and obese
metformin-treated diabetic adults………..77
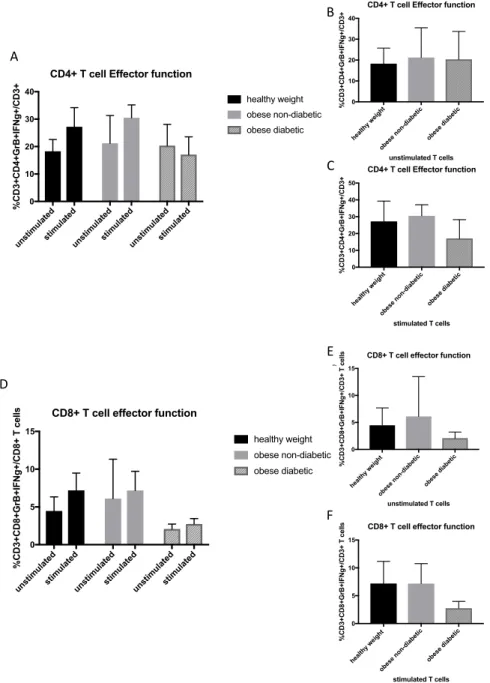
Figure 4.3. Frequency of CD4+ and CD8+ T functional markers granzyme B
and IFN
g
from healthy weight, obese non-diabetic and obese
metformin-treated diabetic adults ... 78
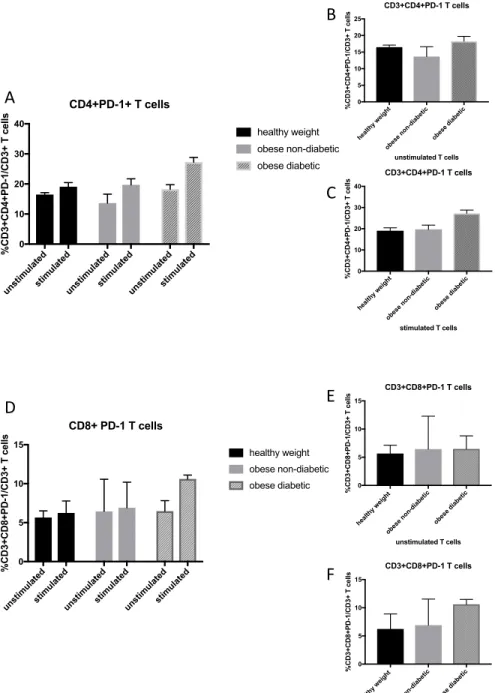
Figure 4.4. Frequency of PD-1 expression on CD4+ and CD8+ T cells from
healthy weight, obese non-diabetic and obese metformin-treated
diabetic adults ... 79
Figure 4.5. Metabolic profile of quiescent CD4+ T cells in healthy weight,
obese non-diabetic and obese metformin-treated diabetic adults ... 80
Figure 4.6. Metabolic profile of activated CD4+ T cells in healthy weight,
xii
Figure 4.7. Metabolic profile of quiescent CD8+ T cells in healthy weight,
obese non-diabetic and obese metformin-treated diabetic adults ... 82
Figure 4.8. Metabolic profile of activated CD8+ T cells in healthy weight,
obese non-diabetic and obese metformin-treated diabetic adults ... 83
Figure 5.1. Subjects who later became infected had unimpaired HAI against
Influenza Vaccine and Circulating Strains ... 103
Figure 5.2. Confirmed Influenza was not predicted by HAI ... 104
Figure 5.3. Confirmed Influenza was not predicted by Microneutralizing
Antibodies ... 105
Figure 5.4. Subjects who later became infected had unimpaired HAI against
xiii
LIST OF ABBREVIATIONS
Akt Protein kinase B (serine/threonine protein kinase)
AMPK 5’-adenosine monophosphate-activated protein kinase
ANOVA Analysis of variance
AP-1 Activator protein-1
APCs Antigen presenting cells
ATP Adenosine triphosphate
BAL Bronchoalveolar lavage
BMI Body mass index
C57BL/6J general purpose mouse model
CD Chow diet
CD4+ Cluster of differentiation 4
CD8+ Cluster of differentiation 8
CD11a T cell migration factor LFA-1
CD127 IL-7Ra chain
CPT1 Carnitine palmitolytransferase 1a
CVD Cardiovascular disease
db/db mutation in leptin receptor mouse model
DIO Diet-induced obesity
DNA Deoxyribonucleic acid
xiv
ECAR Extracellular acidification rate (mpH/min)EID50 400 egg infectious dose50%
ELISA Enzyme linked immunosorbent assay
EM Effector memory
FACS Fluorescence activated cell sorting
FAO Fatty acid oxidation
FFA Free fatty acid
FBS Fetal bovine serum
FCCP Carbonyl cyanide-p-trifluoromethoxyphenylhydrazone
GATA3 Transcription factor GATA binding protein 3
Glut1 Glucose transporter 1
H&E Hematoxylin and eosin
HA Hemaggluttinin protein
HAI Hemaggluttinin inhibition assay
HDL High density lipoprotein
HEV High endothelial venules
HFD High fat diet
IL Interleukin
IFN Interferon
IKKb Inhibitor of nuclear factor kappa B kinase beta
xv
IFNs Type I interferonsIgA Immunoglobulin A
IgG Immunoglobulin G
IRF3 IFN-regulatory factor 3
IRS-1 Insulin receptor substrate 1
JNK Janus kinase
LAIV Live attenuated influenza vaccine
LAL Lysosomal acid lipase
LCMV Lymphocytic choriomeningitis virus
LepR Leptin receptor
LFD Low fat diet
M1 Influenza matrix protein 1
M2 Influenza matrix protein 2
MCP-1 Macrophage chemoattractant protein-1
MDCK Madin-Darby canine kidney epithelial cells
MEM Minimum essential medium
MHCI Major histocompatibility complex I
MHCII Major histocompatibility complex II
mLN mediastinal lymph node
MOI Multiplicity of infection
xvi
NA Neuraminidase
NF-kB Nuclear factor kB
NK Natural killer T cells
NLRP3 NOD-like receptors
NOS2 Nitric oxide synthase 2
NP Nucleoprotein
NS Non-structural protein
ob/ob mutation in leptin gene mouse model
OCR Oxygen consumption rate (pmoles/min)
OCR:ECAR OCR/ECAR
OXPHOS Oxidative phosphorylation
PA RNA polymerase A
PAMPS Pathogen associated molecular patterns
PB1 RNA polymerase B1 subunit
PB2 RNA polymerase B2 subunit
PBMC Peripheral blood mononuclear cell
PBS Phosphate buffered saline
PD-1 Programmed cell death protein 1
pDC Plasmacytoid dendritic cells
pH1N1 Influenza A/Puerto Rico/8/1934 (H1N1)
xvii
PR8 Influenza virus A/Puerto Rico/8/34PRR Pattern recognition receptors
RANTES Chemokine, regulated on activation, normal T cell expressed and secreted
RIG-1 retinoic acid inducible gene I
RNA Ribonucleic acid
RPMI Roswell Park Memorial Institute medium
SEM Standard error of the mean
SLC Solute carrier
SLE Systemic lupus erythematosus
SRC Spare respiratory capacity
ssRNA Single stranded RNA
STAT6 Signal transducers and activators of transcription 6
TAG Triacylglycerol
TCID50 Tissue culture infectious dose 50
TCR T cell receptor
TIV Trivalent inactivated vaccine
TNF-a Tumor necrosis factor alpha
TLR Toll like receptor
Tfh T follicular helper cells
TCM Central memory T cells
xviii
TEMRA Terminally differentiated effector memory T cells
Th1 T helper 1 subtype
Th2 T helper 2 subtype
Th17 T helper 17 subtype
TRAF6 Tumor necrosis factor receptor 6
TRM Tissue resident memory T cells
Treg Regulatory T cells
1
CHAPTER I: OVERVIEW AND SPECIFIC AIMS
Overview
Over the past few decades, obesity has emerged as a worldwide epidemic and presents an increased risk for a constellation of other diseases including metabolic syndrome. Of particular note, obesity is recognized as an independent risk factor for increased morbidity and mortality from infection with influenza virus. Each year, 3,000 to 50,000 people in the US die from infection with influenza, and the approximate 500 million individuals worldwide who are obese are at an increased risk. It is imperative that we understand how obesity contributes to a poor outcome following influenza infection in order to devise strategies to limit morbidity and mortality in this expanding at-risk population.
Using a well-defined mouse model of both obesity and influenza infection, we have shown that obesity drives a dysfunctional immune response to influenza challenge. Our lab has demonstrated that following infection with influenza, diet induced obese mice have increased morbidity and mortality, decreased lung effector memory CD8+ T cells, and impaired activation and function of memory T cells to a secondary challenge with influenza virus. Previously, all of our infection studies have been carried out in obese mice. What is missing is whether or not weight loss can restore immune function or if weight gain, after memory T cells have been
generated, inhibits their function. Can weight loss restore the function of memory T cells that were generated during the obese state? Do memory T cells, generated in a lean state, fail to function in an obese state?
2
cells for pathogen clearance. Effector T cells give rise to the memory T cell phenotype, but the differentiation pathways of these cells are not clearly defined, and even less is known about obesity and its role in the differentiation and maintenance of memory T cells. While effector T cells can live for days or weeks, memory T cells can last for months, years, or a lifetime. The reprogramming of a naïve T cell to become an effector cell and then a memory cell involves changes in chromatin structure and transcription factors to drive the cell to a specific fate. What has not been thoroughly investigated is whether obesity, at the time of reprogramming,
determines the memory T cell fate indefinitely.
Nutrient conditions can influence the fate of T cell immune responses. Naïve CD4+ and CD8+ T cells utilize oxidation of glucose and fatty acids through beta-oxidation and the oxidative phosphorylation pathways. Upon exposure to antigen to activate these cells to an effector T cell phenotype, the metabolic demands increase in order to support rapid proliferation and effector function to clear the pathogen. Activation of CD4+ and CD8+ T cells results in a metabolic switch to utilize more glycolysis and glutaminolysis, and less oxidative phosphorylation. After the pathogen has been cleared and during the T cell contraction phase, the metabolic needs change to differentiate the effector cell to a long-lasting memory cell, which utilizes the oxidative
3
Specific AIMSAIM 1: Determine if obesity impairs the metabolism of resting and activated memory T cells following a secondary influenza infection?
Hypothesis: Compared to lean mice, the metabolism of memory T cells from obese mice will be more active at rest, thereby limiting their metabolic potential when activated.
AIM 2: Determine if weight loss restores T cell metabolism and function to secondary influenza infection.
Hypothesis: Weight loss will restore T cell metabolism to a “lean” metabolism and improve function of memory T cells, impairing the response to a secondary influenza infection.
AIM 3: Determine if weight gain will induce metabolic dysfunction and impair the function of memory T cells generated in a lean state.
4
CHAPTER II: BACKGROUND AND SIGNIFICANCE
Obesity introduction
Over the past 25 years, obesity, defined as a body mass index (BMI) over 30 (weight in kilograms divided by the square of height in meters) [1] has emerged as a worldwide growing public health concern, and continues to remain a contributing factor for chronic disease [2, 3]. The United States is ranked 18th in the world with the highest percentage of obesity in the adult population [4]. Within the United States alone, the rise of obesity has increased dramatically over [5]several decades. In 1985, no state had obesity rates higher than 15%. Currently, there are no states that remain under 20% with the majority of states above 25% [6]. The prevalence of obesity in the adult population from 2011-2014 was 36.5% [1], and childhood obesity at 17% [7] is paralleling the adult trends and continuing to rise as well. Obesity as a chronic condition can manifest into more serious, costly, and disabling conditions. However, obesity is also one of the top modifiable and preventable disease conditions.
5
an independent risk factor for increased risk of respiratory hospitalizations during influenza season [13], along with increased morbidity and mortality to the 2009 pandemic influenza A H1N1 infection [14].
Metabolic syndrome
Obesity often leads to the development of metabolic syndrome, a combination of risk factors that contribute to cardiovascular disease or the onset of type II diabetes. These risk factors include glucose intolerance, central adiposity, dyslipidemia, decreased high density lipoprotein and hypertension [15]. There have been many suggestions for defining metabolic syndrome, which has led to confusion and inconsistencies in collecting data [16], therefore the International Diabetes Federation proposed a world-wide definition to classify metabolic syndrome as having central obesity and 2 or more of the following factors: raised triglycerides, reduced high density lipoprotein (HDL)-cholesterol, raised blood pressure, and raised fasting plasma glucose [16-18].
There has been some debate as to whether all obesity overlaps with metabolic syndrome, as there are metabolically healthy obese individuals that have normal insulin and glucose levels [19], which deviates from the metabolically unhealthy obese phenotype. To date, there is no consensus on a definition of a metabolically healthy phenotype, however, most studies suggest that the absence of insulin resistance, lipid disorders and hypertension would constitute this phenotype [15]. While the term metabolically “healthy” obese is emerging in the literature, epidemiological studies suggest the need for stricter parameters and guidelines assessed to make such a definition. A systematic review on 20 studies in the literature and the association with cardiovascular disease (CVD) were assessed. They found a slight increase in
cardiovascular risk of metabolically healthy obese adults compared to healthy weight adults, but it was difficult to assess whether this was a true risk or due to differences in methodology from the studies evaluated [20]. It is not currently known whether metabolically healthy adults have
6
Conversely, other studies suggest that the metabolically unhealthy obese phenotype can be reversed through lifestyle modifications or surgical means [21-23]. Lifestyle modifications with weight loss have decreased insulin resistance [24], prevented the onset of type II diabetes with impaired glucose tolerance [25, 26] and improved hypertension [27] and lipid values [28, 29]. Therefore, inducing weight loss by physical means improves metabolic health parameters. Bariatric surgery has been used as an intervention tool to induce weight loss, decreasing long-term morbidity and mortality compared to obese participants that did not undergo surgery [30-33], and decreased the development of new obese related conditions [30, 34]. Thus, weight loss through lifestyle modifications or surgical means improves metabolic health in previously obese adults.
Obesity and inflammation
The complications of obesity do not arise from a single tissue, but an orchestrated crosstalk among various tissues that results in a state of low-grade, chronic inflammation. While the mechanisms are not fully understood, it is suggested that liver, adipose, muscle, pancreas, brain, and gut [35-37] all contribute to obesity-induced chronic inflammation through various mechanisms [38]. This type of chronic inflammation differs from the normal physiological response of acute inflammation that is initiated by responding to an invading pathogen, or to an injury that requires the immune system to repair and restore the body to homeostasis. Acute inflammation is characterized by redness, increased heat, swelling, pain, and loss of function [39], whereas obesity-induced chronic inflammation results in dysregulated cytokine production, acute phase reactants, and increased activation of inflammatory signaling cascades [40, 41].
7
adipose tissue primarily consists of stromal vascular cells in which ~65% are leukocytes [43]. As adipocytes increase in volume (hypertrophy), they accumulate in subcutaneous (depots under the skin) or visceral locations (depots surrounding the organs). The accumulation of adipocytes in visceral depots increases risk for developing type 2 diabetes and cardiovascular disease [44-46].
Adipocytes secrete leptin, adiponectin, resistin, other adipokines which regulate energy
homeostasis and pro-inflammatory cytokines such as IL-6 and TNF-a [47]. Leptin is an adipokine that is secreted in proportion to adiposity, and primarily regulates appetite and body weight regulation through the hypothalamus. However, leptin has various other roles related to
immunity, reproduction, insulin sensitivity and growth [48-50]. Levels of adiponectin are higher in leaner individuals, and act on many tissues to improve insulin sensitivity [51] by inducing fatty oxidation in the liver, decreasing glucose production from the liver, and improving beta cell function [42].
Adipocytes are insulin sensitive tissues, and obesity contributes to the development of insulin resistance. Insulin resistance can be defined as the contributions of decreased effects of insulin on glucose uptake, metabolism and storage [52]. Manifestations of insulin contribute to the decreased uptake of glucose by tissues, and impaired suppression of hepatic glucose [52].
8
mitochondrial function, activating kinases that inhibit signaling of the insulin receptor to decrease glucose mediated transport into the cell, leading to insulin resistance [53].
Free fatty acids released from visceral adipose are taken up by the liver and may contribute to increased synthesis of triglyercides and released as very low-density lipoproteins which may contribute to hyperlipidemia. Conversely, the free fatty acids released from
subcutaneous adipose tissue can be oxidized by muscle, and do not contribute as much to the synthesis of triglycerides compared to visceral adipose tissue. Additionally, the release of excess fatty acids can activate components of the innate system and activate toll like receptor 4 (TLR4), stimulating macrophages to secrete inflammatory cytokines further creating a more
pro-inflammatory environment [54].
The role of adipocytes and the immune cells that reside within the adipose tissue have greatly contributed to understanding the contributions of chronic inflammation and insulin
resistance in obesity [55]. Tumor necrosis factor alpha (TNF-a) was one of the first cytokines found to be secreted by the adipose tissue that induced local and systemic effects and promoted insulin resistance [56]. Additional cytokines such as leptin, macrophage chemoattractant protein-1 (MCP-protein-1), resistin, angiotensinogen, IL-6, serum amyloid A, plasminogen activator inhibitor-protein-1 and many others have since been discovered to be secreted by adipocytes and contribute to low-grade inflammation [41, 57-61]. T cells have been implicated in regulating the pro-inflammatory state and insulin sensitivity through a variety of potential mechanisms [55, 62-65]. T cell secretion
of IFNg polarizes macrophages to an M1 phenotype, inducing the secretion of pro-inflammatory
cytokines IL-6 and TNF-a, whereas T cells that secrete IL4, IL-13, and IL-10 polarize
macrophages to an anti-inflammatory M2 phenotype, which secretes high levels of IL-10 [54]. Increasing this pro-inflammatory M1 macrophage phenotype can negatively affect insulin
9
increase in an activated immune population that is favorable to maintain obesity induced inflammation.
Inflammatory cytokines, lipids, endoplasmic reticulum stress, and reactive oxygen species activate intracellular signaling cascades by different mechanisms, resulting in the
activation of the IKKb/NF-kB and JNK pathways [40, 41, 54, 69, 70] in metabolic cells such as adipocytes, hepatocytes and macrophage subtypes [54]. Excess nutrient intake can dysregulate the innate immune response via pattern recognition receptors (PRR)[71]. Toll like receptors (TLRs) are a type of PRRs that are normally activated by pathogens and initiate the appropriate immune response to clear the pathogen, however, in obesity, adipocyte TLRs can be activated by
lipids [19, 72]. Activation of TLRs by lipids can lead to increased expression of TNF-a, IL-6, and
other inflammatory mediators [19]. IKKb/NF-kB activation leads to the translocation of NF-kB to the nucleus, whereas JNK activates the transcription factor activator protein-1 (AP-1), and both of these transcription factors increase expression of inflammatory genes [40]. Kinases IKK and JNK also contribute to inhibition of insulin signaling by serine phosphorylation of the insulin receptor substrate 1 (IRS-1), resulting in ubiquitination and degradation, and inhibiting downstream signaling [73]. The continued production of these inflammatory mediators maintains a feed forward loop, with no complete resolution of inflammation.
Obesity and vaccination
Immunization is the best method of protection from many infectious diseases. To date, there are limited studies reporting vaccine effectiveness in obesity. The response to hepatitis B vaccine has been the most studied. Several groups have consistently reported decreased response of protective levels of antibodies to hepatitis B surface antigen in obese adults [74-76], and poor hepatitis B antibody response in obese pre-adolescents [77].
10
various BMI’s to acquire serum and peripheral blood mononuclear cells (PBMCs) pre and 30 days post influenza vaccination. In addition, as this study was conducted over multiple years, some participants also had a 1 year blood sample. Influenza antibody titers measured by ELISA at 30 days post vaccination did not yield any significant differences between healthy weight, overweight, and obese groups, however, at 1-year post vaccination there was a decline in antibody titers in obese participants measured by ELISA and hemagglutination inhibition assays (HAI), the standard measure of influenza antibody titers [79]. Compared with CD4+ and CD8+ T cells from healthy weight individuals, PBMCs from obese adults stimulated with vaccine strains of
influenza showed decreased activation markers and functional markers IFNg and Granzyme B
[81] .
Together these data demonstrate that compared to healthy weight adults, both humoral and cellular vaccine-induced immune responses are altered in obese adults. To circumvent the decreased effectiveness of influenza vaccination in obesity, the use of adjuvants has been explored. Lean and obese mouse models were administered H7N9 vaccine alone, or vaccine with alum or squalene adjuvant and then challenged with A/Anhui/1/2013 H7N9 virus. Obese mice were able to mount an immune response producing neutralizing and nonneutralizing antibodies, however, compared with lean mice, viral clearance was still impaired increasing morbidity and mortality [78].
11
Animal models of obesityThere are many types of animal models used to study obesity, including rodents, pigs, canines, and non-human primates [84]. Rodents are the most commonly used models in studying obesity, but the choice of model depends on the scope and goals of the study. Two of the primary rodent models used in obesity studies are the monogenic and diet-induced mouse models.
The monogenic mouse models have spontaneous, single gene mutations or genetically engineered mutations that results in obesity. The more commonly used monogenic models are the ob/ob and db/db mouse models [85]. The ob/ob mouse model contains a spontaneous, single base pair deletion in the leptin gene that inserts a premature stop codon [84, 86, 87], resulting in a loss of function mutation [85, 88]. It is important to note, however, that the genetic background of these mice will dictate the obesity phenotype. For example, ob/ob on the C57BL/6J
background will show a phenotype with extreme obesity, hyperinsulinemia, insulin resistance and hyperglycemia, whereas, on a C57BL/KS background, ob/ob mice will develop hyperglycemia and diabetes, reach maximum weight at 3-4 months of age, followed by gradual weight loss then death by 6 months of age [89].
All genetic backgrounds of ob/ob mice will result in a leptin deficiency that induces hyperphagia and reduced energy expenditure, resulting in obesity [85]. The db/db mouse model, or “diabetes mouse” contains a spontaneous mutation of a G to T point mutation in the leptin receptor gene that results in leptin receptor deficiency [86, 89]. These mice have very similar phenotype to that of the ob/ob, however, with high levels of leptin proportional to adiposity [89]. Monogenic models offer great value in testing potential therapeutics due to the distinct phenotype [85, 88], yet polygenic models are more similar to the human obese phenotype as the most common forms of human obesity are the result of the effects of multiple genes.
12
60% kcal fat content of soybean oil and lard are more commonly chosen depending on the experimental design and desired phenotype outcome.
Influenza virus epidemiology
Influenza virus is a highly contagious respiratory virus. Symptoms include fever, chills, cough, sore throat, runny or stuffy nose, muscle or body aches, headache, fatigue, and possibly vomiting and diarrhea [91]. It can take up to a couple of weeks to recover from the illness, and can lead to pneumonia and exacerbations of preexisting conditions such as asthma or chronic heart disease [91]. Most healthy people that contract influenza will recover within two weeks, however, certain populations are at higher risk for developing flu complications that can lead to severe outcomes including death. Populations at higher risk include pregnant women, children 6-59 months, adults over 65 years old, and immunocompromised individuals [92].
Outbreaks and pandemics of the influenza virus have been observed for the past three hundred years [93]. In 1918-1919 the worst pandemic of influenza infection emerged, with an estimated one-third of the world’s population infected [94], and estimates of 50-100 million deaths [95, 96]. From 1979-1994, the crude percent overall death rate caused by influenza and
pneumonia increased 59% [97], and flu continues to remain one of the top ten leading causes of death in the United States [98]. In order to understand the methods of transmission and
13
Influenza virus structureInfluenza virus is an enveloped, negative stranded, segmented RNA virus that belongs to the Orthomyxoviridae family. There are four types of influenza viruses: A, B, C and D [99]. In humans, influenza viruses A and B are typically responsible for seasonal infections with strain A associated with more serious illness. Influenza C strains result in mild illness and D strains are isolated to cattle and not known to currently be transmitted to humans [99]. Influenza strains A and B contain 8 RNA segments, whereas influenza C contains 7 segments[100].
Influenza A viral proteins include hemagglutinin (HA), neuraminidase (NA), matrix protein (M1), RNA polymerase B1 subunit (PB1), RNA polymerase B2 (PB2), RNA polymerase A (PA), nucleoprotein (NP), and non-structural protein (NS) [100]. The outer structure of the virus consists of a lipid bilayer, which is obtained from the host during virus budding from an infected host cell. The lipid membrane contains viral encoded glycoproteins HA and NA [99]. HA is the most abundant protein in the lipid bilayer and forms trimeric spikes that bind to sialic acid receptors on
Figure 1. Structure of influenza virus.
14
host cells[101]. The HA also contains neutralizing antibody binding sites. The binding of the HA to host sialic acid receptors facilitates entry of the virus into the cell. Cells of the upper respiratory
tract of humans primarily contain a2,6-linked sialic acids, with cells of the lower respiratory tract
consisting of a2,3-linked sialic acids. This receptor specificity is one of the factors that
contributes to zoonotic transmission of the virus, as avian influenza viruses preferentially bind to a2,3-linked sialic acids, which can be found in ducks, chickens, and migrating birds, but can still
infect humans by infecting the lower respiratory tract [102, 103].
NA forms tetrameric structures that span the lipid bilayer and function as enzymes that cleave the sialic acids from the HA proteins to allow budding and release of the virion to infect neighboring cells [102]. Selected point mutations in these two proteins contribute to antigenic drift that can create influenza epidemics every 1-2 years [100]. However, when a cell is infected with more than one influenza strain and combines different HA and NA proteins to create a new subtype, a pandemic can occur [104]. The NA protein is the target of oseltamivir (Tamiflu) and zanamavir (Relenza), antiviral medications used to treat influenza infection [100].
The M1 protein is present in Influenza A viruses, and constitutes the matrix layer of the virus, that protects the viral RNAs. To release the viral RNAs upon entry into the host cells, the M2 ion channel protein pumps ions from the endosome to the interior of the virion, decreasing the pH, initiating the fusion of the inner layer of the endosome to release the viral RNAs. The release of the bound viral RNAs can then enter the nucleus and begin replication. The M2 channel is the target of adamantine family of antiviral drugs to inhibit viral replication, however, mutations in the virus result in resistance to this class of drugs [105].
Once the negative stranded viral RNAs enter the nucleus, the RNA dependent RNA polymerase complex made up of PA, PB1, and PB2 produces positive strand mRNA, to serve as templates for the transcription of viral proteins in the cytoplasm. These newly synthesized viral proteins are transported back to the nucleus and associate with NP to form viral
15
endoplasmic reticulum are transported to the cell membrane, and when enough proteins aggregate at the plasma membrane, they bud off and form new virions.
Innate Immune response to influenza
The immune system is composed of innate and adaptive immune system of cells, tissues and organs that form a complex network to initiate an immune response to any invading
pathogens, or injury. Upon infection, the innate system is activated immediately to provide the first line of host defense. The innate immune system is composed of chemical and physical barriers such as mucosal epithelium; innate immune cells such as macrophages, neutrophils, dendritic cells and natural killer cells (NK); and circulating proteins and cytokines that coordinate the interactions with immune cells and the environment to provide a constant layer of immunity [106]. The coordinated actions of innate immunity also provides support for the activation of the adaptive immune system, which is specific for the invading pathogen.
16
the virus from the mucus layer to gain entry into the respiratory epithelium [118]. Upon entry into the respiratory epithelium, innate cells such as neutrophils, dendritic cells, monocytes,
macrophages and NK cells coordinate actions to limit infection and damage [101].
The innate system recognizes conserved regions of microbial agents, or pathogen associated molecular patterns (PAMPS) that are recognized by pattern recognition receptors (PRRs) on the infected cell. Influenza virus is recognized by specific PRRs: Toll-like receptors (TLRs), retinoic acid inducible gene I (RIG-I), and NOD-like receptors (NLRP3) [101]. Several innate immune cells work together to kill and clear the virus and any infected or dead host cells by PAMP activated signaling mechanisms. TLR3 which recognizes double stranded RNA (dsRNA) is expressed in many innate cells such as macrophages, and dendritic cells in humans and mice [119-123]. For example, when infected cells are phagocytosed by macrophages, TLR3 present in the phagosome will recognize viral dsRNA, viruses produce dsRNA during part of the infection cycle [124]. This activation induces a signaling cascade, culminating in the activation of
nuclear factor kB (NF-kB) and IFN-regulatory factor 3 (IRF3), transcription factors that produce
pro-IL-1b, pro-IL-18, TNF-a, IL-6, and IL-1 and other pro-inflammatory cytokines [125, 126].
TLRs 7 and 8 recognize ssRNA, and both are closely related proteins that can recognize the same ligand [127]. TLR7 is primarily expressed in innate plasmacytoid dendritic cells (pDCs) and IFN stimulated B cells [74], whereas TLR8 is expressed in macrophages and myeloid dendritic cells [128] and present in the endosomes from these innate cell types. The activation of
TLR7/8 induces signaling that activates IRF7 and NF-kB pathway also producing type I
interferons and pro-inflammatory cytokines [129].
RIG-I is expressed in most cells, and detects viral 5’ tri-phosphate RNA to activate IRF3
17
complex of proteins making up the NLRP3 inflammasome. The formation of this complex
activates caspase-1 which cleaves pro-IL-1b, pro-IL-18 into their bioactive forms [101, 125].
The end result of initiating these signaling cascades are the production of
pro-inflammatory cytokines, chemokines, and secretion of type I interferons (IFNs) [125]. Type I IFNs induce expression of hundreds of IFN stimulated genes that function as anti-viral genes to protect
uninfected cells, and limit infection of infected cells [101]. IL-1b is crucial to recruit innate immune
cells to the site of infection [131], while IL-18 enhances production of IFNg from NK and T cells to enhance cytotoxic activity [132, 133].
Adaptive immune response to influenza
The adaptive immune system consists of the humoral and cellular immune response that correlates with B and T cell driven immunity, respectively. In the context of influenza infection, vaccination strategies more commonly target the humoral response, to initiate the production of antibodies from antibody secreting B cells knows as plasma cells. Antibodies can bind to surface proteins of the virus to prevent the virus from infecting host cells (neutralization) and can bind to proteins of the complement system to activate opsonization and phagocytosis. Antibodies can also bind to infected cells to target the cell for antibody dependent cellular cytotoxicity carried out by innate cells [106, 134]. Dimeric, secretory immunoglobulin A (IgA) is the dominant mucosal antibody produced locally in the upper respiratory tract that offers protection by immune
exclusion, intracellular neutralization, and antigen excretion [135]. Immunoglobulin G (IgG) is the most abundant circulating antibody in the serum, but is also found in the lower respiratory tract and facilitates cytotoxicity from NK cells and aids in opsonization of infected cells for clearance by alveolar macrophages [101, 134].
18
the infection. Alveolar macrophages reside in the alveolar lumen while dendritic cells reside in the airway epithelium and together these cells function to provide immune surveillance in the lung. Alveolar macrophages phagocytose infected cells [136], or secrete nitric oxide synthase 2
(NOS2) and TNF-a [137, 138] to limit the spread of infection. Antigen presenting cells (APC) such as dendritic cells endocytose viral components and migrate to the draining lymph nodes to present viral peptides through specialized cell surface receptors called major histocompatibility complexes (MHC), to be recognized by specific T cells. It is these interactions that bridge the coordination of the innate and adaptive immune arms to enhance a more specific and targeted immune response to influenza infection.
There are two classes of MHCs that bind to different subsets of T cells. The uptake of an extracellular virus or proteins in lysosome/endosomal vesicles are degraded by proteases, bound to MHC class II receptors, transported to the cell surface and presented to CD4+ T cells to proliferate and initiate helper functions [106]. Cytosolic viral proteins are degraded by proteasomes and transported to the endoplasmic reticulum where they bind to MHC class I receptors to be exported to the cell surface and presented to CD8+ T cells to activate them to proliferate and initiate cytotoxic functions [106]. T cells can only recognize specific amino acid sequences along with portions of the MHC molecule. In contrast, B cells can recognize peptides, proteins, nucleic acids, carbohydrates, lipids and small chemicals [106]. The presentation of viral peptides by APCs to T cells in secondary lymphoid organs initiates B and T cell signaling
cascades. When there has been no previous exposure to the virus, the primary immune response is initiated that relies heavily on the innate immune response before the adaptive immune response can be activated, however, immunological memory to the infection is
generated following a primary infection, allowing for a more rapid and efficient response following re-exposure.
19
Memory cell generationImmunological memory is the process of the adaptive immune system that produces a more efficient and faster immune response to a previously encountered antigen. The premise for effective vaccination relies on the ability of the immune response to maintain immunological memory. Vaccination or a primary influenza infection initiates the adaptive immune system to respond in three phases: expansion, contraction, and memory cell generation and maintenance.
Naïve T cells recirculate in the blood and lymphoid tissues until recognition of cognate antigen presented by APCs in the lymph node. Naïve T cells initially enter the lymph nodes through high endothelial venules (HEV) via their homing cell surface receptors CD62L and CCR7, which bind to epithelial PNAD and SLC, respectively [139]. Upon sufficient antigen presentation and co-stimulation by APCs, CD8+ T cells proliferate and expand, acquiring antiviral effector functions such as producing IFNg, TNFa, and upregulating expression of perforin and granzymes [140].
CD8+ T cell activation and expansion is dependent on adequate T cell receptor (TCR) and
co-stimulatory signals, but also requires IL-12 and IFN-a to generate effector and memory CD8 T
cells [141].
CD4+ T cell activation and expansion is dependent on the cytokine environment. Following influenza infection, Th1 subset of CD4+ T cells produces IFNg, TNFa, and IL-2 along
20
Activation and expansion induced by antigen stimulation differentiates naïve T cells into effector CD4+ or CD8+ T cells. Effector cell expansion peaks at about 7 days post infection, followed by T cell contraction (90% of effector cells removed by apoptosis) and resolution of the viral infection. The cells that do not undergo apoptosis differentiate into long-lived antigen-specific memory T cells. As naïve T cells differentiate into effector cells, changes in chromatin structure and expression of transcription factors occurs in addition to changes in the expression of cell surface receptors [149].
The memory pool created in response to initial primary exposure to a specific pathogen consists of a heterogenous population of effector memory T cells (TEM ), central memory T cells (TCM) [150], and tissue resident memory T cells (TRM) [151]. TEM and TCM have been identified based on the expression of CD62L and CCR7 cell surface receptors. TEM are primarily found in peripheral tissues coinciding with effector functional properties of cytotoxicity and inflammatory reactions where TCM are primarily found in lymphoid tissues and display more helper functions to stimulate dendritic cells, help B cells and rapidly proliferate into effector cells following antigen
stimulation [150]. Additionally, the high expression of IL-7Ra chain (CD127) identifies memory T
cells [152, 153].
21
Memory cell metabolismT cell metabolism is a dynamic process, with metabolic needs changing with the environment and stress signals. Before an encounter with antigen, naïve T cells are smaller in size, and maintain survival and homeostasis through T cell receptor (TCR) and IL-7 receptor signaling, which regulate expression of the glucose transporter, Slc2a1 [156]. Glut1 is the
dominant glucose transporter expressed in T cells [157], with increased Glut1 expression leading to increased glucose uptake. Changing metabolic needs in response to pathogen exposure are indicative of function. Naïve T cells circulate in secondary lymphoid tissues maintaining low levels of glycolysis, obtaining energy needs through fatty acid oxidation (FAO) and oxidation of pyruvate and glutamine through oxidative phosphorylation (OXPHOS) [73, 157]. These energy needs change during recognition of cognate antigen for the transition from naïve T cell to an activated effector T cell that proliferates and acquires effector functions to clear the pathogen.
Effector T cells utilize anabolic metabolism to produce lipids, nucleic acids, and proteins to support rapid proliferation of daughter cells and acquire effector functions to clear out the infection switching from a preference for OXPHOS to aerobic glycolysis and glutaminolysis [73]. Aerobic glycolysis was initially proposed by Otto Warburg to describe the unique metabolic needs of cancer cells and their metabolism of glucose metabolized to lactate despite presence of sufficient oxygen [158]. This Warburg effect has also been used to describe the metabolism of activated T cells [159]. After the pathogen has been cleared, the majority of effector T cells undergo apoptosis to yield a small population of long-lived memory T cells.
22
target of rapamycin (mTOR) which regulates cell growth and metabolism, also regulates CD8+ T cell memory generation [163].
Unlike naïve T cells, memory T cells need to be metabolically primed to initiate a faster immune response upon re-encounter with antigen. IL-15 promotes mitochondrial biogenesis and increases the expression of carnitine palmitoyltransferase 1a (CPT1a) which transports long-chain fatty acids into the mitochondria to be used for FAO [162]. Enhanced mitochondrial
biogenesis and increased CPT1a expression contribute to the spare respiratory capacity (SRC) of memory T cells [164], where SRC is the difference of the ATP produced at the basal level by oxidative phosphorylation compared to maximal potential [165]. Van der Windt, et al., proposed a model how SRC regulates memory T cell survival in infection, where increased mitochondrial mass increased use of fatty acids for OXPHOS, inducing memory cells to quickly switch their metabolism for pathogen clearance [162]. In contrast to effector T cells, memory T cells do not use stored extracellular fatty acids nor do they contain lipid droplets, but rather to fuel FAO, rely on extracellular glucose to synthesize triacylglycerol (TAG), utilizing lysosomal acid lipase (LAL) to release fatty acids to fuel FAO [166].
23
maintenance, it is important to investigate whether nutrient conditions of high serum glucose and fatty acids present with obesity dysregulate memory T cell metabolism.
Obesity effects on the immune response to influenza infection
Studies in obese mice infected with influenza virus demonstrate impaired innate and adaptive immune defenses resulting in increased morbidity and mortality [78, 169-173]. Impairments in the primary immune response were first demonstrated by Smith, et al., by inducing obesity in C57BL/6J mice with diet and infecting them with a mouse adapted strain of influenza virus A/Puerto Rico/8/34 (PR8). The mortality rate of obese mice to PR8 was 6.6 fold greater than the lean mice, and was associated with reduced NK cytotoxicity. At day 3 post
infection, obese mice had reduced mRNA expression of anti-viral cytokines IFNa and IFNb in the
infected lung [169]. Lung cytokines TNF-a, IL-6, and IL-1b, normally produced during the
inflammatory response to influenza, were decreased in obese mice compared to lean mice at day 3, along with chemokines MCP-1 and RANTES, which function in immune cell recruitment. In addition, obese PR8 infected mice have delayed mononuclear infiltration in the lung and decreased dendritic cell numbers [173]. Dendritic cells from infected obese mice displayed
impaired function, as they were not able to properly stimulate CD8+ T cells to produce IFNg [173].
Together these data suggest that obesity results in decreased immune response to a primary infection with PR8 influenza virus, resulting in increased mortality.
Based on the findings that obesity impairs the primary immune response, Karlsson and colleagues utilized DIO mouse models to investigate whether the memory T cell response to secondary influenza infection was impaired [170]. Lean and diet induced-obese mice were infected with X-31, a mouse adapted H3N2 influenza strain, and 4 weeks later infected with PR8.
Although lean mice were fully protected from the secondary infection, obese mice had a 25% mortality rate. Lungs from influenza infected obese mice had low expression of antiviral cytokines
24
expression and reduced influenza specific CD8+ T cells expressing IFNg. Memory T cells had
decreased IFNg response to antigen presentation by DCs [170]. This set of experiments provided
evidence that the memory response to secondary influenza infections was also impaired.
DIO also affects the maintenance of TEM and TCM populations. TCM were maintained and remained constant with a slight increase in the obese group 84 days post infection in the lungs and spleen. However, compared to lean mice, TEM cell number and percent in the lungs decreased in the obese mice at 84 days post infection [171]. Cytokines specific to memory homeostasis and survival had dysregulated expression in obese mice compared to lean mice,
and inflammatory cytokines TNF-a and IL-6 were significantly increased in the lungs of obese mice 84 days post infection, despite the clearance of virus from the lungs [171]. The inability of obese mice to maintain influenza specific memory T cells suggest that impairments contribute to ineffective immune responses to subsequent exposures of influenza virus.
These findings of impaired memory T cell responses and maintenance of memory T cell populations led to further studies to determine the mechanisms contributing to these results. The 2009 influenza pandemic revealed one caveat that shed light on potential mechanisms of
influenza immunity. Prior exposure to influenza virus can generate cross protective immunity where T cells recognize the internal conserved regions of the influenza A virus and can recognize and aid in recovery and decrease morbidity to influenza A strains with differing external cell surface proteins [174-178].
25
mice having significantly higher microneutralization titers [172]. Furthermore, obese mice present a delayed response of antibody titer, at day 7 were significantly decreased compared to lean mice, but at 35 days post infection obese mice had no detectable levels demonstrating the inability to maintain antibody titers [172]. Nucleoprotein specific antibody titers were measured to determine cross reactive neutralization to pH1N1 infection, and obese mice has significantly lower levels at 5 weeks post infection, increased viral titer, and increased lung pathology [172]. Lungs of obese mice also had increased immune cell infiltration, and increased levels of albumin from bronchoalveolar lavage fluid (BAL), indicating damage to the lung epithelium. Evaluation of regulatory T cell populations (CD25+Foxp3+) demonstrated that obese mice had increased numbers in the lung, but these populations were less suppressive, indicating impaired Treg function [172]. Overall, these data suggest that obesity alters the cross protective response to pH1N1 influenza infection in mice which had not previously been demonstrated.
These experiments established that obesity impairs the humoral and cell mediated immune response to influenza infection. Diet-induced obese mouse models were used, but it was unclear whether obesity was driving altered immune responses, or whether it was diet related factors associated with feeding a high fat diet. Further experiments investigated mechanisms to provide evidence that obesity, and not diet, is driving the altered immune responses to influenza infection.
26
between the three groups prior to and after pH1N1 influenza infection. CD and HFD had significantly different lung metabolic profiles, with HFD having altered lipid metabolites prior to infection and post infection. This suggests that influenza infection alters the lung metabolome in obesity. LFD consistently had intermediate results between CD and HFD, so to confirm that obesity is driving these differences and not diet, a genetic model of obesity was used to compare findings with HFD.
As previously described, the leptin receptor knock out mouse, db/db, is severely obese due to hyperphagia. However, because leptin receptors are present on immune cells, this model is not appropriate for obese immune studies. Therefore, a mouse model of leptin receptor deficiency only in the hypothalamus was used. Heterozygous breeding between LepRH fl/fl and LepRH+/- mice resulted in homozygous LepRH-/- that lack leptin receptor signaling in the
hypothalamic neurons, leading to hyperphagia induced obesity [184]. These mice were fed CD, so their obesity was not induced by a high fat diet, but rather the same diet fed to lean, control mice. LepRH-/- mice gained significantly more weight than the LepRH fl/fl and LepRH+/- mice, and were more susceptible to pH1N1 influenza infection by increased mortality [183]. Viral titers between the three groups did not differ, however, LepRH-/- mice had significantly fewer
inflammatory cells in the BAL, but increased total protein indicating epithelial damage 8 days post infection [183]. Lung immune cell populations were enumerated with LepRH-/ mice having
27
obesity, not diet, impairs the immune response to influenza infection. Furthermore, the lung and urine metabolome of obese and lean influenza infected mice was different, suggesting that obesity and infection together alter the metabolism of the infected animals.
28
CHAPTER III: OBESITY IMPAIRS T CELL METABOLISM AND FUNCTION, WHICH IS NOT
CORRECTED BY WEIGHT LOSS
INTRODUCTION
The 2009 H1N1 influenza pandemic shed light on obese adults as a vulnerable population at risk for complications from infection with influenza. For the first time, obesity was recognized as an independent risk factor for increased morbidity and mortality to influenza infection [14]. This is concerning, as the rates of obesity have risen dramatically over the last several decades [1] and for many years, seasonal influenza infection and pneumonia have remained in the top ten leading causes of death in the United States [97, 98]. Currently, 36% of adults in the US and 10% of men and 14% of women worldwide are obese [2].
29
T cell metabolism is a dynamic process that changes to meet the energetic demands of the cell. As T cells become activated, metabolic demands switch from resting, naïve or memory T cells to effector T cells to fight infection [157]. Naïve T cells at rest utilize oxidative
phosphorylation for metabolic needs to maintain homeostasis and immune surveillance, but upon activation, switch to glycolysis and glutaminolysis for rapid biosynthetic precursors for growth, proliferation and effector functions [73]. The conversion of effector T cells to long lived memory T cells requires fatty acid oxidation to sustain function [161, 162]. Although we and others have demonstrated impaired T cell function in the context of obesity, we do not know if obesity will impair T cell metabolism, thereby altering T cell function.
Obesity results in systemic alterations in metabolism, including insulin resistance, elevated glucose levels, and altered adipokines (e.g. increased leptin, decreased adiponectin), leading to what has classically been termed “metabolic syndrome” [15, 187]. At the cellular level, metabolic syndrome has traditionally been associated with adipocyte, hepatocyte, muscle and pancreatic beta cell impairments, particularly with respect to glucose usage and fatty acid oxidation and storage. However, the effect of obesity on T cell metabolism has not been addressed. Because it is well-understood that T cell metabolism drives T cell function, we hypothesized that the altered metabolic environment of obesity would impair T cell metabolism, leading to memory T cell dysfunction.
30
Our results demonstrated that compared to always lean mice, always obese mice had impaired T cell memory subset generation, function and metabolism. Furthermore, we found that despite weight loss, memory T cell populations were decreased at re-infection, and effector CD8+ T cell functions were impaired at 3 days post infection. Of note, the timing of memory T cell generation appears to program the T cell metabolism with regard to the obese state. We found that the T cell metabolism of the weight loss group (formally obese) closely mirrored the
metabolism of the always obese group, and conversely, the T cell metabolism of the weight gain group (formally lean), closely paralleled the always lean group. These results suggest that memory T cell metabolism is “set” by the metabolic conditions present during their generation, and that changing their current environment (lean to obese or obese to lean) could not overcome this reprogramming.
Taken together, our findings suggest that T cell metabolism and function are impacted by the metabolic environment, both at the time of generation and at the time the memory cells are activated.
RESULTS
Development of a model to study the effects of weight loss and weight gain on memory T cells
31
well-established mouse model for both influenza infection and obesity studies [84, 86, 188]. Male 6-week old C57BL/6J mice were randomly assigned to 2 groups: lean and obese (Figure 1A). The lean group was placed on a standard chow diet (n=60) and the obese group was placed on 60% high fat diet (HFD; n=60) for 18 weeks. As expected, mice fed the 60% HFD gained significantly more weight than chow fed mice (Figure 1B).
Following 18 weeks on their respective diets, mice were infected with influenza X-31,an H3N2 influenza virus containing the external surface proteins of A/Aichi/2/68 and the internal proteins of H1N1 A/Puerto Rico/8/34 (PR8) [189]. Following the primary infection, mice were kept on their respective diets for 4 weeks, allowing T cell memory to develop while mice were either lean or obese. Following the 4 week period of memory development, half of the mice from each diet group were switched to the opposing diet. Thus, 30 lean mice were switched to HFD, and 30 lean mice remained on the chow diet. Similarly, for obese mice, half (30 mice) were switched to chow diet and half remained on the HFD. This created four groups of mice: 1) always lean; 2) weight gain; 3) always obese and 4) weight loss (Figure 1A). Mice were maintained on the indicated diets for 18 weeks. As shown in Figure 1B, obese mice switched to the chow diet (weight loss group) lost significant amounts of weight, and, compared with the always obese group, were now significantly separated by weight. Conversely, the lean mice switched to HFD gained significant amounts of weight, and were now significantly separated from the always lean group. Thus, the diet switch protocol induced both weight loss and weight gain in the mice.
In addition to body weight, obesity is often associated with hyperglycemia. As shown in Figure 1C, fasting serum glucose levels of always lean and weight loss groups were statistically lower than the always obese and weight gain groups. Thus, mice that lost weight developed a metabolic phenotype similar to the always lean mice, and mice that gained weight developed a metabolic phenotype similar to the always obese mice in terms of glycemia.
32
lavage (BAL) fluid (Fig S1C) did not differ among the diet groups. Weight gain, obese, and weight loss statistically decreased titers from day 3 to day 7 post infection, while the lean group did not decrease. This was not surprising, as we purposely chose the secondary PR8 dose to induce a milder secondary infection. Previous studies in our lab have induced a significant difference in lung pathology between lean and obese mice by increasing the viral load, but this also resulted in significant mortality in obese mice [170-172, 183].
Memory T cell populations were impaired despite weight loss.
Resolution of primary influenza infection results in ~90-95% of effector T cell death, with the remaining T cells acquiring a long-lived memory phenotype [190]. These long-lived memory T cells are a heterogeneous population, consisting of central memory T cells (TCM), effector memory T cells (TEM) [150, 191, 192], and tissue resident memory T cells (TRM) [193, 194]. All of these populations are important for prevention and recovery from infection. Circulating TCM and TEM differ by anatomical location: TCM are abundant in secondary lymphoid organs, whereas TEM are primarily found in peripheral tissues [150, 195, 196]. Following influenza infection, TRM reside for extended periods of time within the lung parenchyma and are critical for protection from influenza re-infection [151, 154, 197].
33
For CD4+ TRM cells, we found that, compared to always lean mice, always obese mice had significantly fewer CD4+ TRM in the lungs at day 3 post infection (Figure 2B,2C). Although the weight loss groups also had decreased numbers of TRM in the lung compared with the always lean group, this group was not significantly different from either always lean or always obese group. Influenza-specific CD4+ T cells were measured using a Class II influenza tetramer, and found day 3 post infection, compared with always lean mice, obese and weight loss groups had significantly fewer influenza-specific CD4+ T cells in their lungs (Figure 2D,E).
T regulatory cells (Tregs) are also important to reduce the inflammatory response once the infection has been cleared [198]. We found that, compared with always lean mice, at days 0 prior to infection, CD4+ Treg populations in weight gain, obese and weight loss were significantly reduced (Figure 2F). At day 3 post infection obese and weight loss remained significantly reduced compared to the always lean mice (Figure 3G). However, at day 7, compared with lean mice, Treg populations were significantly increased in the always obese group (Figure 1H, 1I).
Next, we examined CD8+ T cells subsets as they have different functions that CD4+ helper T cells. Although no differences were seen in CD8+ TEM populations among groups at any time, the weight loss group was the only group which did not have a significant increase in this population between day 3 and day 7 post infection (Figure 2J). For CD8+ TCM cells, at day 3 post infection, compared with always lean mice, the always obese mice had a significant decrease (Figure 2K,L). At day 3 post infection, CD8+ TRM cells, compared with always lean, were
34
Memory T cell populations generated in a lean state were impaired following weight gain.
Memory T cell populations were also impaired in the weight gain group. Although, compared with lean mice, numbers of CD4+ and CD8+ central and TEM cells from the weight gain mice did not differ at any time point, at day 3 post infection, there were fewer CD8+ T cells expressing IFNγ and granzyme B (Fig 2P). At day 7 post infection, compared with lean mice, there were fewer CD8 TRM in the lungs of the weight gain mice (Fig 2N). CD4+ Tregs, compared with lean mice, were also decreased in weight gain mice prior to infection (Fig 2F), but increased at day 7 (Fig 2H).
Metabolic phenotype at time of primary infection sets CD4+ and CD8+ T cell metabolism for subsequent infection, despite weight gain or weight loss.
Using extracellular flux analysis, the metabolism of CD4+ and CD8+ T cells isolated from spleens at day 0 (uninfected) (n=5) and day 7 post infection (n=5) was measured in all groups (n=40). For CD4+ T cells, prior to secondary infection (day 0), compared with always lean and weight gain mice, always obese mice had a higher oxygen consumption rate (OCR), a measure of oxidative phosphorylation (Fig 3A). This suggests that the basal OCR rate was set for the memory T cells at the time of primary infection, as there were no differences between the always lean and weight gain mice, which were lean when the memory T cells were generated.
This finding was even more pronounced following a secondary infection. At 7 days post infection, OCR was significantly lower in the always lean and weight gain mice compared with the always obese and weight loss mice (Fig 3B). The increase in OCR from day 0 to day 7 was highest in the weight loss group, which was obese at the time of primary infection, and in the always obese group (Fig 3C). The extracellular acidification rate (ECAR) was also determined, as a measurement of glycolytic activity (Supplementary 3A,B), and was used to calculate the
35
found that 7 days post secondary infection, compared to always lean and weight gain mice, the always obese and weight loss mice had significantly higher OCR:ECAR ratios. Thus, the
metabolism of the CD4+ T cells was set during the metabolic state of the primary infection, which was not corrected by weight loss. Furthermore, the memory CD4 T cells generated in the lean state maintained a lean, metabolic phenotype, despite the secondary infection occurring in the obese state (weight gain mice).
Similar impairments in metabolism were found for CD8+ T cells. Prior to secondary infection, OCR was not different among the groups (Fig 3E). However, following secondary infection, compared with the always lean mice, CD8+ T cells from the always obese mice and weight loss mice had significantly elevated OCR (Fig 3F). As for CD4+ T cells, this finding suggests that the metabolism of CD8+ T cells was set at the time the primary infection occurred, resulting in similar OCR levels between always lean and weight gain mice (formally lean) and between always obese and weight loss (formally obese) mice. Again, similar to the CD4+ T cells, the highest increases in OCR from day 0 to day 7 occurred in the always obese and weight loss mice (Fig 3G). OCR:ECAR ratio was also significantly higher in the always obese and weight loss mice compared with the always lean and weight gain mice (Fig 3H).
Spare respiratory capacity impaired by obesity
36
together and the always obese and weight loss (formerly obese) also tracked together,
suggesting that the metabolic environment at the time of primary infection sets the metabolism that remains during the secondary infection.
Glut1 expression on CD4+ and CD8+ effector memory T cells is altered in mice that were obese at any time
Glut1 is the dominant glucose transporter in T cells that traffics to the cell surface upon activation to increase glucose influx and glycolytic activity [199]. When naïve or memory cells are activated and transition to effector T cells, increased glycolysis occurs, which is supported by the upregulation of Glut1. At day 0 and day 7 post secondary infection, we measured Glut1
expression in spleen CD4+ and CD8+ effector T cells by flow cytometry. Prior to secondary infection (day 0), compared with always lean and always obese mice, Glut1 expression on CD4+ cells in the weight loss group were significantly decreased (Fig 4A). After infection, compared with always lean mice, Glut1 expression was decreased in always obese, weight gain and weight loss groups (Fig 4B). When comparing day 0 to day 7 post infection, there were no differences among groups (Fig 4C).
For CD8+ T cells, although there were no differences among groups at day 0 (Fig 4D), we found that, following infection, compared with always lean mice, both weight gain and weight loss groups had decreased Glut1 expression (Fig 4E). Interestingly, a significant reduction in Glut1 expression at day 7 compared with day 0 occurred in the always lean, always obese and weight gain groups. The weight loss group was not significantly different between these two time points.