EPIDEMIOLOGICAL ANALYSIS OF SOCIOSEXUAL HIV NETWORKS IN CENTRAL NORTH CAROLINA
Dana Kristine Pasquale
A dissertation submitted to the faculty at the University of North Carolina at Chapel Hill in partial fulfillment of the requirements for the degree of Doctor of Philosophy in the Department of
Epidemiology (Infectious Diseases) in the Gillings School of Global Public Health.
Chapel Hill 2018
© 2018
ABSTRACT
Dana Kristine Pasquale: Epidemiological Analysis of Sociosexual HIV Networks in Central North Carolina
(Under the direction of William C. Miller)
Disparities in HIV incidence are seen by race and sexual orientation,3-5 although race
and sexual orientation do not sufficiently explain differential risk within sexual networks. Race and sexual orientation, however, influence partner selection,8 risk behavior,9 and access to
care.10 Partner selection and risk behavior underlay differences in HIV acquisition and can be
studied within the context of a sociosexual network.11 Marginalized or stigmatized persons are
more likely to be diagnosed with HIV later in the course of infection12,13 and less likely to achieve
viral suppression,14,15 which both increase the amount of time that a person remains infectious.
Infectious persons who are active in a sexual network risk onward transmission of HIV, becoming superinfected, or acquiring another sexually-transmitted infection (STI) such as syphilis, which has a synergistic effect with HIV.16-19 Knowing the HIV prevalence within
high-risk sexual networks, HIV and STI history of network members, and partnership patterns may provide sufficient information to guide targeted interventions to reduce the amount of time that HIV-positive persons remain infectious.
PUBLIC HEALTH SIGNIFICANCE
Too few diagnosed HIV cases in the United States are in care and virally
suppressed,10,20 thereby increasing the likelihood of onward transmission. Identifying factors
For Marc
ACKNOWLEDGMENTS
The project described in Aim 1 was supported by the National Center for Advancing Translational Sciences (NCATS), NIH, through Grant Award Number UL1TR001111 (awarded to Ann M. Dennis, MD and Irene A. Doherty, PhD, MPH via the NC Translational and Clinical Sciences Institute at UNC). The project described in Aim 2 was supported by the National Institute of Allergy and Infectious Diseases (NIAID), NIH, through Grant Award Number 5T32AI070114-10 to UNC-Chapel Hill (awarded to Steven Meshnick, MD, PhD and Brian Pence, PhD). The content in Aims 1 and 2 is solely the responsibility of the investigators and does not necessarily represent the official views of the NIH.
I would like to thank Dr. Steven Meshnick and Dr. Brian Pence for their support of me through the T32 training grant, above and far beyond the financial support provided. Dr.
Meshnick and Dr. Pence met with me and other Trainees regularly to discuss progress, answer questions, and support our professional development. I have gained much from their ability to quickly identify the most important question. I would also like to thank the other Trainees, notably Sara Levintow and Jane Chen; the thought-provoking discussions during TIDE meetings certainly strengthened these analyses. Steve was also my preceptor through grant-writing, when many of these ideas were conceived.
As a student and prior to the T32, I was supported by grants NIH/NIAID R01 AI083059 and NIH/NIAID K08AI112432. I would like to thank the PIs of those studies: Dr. Bill Miller and Dr. Audrey Pettifor for MP3 and Dr. Ann Dennis for several studies beyond the study which supported the Aim 1 analyses. Bill, Ann, and Irene went on to serve on my committee.
the rest of the group. I returned to UNC as Irene’s research assistant prior to enrolling in the doctoral program. Irene taught me everything that I know about network analysis. Through this work, I was introduced to Bill and Peter who provide excellent balance for me. Both have the ability to instantly see the implications of an analysis (Peter’s “30,000 foot view”). The balance struck between Peter’s big ideas and Bill’s gentle focus guided me through this dissertation. Along the way, Bill introduced me to Ann, who took me on as a research assistant. I worked with Ann for years, during which time she taught me how to apply phylogenetic analysis in a variety of settings. Though I did not work with Kim outside the dissertation analyses, her thoughtful, thorough review of everything that I presented to her has made me a better
epidemiologist. Beyond the professional aspects of working with my committee, each member has also been an incredible source of support. Bill, especially, has been my advisor for the entirety of the PhD program. His calm guidance has shaped the program for me.
My family deserves recognition for their support as well. I must express gratitude to my parents, Deb and Joe, and my brother, Joseph, for their encouragement of all of my schooling, their help especially toward the end of this program, and their perspective conveyed through humor.
I will never be able to adequately express my thanks to my husband, Marc. Marc’s generous and unwavering support started with my decision to apply to the doctoral program and has been a constant in our life throughout. Marc inspires me to try to be better; I am grateful every day that he is my best friend, husband, and partner. Though this dissertation is dedicated to him, I would also like to acknowledge our daughter, Ellie, who has brought a joyful new dimension to my life. Through her, I finally, truly understand stochasticity.
Most of all, I would like to acknowledge the dedicated members of the North Carolina Division of Health and Human Services Communicable Disease Branch, the disease
TABLE OF CONTENTS
LIST OF TABLES ... xiv
LIST OF FIGURES ... xvi
LIST OF ABBREVIATIONS ... xviii
I. CHAPTER ONE: SPECIFIC AIMS... 1
II. CHAPTER TWO: BACKGROUND AND SIGNIFICANCE ... 4
A. Background ... 4
1. HIV Trends in the United States ... 4
2. HIV Transmission Dynamics in North Carolina ... 5
3. Individual Characteristics and Differential Risk ... 10
4. Population Mixing Patterns and Examination of Person-to-Person Linkages ... 12
5. Social and Sexual Network Analysis ... 15
6. HIV Sequence Analysis ... 17
7. Combining Sexual Network and HIV Sequence Analysis ... 20
B. Preliminary Studies ... 22
C. Conceptual Framework ... 24
D. Synopsis ... 26
III. CHAPTER THREE: DATA ... 27
A. Overview of Data Sources ... 27
B. Data Collection and Management ... 28
IV. CHAPTER FOUR: METHODS ... 31
A. Study Design ... 31
1. Source Population, Identification of Cases, and Identification of
Controls ... 33
2. Selection Criteria ... 34
3. Sample Size ... 35
C. Measurements and Assessments ... 36
1. Aims ... 36
2. Constructing the Sexual Network ... 40
3. Constructing the Phylogenetic Trees ... 42
D. Statistical Analyses ... 44
1. Aim 1 ... 44
2. Aim 2 ... 45
V. CHAPTER FIVE: LEVERAGING PHYLOGENETICS TO UNDERSTAND HIV TRANSMISSION AND PARTNER NOTIFICATION NETWORKS ... 47
A. Overview ... 47
1. Background ... 47
2. Methods ... 47
3. Results ... 47
4. Conclusions ... 48
B. Introduction ... 48
C. Methods ... 49
1. Study Setting and Design ... 49
2. Study Population ... 49
3. Sexual Network Construction ... 50
4. HIV-1 Sequences and Transmission Cluster Identification... 50
5. Statistical Analyses... 51
D. Results ... 52
2. Partner Notification Network ... 52
3. Transmission Clusters ... 53
4. Partner Notification Network and Transmission Cluster Overlap ... 55
E. Discussion ... 56
VI. CHAPTER SIX: MINING THE GAPS: LEVERAGING GENERALIZED ESTIMATING EQUATIONS TO UNDERSTAND HOW PHYLOGENETICS CAN COMPLEMENT CONTACT TRACING ... 69
A. Overview ... 69
1. Background ... 69
2. Methods ... 69
3. Results ... 69
4. Conclusions ... 70
B. Introduction ... 70
C. Methods ... 71
1. Parent Study... 71
2. Measures ... 72
3. Statistical Analyses... 74
D. Results ... 75
1. Study Population ... 75
2. Transmission Cluster and Network Overlap ... 75
3. Generalized Estimating Equations ... 76
E. Discussion ... 77
VII. CHAPTER SEVEN: PREDICTING INDICATORS OF ONGOING HIV TRANSMISSION RISK AFTER HIV DIAGNOSIS IN NORTH CAROLINA ... 85
A. Overview ... 85
1. Background ... 85
2. Methods ... 85
4. Conclusions ... 86
B. Introduction ... 86
C. Methods ... 87
1. Study Population, Setting, and Data ... 87
2. Study Design ... 88
3. Sociosexual Network Construction ... 89
4. Statistical Analyses... 89
D. Results ... 91
1. Study Population ... 91
2. Elicited Contacts and Baseline Sociosexual Network ... 92
3. Outcomes ... 94
4. Bivariable Analysis ... 94
5. Development of Multivariable Models ... 95
6. Predictive Capabilities of Multivariable Model ... 95
E. Discussion ... 96
VIII. CHAPTER EIGHT: CONCLUSIONS ... 108
A. Summary of Aims and Findings ... 108
1. Aim 1 ... 108
2. Aim 2 ... 109
B. Strengths ... 112
C. Limitations ... 114
D. Future Directions ... 116
1. Testable Interventions ... 116
2. Proposed Future Analyses ... 116
E. Public Health Implications ... 120
APPENDIX A: ADDITIONAL RESULTS RELATED TO AIM 1 ... 122
A. Results ... 122
APPENDIX B: ADDITIONAL METHODS, RESULTS, AND DISCUSSION RELATED TO AIM 2 ... 123
A. Methods ... 123
1. Statistical Analyses... 123
B. Results ... 123
1. Sociosexual Network ... 123
2. Transmission Cluster Involvement ... 124
3. Bivariable Analyses ... 124
4. Multivariable Analyses ... 125
C. Discussion ... 126
APPENDIX C: BACKROUND AND METHODS RELATED TO FUTURE ANALYSES ... 134
A. Exponential Random Graph Models ... 134
B. Spatial Analysis of Sexually Transmitted Infections ... 135
1. Phylogenetic Analysis Combined with Spatial or Geographic Analysis ... 136
C. Sexual Transmission of HIV ... 138
D. Intra-Host Viral Dynamics ... 140
1. Founder Strains ... 141
2. Drug Resistance Mutations ... 142
LIST OF TABLES
Table 1. Network terminology used in this paper. ...15 Table 2. HIV cases first diagnosed among residents of Region 6 age 14 years or
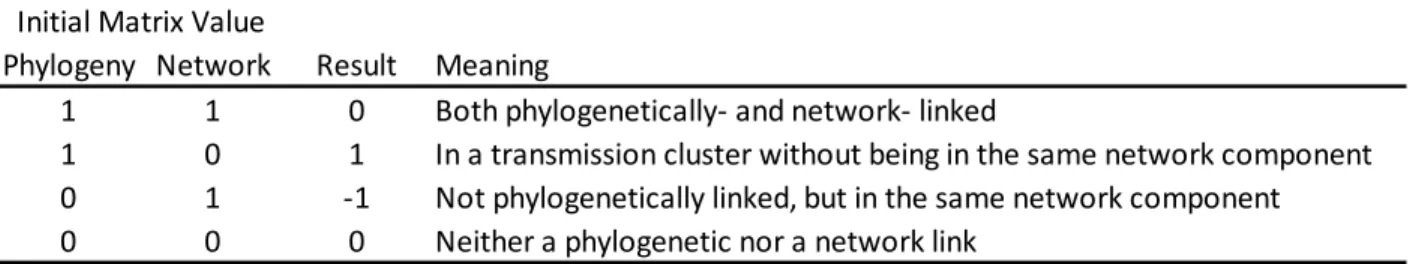
older, by county, 2012-2013. ...35 Table 3. Comparison of phylogeny and network connection NxN matrices
showing outcomes values for presence or absence of the type of tie represented
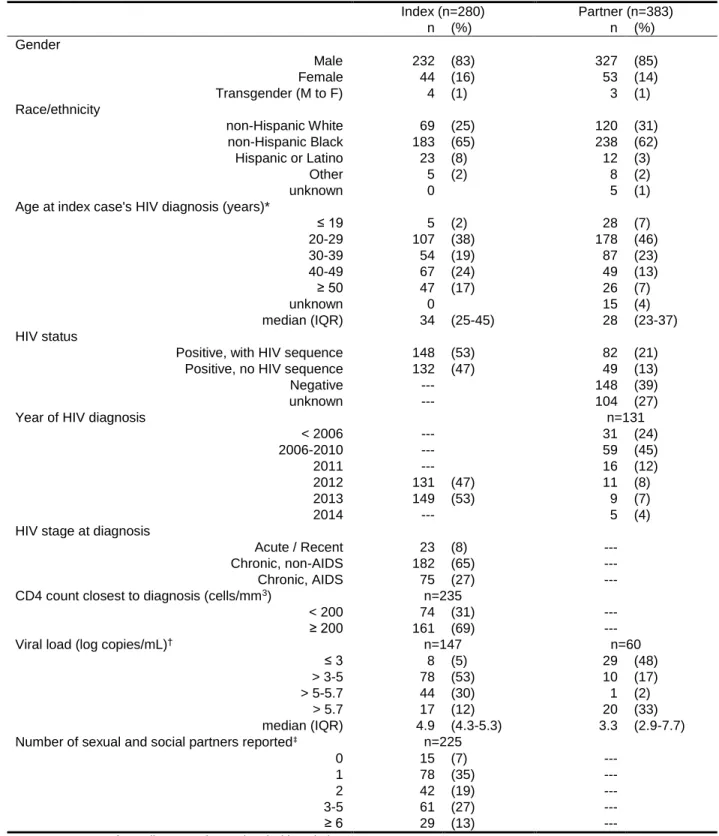
in each matrix...44 Table 4. Index cases diagnosed 2012-2013 in Wake County, NC and their
partners in the sociosexual network (N=663). ...61 Table 5. Partnerships reported by index cases with located members of the
sociosexual network (N=446). ...62 Table 6. Transmission clusters that included 5 or more persons statewide and at
least two members of the Wake County-based sexual network of adults
diagnosed with HIV during 2012-2013 and their contacts (n=235). ...63 Table 7. Description of index cases diagnosed 2012-2013 in the Wake County,
NC parent study and their partners in the sexual network (N=663) and a description of the substudy analysis set restricted on the basis of number of
study participants within each transmission cluster (N=87). ...83 Table 8. Bivariable and multivariable relationships in the GEE between
explanatory variables and the outcome of being in the same transmission cluster but not in the same sexual network component, by odds ratio (OR) and
confidence intervals (CI) (N=83 pairs unless otherwise indicated). ...84 Table 9. Index cases age 14 and older diagnosed 2012-2013 in NC HIV/STD
Control Region 6 and their first-degree contacts in the sociosexual network
(N=1,269). ...99 Table 10a. Dominant characteristics of sociosexual network components size 7
and smaller (n=248 isolates and n=201 components size 2–7), comprising 794
persons (54% total network). ... 100 Table 11. Bivariable and multivariable relationships between predictors and
post-diagnosis continued involvement in the sexual network among 569 persons first diagnosed with HIV during 2012-2013 in NC HIV/STD Control Region 6. Confidence intervals for adjusted odds ratios (aOR) from the multivariable models are bias-corrected from 1,000 bootstrapped samples made with
replacement. ... 101 Table 12a. Sensitivity and specificity of simple model score to predict
post-diagnosis involvement in the sexual network at selected risk score cut-offs, including false negative and false positive rates based upon observed 25% prevalence of continued involvement in the sexual network among a hypothetical
Table 13. Bivariable analyses for predictors not presented in the manuscript. The outcome is whether any cases were identified as an active member of the
sexual network in the 3 years following HIV diagnosis. ... 127 Table 14. Multivariable models not presented in the manuscript. Relationship
between predictors tested but not retained in the final models and the outcome of remaining active in the sociosexual network, showing odds ratio (OR), 95% confidence interval (CI) using robust standard errors, Akaike’s information criterion (AIC), and receiver operator characteristics area under the curve (AUC)
LIST OF FIGURES
Figure 1. Newly-diagnosed HIV cases by county of residence across North
Carolina, 20137 ... 9
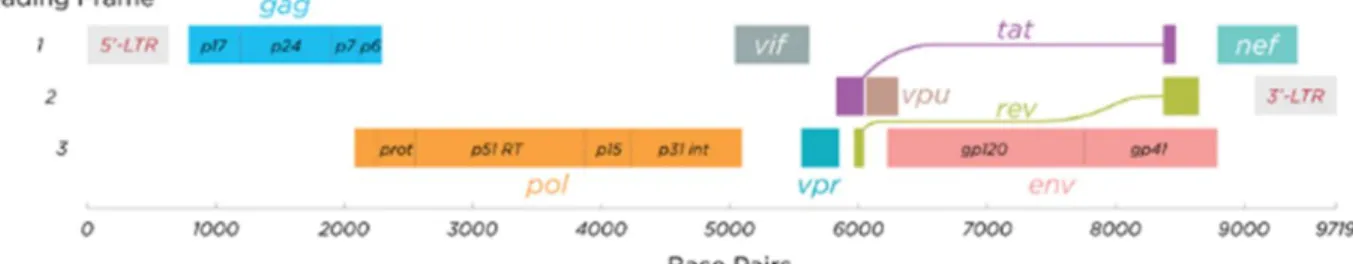
Figure 2. HIV genome showing position of genes.6 The polymerase (pol) gene
encodes drug resistance. ...17 Figure 3. Largest sociosexual network component from the Nexus study
(N=261). Graph shows gender/sexual orientation, HIV and syphilis status at the time of network construction, and the types of relationships between persons
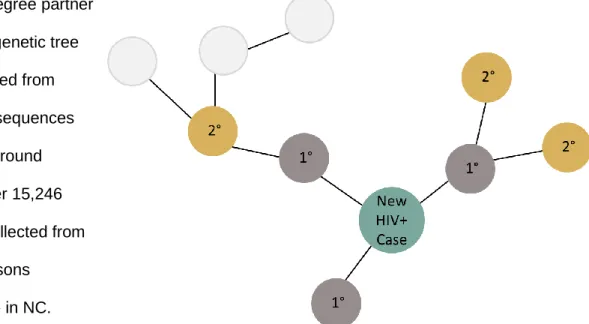
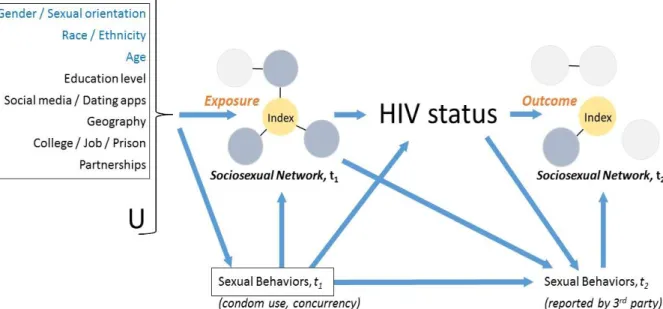
(sexual or social). ...23 Figure 4. Theoretical framework for factors related to HIV acquisition. ...25 Figure 5. Illustration of primary (1°) and secondary (2°) degree partners of an
index case in a sexual network component. ...31 Figure 6. Hypothesis for predictive model. Sexual behavior and partner-seeking
characteristics at the time of diagnosis are hypothesized to be predictive of
sexual behaviors and partner-seeking behaviors post-diagnosis. ...32 Figure 7. Eleven NC Communicable Disease Branch HIV/STD Planning and
Care Regions. Region 6 (green) comprises 11 contiguous counties and is the
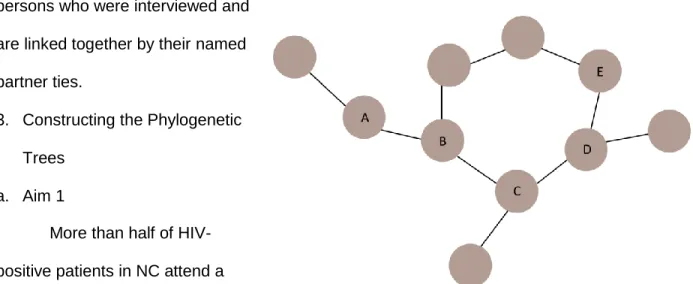
area under study. ...33 Figure 8. Estimated population size by aim. ...35 Figure 9. Illustration of a network component, which is a group of at least 2
persons linked together through defined ties. ...42 Figure 10. NC HIV Field Service Regions Prior to Office Redistribution. ...64 Figure 11. Sexual network showing phylogenetic cluster membership and
gender (A), and selected sexual network components showing cluster members
and genetic distance statewide (B) ...65 Figure 12. Phylogenetic tree of HIV pol gene sequences showing transmission
clusters. ...67 Figure 13. Flow chart of inclusion into the analysis dataset (N=87 in 83 dyadic
pairs), starting from the parent study Wake County network (N=663, 62%
HIV-positive (n=411)). ...81 Figure 14. Illustration of possible missing relationships (dotted lines) if the “gold
standard” transmission cluster shows persons who are not linked in the sexual network. The person, C, who is disconnected in the contact tracing-based sexual network could have (1) been a partner to A, (2) been a partner to B, or (3) been
Figure 16. Depiction of indicators of remaining active in the sociosexual network
following HIV diagnosis used to calculate outcomes. ... 105 Figure 17. Sociosexual network showing 569 index cases newly diagnosed with
HIV in the area around Raleigh, NC during 2012-2013. Total graph includes
1,470 persons distributed in 468 network components. ... 106 Figure 18. Receiver operator characteristics (ROC) curves showing area under
the curve for the network and simple predictive multivariable models among a population of 569 persons newly-diagnosed with HIV in the area around Raleigh, NC. Cases prospectively followed for 3 years to determine continued activity in
the sexual network. ... 107 Figure 19. Mechanisms for appearing as one of the 248 isolated cases in the
sociosexual network. ... 110 Figure 20. Calibration plots for Simple (top) and Network (bottom) models. ... 111 Figure 21. Frequency of model scores for Simple (top) and Network (bottom)
models. ... 112 Figure 22. Sociosexual network component comprising 92 people, showing
bridging of investigated HIV partnerships by investigated syphilis partnerships... 113 Figure 23. Depiction of artificial shrinking of components by administrative
boundaries. Index cases in other areas that are not investigated do not contribute partnership information to the network, even if they are network
members. ... 114 Figure 24. ROC curves for predictive models constructed after splitting the group
of 569 indexes by whether or not the index chose to be interviewed and disclose
partners (n=423, 74%) or not (n=141, 26%). ... 132 Figure 25. Log node degree of persons in network compared to the log average
LIST OF ABBREVIATIONS
AA Amino acid
AHI Acute HIV infection
AIDS Acquired immune deficiency syndrome ART Antiretroviral therapy
ARV Antiretroviral
AUC Area under the curve
AZT Azidothymidine (Zidovudine) CDC Centers for Disease Control
CTRS Counseling, testing, and referral services DIS Disease Intervention Specialist
DRM Drug resistance mutation
ERGM Exponential random graph model EVC Eigenvector centrality score GEE Generalized estimating equation GI Gastrointestinal
GIS Geographic information system GUD Genital ulcer disease
HIV Human immunodeficiency virus HSV Herpes simplex virus
ID Infectious disease IDU Intravenous drug use(r) INI Integrase inhibitor
MCMC Markov chain Monte Carlo MSM Men who have sex with men
MSW Men who have sex with women
NC North Carolina
NC EDSS North Carolina Electronic Disease Surveillance System NIH National Institute of Health
NNRTI Non-nucleoside reverse transcriptase inhibitor NRTI Nucleoside reverse transcriptase inhibitor PI Protease inhibitor
PLWHA People living with HIV or AIDS PEP Post-exposure prophylaxis PrEP Pre-exposure prophylaxis
R6 North Carolina HIV/STD Control Region 6 ROC Receiver operator characteristics
RWB Random walk betweenness SAS Statistical Analysis Software® SNA Social network analysis STD Sexually transmitted disease STI Sexually transmitted infection TC Transmission cluster
TDRM Transmitted drug resistance mutation UNC University of North Carolina at Chapel Hill
US United States
I. CHAPTER ONE: SPECIFIC AIMS
Despite intervention, HIV continues to spread in NC, particularly among young Black men.21,22 HIV prevention requires timely identification of infected persons, intervening to stop
onward transmission, identification of persons at high risk of acquiring the disease, and
intervening to prevent acquisition. Identifying persons at highest risk requires consideration of the people and the environment since assessing HIV risk based solely upon individual
behaviors and attributes fails to place persons in context.
HIV acquisition risk is a product of behavior and HIV prevalence in a person’s sexual network.23,24 HIV transmission in a population is a complex process, involving individual-level
factors (personal risk behaviors, STI co-infection16); partnership-, or dyad-,level factors (sexual
practices during the act, HIV serodiscordance, condom use), and network-level factors (HIV prevalence in the sexual network,24 behavior regarding partnership length, and concurrent
partnerships25). Thus, analysis of local sexual networks is crucial to reduce HIV transmission.
However, this must include assessment of the data gaps and limitations.
In North Carolina (NC), persons newly diagnosed with HIV are interviewed to elicit partners, creating a robust source of individual, partner, and behavioral data. Due to the comprehensive interviews conducted by Disease Intervention Specialists (DIS) at the time of diagnosis in NC, individual-level and partnership-level data are available for each person interviewed. A sexual network can be constructed based upon the name-based partnership data elicited by DIS for partner tracing and testing. Network-level covariates can be calculated for each person in the sexual network once the network is constructed.
allowing us to make inter-group comparisons without excluding persons who may unexpectedly be involved in transmission. Combining sexual network and phylogenetic analyses provided a more complete picture of transmission. The aims are steps to support the stated purpose of intervening to disrupt transmission.
Knowing network structure, partner selection habits, and place-associated traits could provide a more accurate estimation of HIV acquisition risk to inform pre-exposure prophylaxis (PrEP) program targets. Combining partnership data with phylogenetic analysis from an
epidemiological perspective is novel and has real-world application. The study will improve use of surveillance data, particularly through its exploration of limitations, with the intention of translating this research into both clinical and public health practice. Specifically, we:
Aim 1: Compare phylogenetic links and named partner ties in a small, defined geographic area.
Overview: We compared phylogenetic links and named partner ties in a small, defined
geographic area. The purpose was to identify the limitations of contact tracing, so that the gaps in the sexual network could be identified. The sexual network is the basis for some public health HIV prevention efforts. We constructed a sexual network from HIV cases diagnosed 2012-2013 in Wake County, NC and their partners. Transmission clusters were constructed from HIV pol gene sequences. Available HIV sequences were analyzed to determine whether there was co-occurrence of named partner ties and phylogenetic ties. Generalized estimating equations (GEE) compared gene sequence linkages and sexual network ties to identify contact tracing gaps.
Hypothesis 1.1: Phylogenetic analysis will identify gaps in contact tracing, including
characteristics of persons newly diagnosed whose risk is not well-represented by interview and partner elicitation.
Aim 2: Determine which individual- and network-level traits predict future HIV outcomes for persons who are part of sexual networks with circulating HIV in central NC.
Overview: The primary purpose of this study is the Aim 2 analysis, which is to analyze whether certain individual-level characteristics or behaviors, partnership-level attributes, or network-level structures were associated with being named as a case or a partner in future transmission in our high-risk sexual network components. We constructed a sexual network from HIV cases diagnosed 2013 in central NC and their partners. We included partnership data from 2012-2013 syphilis investigations involving these persons in the same geographic area to increase network completeness. HIV index cases were followed through 2016 to determine continued involvement in the sexual network, defined as being identified as a partner on future cases or being diagnosed with a STI 6 or more months after HIV diagnosis.
Predictors included individual- and dyad-level characteristics routinely collected during DIS interviews so that the derived risk score can easily be applied during DIS interview. The predictive model was constructed so that DIS may note any factors elicited during the primary interview that may lead to the long-term (3-year) outcome. Highlighting opportunities for DIS to identify patients who would benefit from enhanced support to link to care may lead to fewer cases of onward transmission if patients with higher transmission risk potential are engaged in care and achieve viral suppression. This model has the potential to effectively disrupt
transmission in NC if new cases are averted. Unlike other areas of the United States (US) where HIV transmission can be disproportionately attributed to acutely-infected persons26 or
those unaware of their infection,27 HIV transmission in NC tends to involve persons who are
chronically infected and aware of their own status.28
II. CHAPTER TWO: BACKGROUND AND SIGNIFICANCE A. Background
1. HIV Trends in the United States
HIV rates and acquisition risk differ by race, age, geographic region, and behavioral risk factor. In 2014, 44% of new HIV infections were diagnosed among Black persons, despite only comprising 12% of the population.29 Though the rate of new diagnoses has declined in Black
persons since 2010, the rate of new HIV diagnoses in 2015 was 2.7 times the rate of new diagnoses amongst Hispanics and Latinos, the racial/ethnic group with the next highest rate, and 8 times higher than the rate amongst Whites (per 100,000 population, rates were 44.3 for Black persons, 16.4 for Hispanic/Latino, and 5.5 for White).30 From 2006-2009, HIV incidence
increased by 48% among young African American men in the US.5
Sexual transmission is responsible for most new cases of HIV in the US.30 In the US,
men who have sex with men (MSM) are at a higher risk of acquiring HIV than men of the same race who have sex with women.4,29 Among MSM, most diagnoses are made in the younger age
groups (20-29 years);5,31 women with heterosexually-acquired HIV tend to be diagnosed slightly
later (25-34 years).30
Geographically, the rates of incident HIV diagnoses are much higher in the US Northeast and South than the West and the Midwest. Further comparison of the higher rates US
Northeast and the US South yields racial differences; in both places, 75% of people living with AIDS were either Black or Hispanic, although Hispanics accounted for a smaller percentage in the US South than in the Northeast.32
persons living in a certain area of San Francisco between 1985 and 2007. The spatial analysis was able to separate core and outbreak areas.34 HIV-positive persons resided closer to their
partners in Colorado Springs than at risk persons who are not HIV-positive and their partners.35
During a syphilis outbreak in Baltimore, two areas were identified as core areas from which the outbreak spread and a new core area was created. Even after the outbreak ended, density of cases remained higher in all 3 core areas.36
2. HIV Transmission Dynamics in North Carolina a. Epidemiology
The South has the highest rate of new HIV infections in the US30 and the highest number
of adult and adolescent persons living with HIV or AIDS (PLWHA).32,37 North Carolina (NC) had
the 10th highest rate of new HIV infections in the U.S. in 2015.30 There were 1,345 new HIV
diagnoses in NC in 2015, with the overwhelming majority due to sexual transmission.22 In NC,
generally more than one-quarter of persons diagnosed with HIV are concurrently diagnosed with AIDS.38 NC has already met 90-90-90 goal for diagnosis; it is estimated that 10% of
HIV-infected individuals in NC are unaware of their status.39
Approximately 70-80% of non-pediatric HIV cases diagnosed in NC each year are among men. Being MSM is the most significant HIV acquisition risk factor for men in NC. In 2015, 747 of the 1,078 (69%) non-pediatric HIV cases diagnosed among men had male sexual partners noted as a risk factor.22 Among all young men in NC, the major risk factor is being
MSM.4,38
higher than the rate among Hispanic/Latino persons (18.7 per 100,000 population) and 8.5 times higher than the rate among White persons (5.5 per 100,000 population).22
The highest rates of AIDS diagnoses were also made among Black persons, including both concurrent diagnoses and progression from HIV.38 The rate of non-pediatric AIDS
diagnoses was 40.3 per 100,000 population for Black men and 17.9 per 100,000 Black women in NC in 2012. For comparison, the rates among White men and women were 4.2 and 2.7 per 100,000 adult/adolescent population, respectively.22
b. Social Factors
A previous study of HIV diagnoses in NC identified an epidemic among college students, particularly young Black men.40 The investigators reviewed HIV records for newly diagnosed
men age 18-30 from 69 of 100 counties in NC in years 2000-2003 and found 735 new
diagnoses, of which 84 (11.4%) were college students. Only 3.6% of the college men reported having sex with women only in the 12 months prior to diagnosis, compared to 29.5% of the non-college men. 33.3% of the non-college men reported having sex with both men and women, as did 11.7% of the non-college men.40 When compared to men who were not enrolled in a college or
university, college men were significantly more likely to go to bars and clubs, meet partners in bars and clubs, use ecstasy, and use the internet to meet partners. However, the men in
college were significantly less likely to have partners with known HIV infection, exchange sex for drugs or money, use crack-cocaine, or have a history of incarceration. The men in college were significantly more likely to be African American and significantly less likely to be Latino. The HIV incidence rate among African American college students increased dramatically during the study period, from 15 per 100,000 persons to 79 per 100,000 persons.40
Having college students as sexual partners, along with having anonymous or internet partners, is associated with being coinfected with HIV and syphilis in NC.41 Despite the
broad demographic categories do not adequately describe the epidemic. Methods that discern trends on a smaller scale are necessary to understand where and why transmission continues to occur.
A second study of young men in NC increased the study period of the first study through 2004 and added behavioral data collected by voluntary counseling and testing centers with the purpose of constructing the sexual network. The network was based on a total of 1013
available records of incident HIV diagnoses made among men age 18-30 that were deemed to have sufficient partner information for the 12 month period prior to diagnosis (279 records were unavailable and excluded). MSM/W (n=161) were compared with MSM (n=573); being MSM/W was significantly associated with having more than 10 partners in the 12 month period prior to diagnosis and being enrolled in college. MSM/W were also more likely to be central in the sexual network, although the investigators do not specify whether they are using betweenness or degree centrality, the latter of which is synonymous with number of partners. They do report, however, that MSM/W bridged several network components,42 a finding that has been
demonstrated elsewhere.43
Several outbreaks of HIV and sexually-transmitted infections (STIs) in NC have been investigated in different populations throughout the state, highlighting the importance of studying the sexual networks (see section II.5. for an explanation of sociosexual network analysis and structures). Counties with fluctuating syphilis incidence or incidence only rising toward the end of the study period had visibly different network structures.44 All counties were found to be
assortative with respect to race/ethnicity. Non-outbreak counties were found to be more assortative with respect to number of partners (degree), largely because persons in non-outbreak counties tended to form smaller monogamous dyads.45
endemic in NC with epidemic outbreaks that can be seen in the sexual networks. Sexual networks in counties in rural southern/southeastern NC with epidemic syphilis were more densely connected than in counties with fluctuating incidence. The counties with the highest incidence had distinct features of the sexual network, including more closed loops and larger, more connected components overall.
NC has one of the fastest-growing Latino populations in the US.47 US- and foreign-born
Latinos in NC have distinct HIV risk factors. US-born Latinos report more lifetime sexual partners and males are more likely to report engaging in sexual activity with another man. Foreign-born Latinos in NC are more likely to report exchange sex and are more likely to speak only Spanish or report low acculturation.48 This likely contributes to why foreign-born Latinos in
NC are more likely than US-born Latinos to present to care with advanced disease;48
HIV-infected Latinos in NC are predominantly immigrants and are more likely to present to HIV care later than Black or White patients.12 Males in each racial/ethnic group are more likely to present
later to care than women in the same group, with a similar proportion of female Latinas presenting late as White men.12 Phylogenetic analysis of sequences collected from a clinical
cohort showed that Latinos were more likely to be in linked pairs but less likely to be in clusters when compared to White and Black men.49 This may be due to foreign-born patients acquiring
infection prior to arriving in NC; US-born Latinos were more likely to integrate in MSM clusters. c. Geography
rural.50 The rural-urban divide has been noted for other STIs in NC. Drug susceptible HIV
strains were significantly more genetically similar than drug resistant strains for rural-rural and rural-urban partnerships, but not for urban-urban partnerships. Urbanicity of residence was not associated with TDRM v. drug susceptible virus among persons with acute HIV infection.51
Geographically-associated network cores have been found to significantly contribute to STI spread,50,52 but it is unknown whether the same relationship is found with drug resistant HIV,
particularly in rural areas.
Geographic and spatial investigation of HIV and STI outbreaks in NC has yielded important information. The CDC found that NC had the highest burden of HIV in non-urban areas in 2006.4 Figure 1, from the 2013 HIV/STD NC Epidemiologic Profile report, shows
incident and prevalent HIV cases across the state. The largest clusters are in the most urban areas, but the rural eastern part of the state has a high burden of HIV without having as many specialists and providers as the central part of the state.
Spatiotemporal analysis was applied to identify core clusters of gonorrhea and syphilis in NC, with an additional assessment of rurality. All of the syphilis and gonorrhea core areas included at least one urban area, and all of the syphilis core areas (N=10) overlapped with gonorrhea core areas (N=20).50 Similarly, in Wake County, a single urban county in central NC,
chlamydia, gonorrhea, primary and secondary syphilis, and HIV were found to cluster with a single identifiable core area; all four core areas overlapped.53 These studies show that in NC,
there is geographic overlap of several STIs. Without added analysis of the sexual networks, it is unknown whether the STIs are circulating among different groups.
As HIV is more easily transmitted in the presence of certain STIs, future areas of research should include both network and geographic or spatial analysis. Sexual transmission of HIV is likely to occur along racial and geographic lines, as partnerships tend to be assortative with respect to race.9,25,49,54 Examining partnership patterns and geographic differences, and
variation between populations that tend to form discrete sexual network components with little overlap, may provide new avenues for intervention.
3. Individual Characteristics and Differential Risk
Despite many targeted interventions, incidence continues to rise among young Black MSM. There are many levels of reasons to account for this. Higher level sexual network structure variables include HIV prevalence and network density. A particularly high risk network comprised largely of Black MSM in NC was found to have a HIV prevalence of 29%,21 so people
partners,9 which is an example of a compelling dyad-level factor that was measured at an
individual-level.
To continue with the use of Black MSM as an example, some network-level factors are important in aggregate, such as network prevalence or proportion of anonymous partners because both cascade to the more focused levels. However, it does not serve the individual people to look at consistency of condom use within a network if the individual consistently uses (or does not use) condoms, as his risk is mediated by his own behavior. Number of partners is similarly most often attributed to a person, but is clearly modified by his extended network: someone with one partner is at great risk if his partner has many other partners. The converse is true as well, where someone with many partners isn’t substantially increasing his own risk if each of his partners has no others. In some way and barring an active infection with an
ulcerative STI, number of partners should not be a separate variable from percent condom use if both variables are aggregated to an individual observation, as it is plausible that there would then be multiplicative modification within the individual-level observation.
HIV trends by group are invaluable to assess risk, but there is more nuance in risk as traits such as race or age do not perfectly correlate. Agent-based approaches have long been eschewed because they are time- and resource-intensive, although recent adoption of
electronic medical records and more flexible databases has made it easier to obtain partner information and the HIV sequences performed at entry into care. Sociometric networks permit complete construction of a case, including his or her partners, and an iterative gathering of their partners.11 With the complete network, demographic data, and behavioral data, we can start
with complete cases in order to assess risk by network-level, dyad-level, and individual-level characteristics, particularly if we categorize by HIV infection status (chronically, recently, or not).
transmitted/founder strain,55 it stands to reason that someone who is acutely infected with drug
resistant HIV would be more likely to then pass that strain along while the resistant strain is still predominant. In support of this, MSM in Europe have significantly higher TDRM prevalence than other groups.56
Although Black MSM have disproportionately high risk of acquiring both drug susceptible and drug resistant HIV, we believe there is merit in using all cases in this geographic area. First, other groups are at risk, even if that risk is smaller. Second, studying the similarities and differences between risk groups may provide insight to the cause of the higher risk, as there were comparison groups. Third, we were able to see if there is overlap in or bridging among the network components by race and risk group. Fourth and finally, networks are often incomplete due to the high number of anonymous partners and undiagnosed cases, both of which warrant as much investigation as possible. Interview of other racial, ethnic, and gender groups may be able to describe inter-racial partnerships which would be unknown due to the inability to
interview persons missing from the network, particularly since Black MSM are less likely to get diagnosed than other groups.
4. Population Mixing Patterns and Examination of Person-to-Person Linkages
Several years ago, a rash of studies claimed that obesity and behaviors such as smoking are ‘contagious’.57-60 The idea of behavioral contagion is that people tend to cluster
with others who practice similar behaviors and also influence the behaviors of their peers, which can be to the detriment of the entire group when the behavior is associated with greater risk of disease.61 Assortativity in risk behaviors such as substance use combined with sexual activity,62
Modeling studies have found that the largest epidemics result from an assortative core group with high rates of partner change that links disassortatively to peripheral groups.63-65 The
STI spreads rapidly within the core group that practices similar risky behaviors, such as rapid partner change. Sexual mixing between core and peripheral groups that do not tend to practice the same risky behaviors then leads to a wider-spreading infection that becomes an
epidemic.63,64,66 There is a tendency to select sexual partners of similar age, race, education
level, and demographics,45,54,57,62,67 which could also lead to an increase in circulating infection
within a core high-risk group.66,68 Such assortativity was observed in a syphilis epidemic in
southeastern NC. Non-outbreak counties were found to have high rates of assortativity with respect to number of partners, while outbreak counties were more likely to be disassortative.45
Substantial disassortative partnerships have been observed in some cases, and linked to
bridging populations for infection transmission.45,69,70 Dis-assortativity in number of partners was
observed in central NC among women trading sex for crack-cocaine (unpublished, PI: Irene Doherty, PhD). This sustained the local syphilis epidemic among heterosexuals, where a few females had many male partners.
Networks of people are unique because ties between individuals can form on the basis of extra-actor features of social processes.71 Actors can form ties with someone new because
that person is already connected to someone with whom he or she is connected (transitivity). 71-73 Special classes of models are required to parse the effects of actor traits and extra-actor
processes and study the linkages between persons in a social or sexual network.72,74,75 If all of
the actors share a trait then the new connection could incorrectly be attributed to homophily rather than the underlying influence of the social network itself.76
Inherent difficulties in the study of sexual behavior and HIV include a difference in timing of infection and diagnosis, which can lag for years; more heavily affected hard-to-find
diagnosis is often used as a measure of behavior at the time of infection77,78 and an individual’s
behavior is often treated as fixed (until diagnosis or declining health).79 However, these
simplifying assumptions may obscure vital information. A prospective cohort study found that individual behavior does fluctuate, even within short periods of time.80 Several modeling studies
have shown that variable individual behavior affects outbreak size81 and observed rates of
transmission by HIV stage.81-84 Zhang, et al. (2013)85 modeled changing periods of high- and
low-risk behavior. They found that not only were individuals more likely to be infected during high-risk periods but that they were also more likely to transmit as the period of high risk did not end abruptly with infection. Additionally, many studies simplify by using more broad
demographic groups or geographic regions which may mask the specifics of the person-to-person interactions leading to transmission – examination at a finer scale has the potential to reveal mixing patterns important to transmission; for instance, local TDRM trends are distinct even from regional trends.86
We used reportable disease data combined with surveillance data to examine the network of individual partnerships. Sexually transmitted infections allow analysis of
transmission and behaviors that is not possible with other types of diseases. As opposed to other infectious diseases, which can infect anyone, sexually transmitted infections only infect the sexually active population87 and are not transmitted through casual contact. Thus, with
enough information about partnerships, one can construct transmission chains of the virus through the population. Molecular techniques allow us to differentiate between acute/recent infections and chronic infections. Categorizing based upon recency of infection permits analysis of behaviors prior to infection. Comparing recently infected, uninfected, and chronically infected persons will demonstrate differences in behaviors and allow identification of practices
risk-taking behavior immediately preceding infection.79 It is the time prior to infection which is
related to risk of acquiring HIV, and it is unknown whether the behaviors and partnerships of individuals who are HIV-uninfected but at risk differ from those who are HIV-negative and not at risk or chronically infected persons.
Social network analysis (SNA) and phylogenetic analysis are two relatively new fields which permit post hoc study of person-to-person linkages. SNA can quantify likeness among partner selection88 in terms of risk or demographic characteristics, which is an analytical
approach to population mixing scaled down to the level of the individual. Phylogenetic analysis shows likeness of infection and can identify clusters of acute transmission. Both allow us to link individuals in the sexual transmission of HIV.
5. Social and Sexual Network Analysis Social network
analysis (SNA) is a method that permits examination of
relationships (dyad-level) and individual-level characteristics.23,89,90 A social network is
comprised of all individuals participating in the social system under study.91 A pair of linked
persons is a dyad. The network is grouped into components, which are clusters of linked individuals.89,90 The “network” is the entire set of components (Table 1 includes network
terminology used in this document). A sexual network is a specific type of social network in which linked individuals are grouped into components based upon having self-reported sexual relationships during the time period under study.11 Network analysis includes a visual
representation of the individuals (nodes) and their linkages (edges) to each other. Network summary measures are often descriptive, and include various measures of a node’s centrality in the network, the number of edges per node (degree), and the proportion of possible connections that are made (density).89,90
Object Being Described Network Analysis Term
Person in the network Node, actor, individual
Partnership between persons Edge, link, linkage, tie
Group of linked persons Component, Network component
Once the network is drawn and components (a group of linked persons) are identified, the combination of characteristics of individuals in high-risk network components can be
compared to individuals in other components to determine the self-sorting factors that influence risk in the local epidemic. Disparities in risk of sexual acquisition of HIV continue to exist in part because social and sexual networks tend to be positively assortative, which means that
connections are more frequently made between individuals of like age, race, educational status, and behaviors, including number of sexual partners.11,45,54,62,92 This encourages transmission
within a like group of people. While it is not unusual to see groups of demographically-similar persons linked together,93 racial mixing has increased in some areas.94 Additionally, some
groups which may appear to be a homogeneous group are not: a study of Latinos in NC found that foreign-born Latinos and US-born Latinos had different risk factors.48 These studies
demonstrate that it is a mistake to oversimplify and focus on risk by demographic group alone. The combination of factors contributing to HIV risk is complex and distinctions such as race, age, and sex are often too coarse to gain an understanding of the epidemic.49
Interventions based upon coarse or crude distinctions are limited and may be missing individual-level factors leading to transmission. Sexual network analysis permits examination of local and individual-level characteristics.23 Examining network structure and the characteristics in a
network component provides insight into the dynamics influencing risk at a much finer scale.44,95
Previous studies employing sexual networking methods in NC have found distinct sexual networks with limited interaction between the networks and different circulating STIs,40,42,44,96
suggesting that HIV drug resistance mutations may also be distinct by network component. The most-studied networks in NC are young, Black MSM; older individuals trading sex for crack-cocaine; and rural, White individuals. Partner selection tends to be assortative,11,45,92 and
communities also tend to exhibit homophily over diversity.97
the formation of other relationships. This is an endogenous process, where the existing structure of the network supports the formation of another tie. Assortativity of race or another attribute is an exogenous process, where people tend to form relationships based upon shared characteristics. Closed triangles are often seen in MSM sexual networks, though not in
heterosexual networks. As noted above, assortativity does play a role in partner selection. Certain network structures, such as k-cores (a closed loop where each person in the loop has at least k edges) and closed triangles have been shown to influence disease transmission in modeling studies, particularly if concurrency is present.
6. HIV Sequence Analysis
The plasma pol region of the HIV genome (Figure 2) is variable and encodes drug resistance mutations.99 Knowing the infection phenotype is valuable for clinical care decisions,
as it conveys which combination of ARV drugs would be most effective for the patient. Thus, obtaining this information is now standard care in most of the US.100 In NC, blood samples are
routinely collected at entry into care for drug resistance testing to determine whether the patient’s virus has encoded drug resistance.
The pol gene sequences collected during drug resistance testing can also be used to identify transmission clusters of persons with genetically similar virus and assess transmission chains, which has public health utility. The potential to link infections through phylogenetics may help link to101 or identify anonymous individuals in the network who aren’t identified by
during partner notification.
Acute/recent infections are more likely to be identified in clusters defined by short genetic distances because less time has elapsed between transmission and sampling, so there is less genetic divergence.102 Coalescent models were used to demonstrate that some of the
excess clustering of sequences obtained during acute infection is due to this and not solely excess transmission during acute infection. A study of publicly available pol sequences (n=84,527) representing 141 countries was undertaken with the intent to build a “global transmission network” by looking for similarities worldwide.103 Interestingly, the investigators
found an inverse relationship between the number of linked sequences and the amount of drug resistance mutations (DRM) encoded in the sequences, demonstrating that we do not have a clear picture yet of how drug resistance circulates in populations because it appears as though having a lot of transmission is associated with having less risk drug resistance. An alternate explanation, however, not presented by the investigators is that groups with more DRM are those who have more access to ARV which explains both the lower transmission and the higher circulating DRM.
a. HIV transmission cluster analysis applied to population-based research
A recent investigation of an increase in acute HIV diagnoses in the area around
Charlotte, NC and in Western NC was unable to phylogenetically link all of the acute cases with the infections acquired from either chronically-infected individuals in a single cluster, or from anonymous partners who could not be located for testing.104 However, sexual networks were
constructed, with two distinct groups noted. Although both locations are nearby, they are geographically distinct and differ by rurality. In the metropolitan area around Charlotte, young Black MSM accounted for most of the diagnoses while older white MSM accounted for most of the diagnoses in rural Western NC. No significant overlap between the two groups was found using partner trace back or HIV sequence analysis, so the increase in acute diagnoses was likely due to better case finding and diagnosis rather than an outbreak of acute HIV.
partner finding was not very successful for these cases as each case must have had at least 1 recent HIV-positive partner to be acutely infected.
A study of 1671 HIV-positive persons enrolled at two spatially-near, university-based HIV clinical cohorts in NC was able to link 557 of the patients, the largest cluster including 36
patients.49 Clustering was largely seen along racial lines, although not by ethnicity as Latinos
were significantly less likely to cluster than non-Latinos. There were MSM and heterosexual clusters, although there were mixed clusters as well. 49 Phylogenetic analysis is a powerful tool
for examining transmission patterns and delineating trends, although the likelihood of finding clusters can be reduced if time has passed between samples102 or one of the patients has been
exposed to ART. The ability to construct a large network of individuals using partner data obtained via interview supplements the linkages identified using phylogenetic analysis. b. Limitations
Due to the limitations of HIV sequence analysis, phylogenetic data alone is not as powerful as the combination of phylogenetic and partnership data. First, neither first-degree partnerships nor directionality can be inferred from HIV sequence analysis. Second, observed cluster size may not represent actual transmission if there is a high proportion of missing data, which can occur at any of the first steps along the HIV care cascade. Third, cluster size is affected by cluster definition; if percent difference is used then cluster size changes with the cut-off selected. Fourth, sequences obtained for clinical care are a consensus sequence, where the sequence returned represents the most frequent base pair observed at any position after
7. Combining Sexual Network and HIV Sequence Analysis
Sexual network analysis and HIV sequence analysis examine the relationships between individuals which account for HIV acquisition risk. The network constructed from DIS interviews can be compared to the phylogenetic tree. In a previous study of sexual networks in NC, 50% of partners were anonymous, as defined by inability of the State to locate the individual for testing due to lack of identifying information,96 and the addition of gene sequences to the
network may help identify that persons are directly or indirectly linked in a transmission chain even without having disclosed partner information. The distribution of branching points for each terminal node in the phylogenetic tree can yield the underlying network structure, which may provide a clearer picture of transmission in NC, as the tree topology is not hindered by anonymous contacts or encumbered by contacts that do not result in virus transmission.105
Additionally, adding phylogenetic data to network data may clarify temporal trends in
transmission, which are not always clear with the network contact data alone. The network data complements the phylogenetic data because it is not always clear in a tree how the
transmission events occurred from partner to partner.106
Previous studies have only found little to moderate overlap between contact data and phylogenetic trees constructed from sequences,101,107 but the analysis described here is
improved because it used all reported cases in a geographic area rather than a sample, interview questions about partner contact dates were targeted based upon the stage of
infection, and sequences are now routinely collected at entry into care. Using all cases provides a complete picture of sexual transmission of HIV in this geographic area, allows assessment of homophily and bridging in network component, and allows comparisons of risk between groups without confounding by spatial or geographic parameters.
a. Sexual Network Analysis and Spatial or Geographic Analysis
person, shigellosis (and cholera) in Matlab, Bangladesh from 1983-2003 was found to cluster in space more so than among kinship networks. This is particularly true for sexual networks, which form within a context that includes geography, place, and culture.11 Geographic
locations can include bars or clubs where people meet partners11 and important partner-finding
venues can be identified through network analysis.108 In NC, universities are known to play a
central role in STI transmission networks.
Spatial analysis permits assessment of distance between partners which can be influenced by many factors. People who meet partners on the internet may not have a strong association with any physical locations, in which case geographic place data would be less helpful. The distances people travel to meet partners may also be influenced by societal or contextual factors. NC is largely a rural state with a few urban centers. Persons living in more rural areas may travel different distances than people living in urban areas. People seeking anonymous encounters may travel greater distances to ensure anonymity.
Applying both SNA and geographic analysis to groups of people at-risk for HIV in Colorado Springs, Colorado demonstrated that spatial relationships varied by social
relationship. Examinations of the types of relationships showed that HIV-positive persons and their sexual partners had a significantly smaller distance between residences than prostitutes and their paying partners. Amongst persons who were connected via sexual contact or injection drug use, injection drug users resided closer to their IDU partners (mean distance 4.0 km) than individuals who were only linked to each other through sexual activity (mean distance 6.0 km). However, persons who engaged in sexual activity and injection drug use together had an even smaller mean distance of 3.2 km. Overall, the at-risk persons were more closely related by residence than would be expected compared to the entire population of Colorado Springs.35
data have the power to enrich sexual network analysis. Spatial data may be a better fit with network data than geographic data, however. In addition to being more suited for models and being interpretable on continuous scales, spatial data are a good fit with network data as both require functions to account for clustering.
B. Preliminary Studies
A previous study by co-investigator Dr. Irene Doherty, “The nexus of drugs, sex
networks, HIV, and syphilis in young African American MSM” (hereafter called ‘Nexus’)
constructed a sexual network using new HIV and syphilis diagnoses made among Black men age 15-30 in the areas around Winston-Salem and Raleigh, NC. Nexus abstracted both sexual partners and at-risk social contacts for the study. We abstracted 1,100 cases and 3,438
contacts (both social and sexual) from name-based reportable disease records and used to construct sexual networks. Dr. Doherty and Ms. Pasquale successfully linked the 4,538 cases and contacts by name to create 508 network components, the largest of which comprises 1,403 individuals (30.9% of the total population). Overall, the network was primarily composed of disjoint components; 90.4% of the nodes could not reach each other.96
All 3,438 partners were used to construct the network; of the 3,438 partners, 2080 (60.5%) were unknown because they could not be located for the interview or refused testing.96
Despite the high proportion of anonymous partners, enough data were present to construct the network, which included several large components. The largest component in Region 3 centered on young Black MSM was comprised of 261 cases and contacts (Figure 3), many of whom were in college. Positive assortativity was present; distinct and discrete network components were seen: 1) one network involved young, Black MSM infected with HIV and syphilis and 2) another network comprised older individuals engaging in transactional sex and mainly infected with syphilis.96 Nexus demonstrated that in a limited geographic area during a
abstracting all HIV diagnoses during the region under study from 2012-2013 to compare self-sorted network components by factors such as age, race, education, and risk behavior.
A newer study (“Integrating HIV Phylogenetics and Sexual Networks to Inform HIV
Prevention”: co-PIs Dr. Ann Dennis and Dr. Irene Doherty; hereafter called
‘Phylogenetics/Networks’), combined data for HIV cases diagnosed in Wake County, NC in 2012 and 2013 with clinical cohort and phylogenetic data to identify HIV clusters and the study the overlap between reported partners and transmission clusters (TC). Sexual network
components included all persons linked together based upon named partner ties. TC were defined as being phylogenetically linked based upon short branch lengths and high bootstrap values. The sexual network was constructed using 280 index cases and 422 locatable sexual and social contacts; the final network included 663 unique persons as some of the partners were named by multiple index cases or were index cases themselves. HIV-positive persons
(N=411) were probabilistically matched using date of birth and gender to a dataset of 15,247 background pol gene sequences obtained from persons in care in NC; 230 (56.0%) of 411 matched to a sequence. The sexual network components only partially overlapped the
phylogenetic clusters, demonstrating the utility of adding phylogenetic information to the network (see Chapter 5). One hundred and seventy-one persons were in a TC with at least one other sequence in the background dataset. Eighty-seven persons were in a TC with at least one other person in the study. Overall, only 42 of 87 (48%) persons in the study were in a TC with at least one other person in the cluster. This could possibly be due to poor recall, transmission prior to the DIS interview period of interest, or having anonymous partnerships with a person that could not be identified and located. However, persons in named-tie heterosexual partnerships were always in the same study TC when both persons had a genetic sequence available; this was not the case for MSM partnerships. Phylogenetics/Networks is the parent study for Aim 1 of this study and demonstrated the feasibility of the larger present study. The co-PIs of the Phylogenetics/Networks project were collaborators for this study.
C. Conceptual Framework
This is one of the first studies to link HIV behavioral and phylogenetic data to examine HIV trends by creating a comprehensive sexual network using all cases in a defined and diverse geographic area over a span of several years. Using all cases reported in a geographic area during a defined time period permitted analysis of the complete observed network, thereby allowing a comparison of distinct network components and independent analysis of people as they sort themselves by demographic and risk category.
Sexual network studies tend to simplify by focusing on a subset of patients and treating the connections between people in the network as if they have arisen from spontaneous or wholly exogenous processes, although in reality, partnership formation is not random.69,110 We
Figure 4 depicts the levels of factors which we believe affect a person’s risk of HIV acquisition or transmission. Network structure indicators, such as density of ties or the clustering coefficient, affect
how likely someone who enters the network is to become a part of a cluster. Network-level characteristics also include HIV prevalence. This is the top level of effects which we will study; network-level characteristics such as assortativity or prevalence influence partner-level
characteristics via partner selection.45,54,62,69 Partner- (or dyad-) level characteristics include
frequency and types of contact along with likeness of demographics and risk behaviors between nodes. Partner-level characteristics influence individual-level characteristics,61 which include
everything unique to the person, including his demographic traits and STI status. The amalgamation of these levels affect each person’s HIV status.
We tested a new method to better identify persons at risk in this study. First, we used all cases, allowing us to compare persons in the network. Second, combining networks and the phylogenetic tree may have more utility in identifying clusters than the sexual network due alone to the high proportion of unknown individuals in the network. Finally, using surveillance data to follow cases and partners forward in time allowed us to look specifically at our population to determine which factors increase potential for being involved in future disease transmission as an HIV-positive person continuing to engage in high-risk partnerships. We identified a set of traits at diagnosis which are predictive of onward transmission at a later time point, providing valuable information in shaping how we follow persons who are first introduced into the network.
D. Synopsis
Incident HIV ultimately results from interactions between discordant individuals. This study combined sexual network analysis and phylogenetic analysis to examine the person-to-person interactions that result in HIV transmission. Variation in human behavior and its effect on HIV requires more complex models and a deeper understanding of human interaction. HIV transmission risk, either acquired or onward, is associated with partner selection,8,9
III. CHAPTER THREE: DATA A. Overview of Data Sources
HIV testing in NC is confidential and name-based, and HIV is a reportable disease by mandate in North Carolina. The state has a well-defined network of disease intervention
specialists (DIS), employed by the State or county, who conduct interviews, perform counseling, and attempt to trace the partners of all located cases when a positive diagnosis of HIV or
syphilis disease is received by the state. DIS interviews with new cases elicit testing history, prior history of STIs, risk factors, demographic information, employment and incarceration history, and information about partners in the 12 months prior to diagnosis. As testing for HIV in North Carolina is name-based, sexual networks of cases and partners can be constructed from the DIS case reports.
Aim 1 used a network of Wake County residents with new diagnoses made in 2012-2013 and their partners to compare the overlap of phylogenetic transmission clusters and sexual network ties based upon DIS interviews.
The network constructed for Aim 2 used all HIV cases, syphilis cases, and located partners of each diagnosed during 2012-2013 in NC HIV/STD Control Region 6 (R6) [Figure 7], which includes 11 contiguous counties. A sociosexual network is a depiction of partnerships where people are connected to their disclosed sexual partners and high-risk social contacts. As such, the network includes singletons (persons not connected to anyone else) and components (a set of persons who are connected through partnership ties).
year period (2012-2013); individuals linked in the network diagram only needed to be linked once during the period under study to appear together. The network was constructed based upon DIS interview, so a person with a new HIV diagnosis will only be able to identify the partners that s/he had up until that point. Any other linkages made required being named by a future partner who was diagnosed during the study period. As such, the network was
undirected, which means that a linkage was made if any actor identified any other actor as a contact during the study period. Where available, temporal data including dates of contact, date of diagnosis, and date of infection were incorporated, but the data were still considered cross-sectional for analysis. All persons in the network were followed for 3 years (1,095 days) after the date of diagnosis for future linkages and changes in STI status.
The network structure itself was analyzed for density and clustering. Actors in the network were described along with their network components so that key traits related to risk of ongoing HIV acquisition could be identified and assessed. Sexual network components were categorized according to the prevalent demographic and risk characteristics of the actors in the component. Actor involvement in network structures of interest, including triangles and k-cores were collected and used as model predictors.
Samples are collected for drug resistance testing during clinical care to evaluate for transmitted or acquired drug resistance. Resistance mutations are reported back to the medical provider to guide clinical decisions, although the sequence can be used to construct putative transmission clusters based upon gene sequence similarity. This study linked cases in the network with those phenotypic and phylogenetic clinical data.
B. Data Collection and Management
There are two main data sources for this study. First, the majority of data were abstracted from the electronic HIV database maintained by the State of North Carolina