Is Exposure to Macondo Oil Reflected in the
Otolith Chemistry of Marsh-Resident Fish?
Paola C. López-Duarte1*, F. Joel Fodrie2, Olaf P. Jensen3, Andrew Whitehead4, Fernando Galvez5, Benjamin Dubansky6, Kenneth W. Able1
1 Rutgers University Marine Field Station, Department of Marine and Coastal Sciences, Rutgers, The State
University of New Jersey, Tuckerton, New Jersey, United States of America, 2 Institute of Marine Sciences & Department of Marine Sciences, University of North Carolina at Chapel Hill, Morehead City, North Carolina, United States of America, 3 Department of Marine and Coastal Sciences, Rutgers, The State University of New Jersey, New Brunswick, New Jersey, United States of America, 4 Environmental Toxicology Department, University of California Davis, Davis, California, United States of America, 5 Department of Biological Sciences, Louisiana State University, Baton Rouge, Louisiana, United States of America,
6 Department of Biological Sciences, University of North Texas, Denton, Texas, United States of America
Abstract
Genomic and physiological responses in Gulf killifish (Fundulus grandis) in the northern Gulf of Mexico have confirmed oil exposure of resident marsh fish following the Macondo blowout in 2010. Using these same fish, we evaluated otolith microchemistry as a method for assessing oil exposure history. Laser-ablation inductively-coupled-plasma mass spec-trometry was used to analyze the chemical composition of sagittal otoliths to assess whether a trace metal signature could be detected in the otoliths ofF.grandiscollected from a Macondo-oil impacted site in 2010, post-spill relative to pre-spill, as well as versus fish from areas not impacted by the spill. We found no evidence of increased concentrations of two elements associated with oil contamination (nickel and vanadium) inF.grandisotoliths regardless of Macondo oil exposure history. One potential explanation for this is that Macondo oil is relatively depleted of those metals compared to other crude oils globally. During and after the spill, however, elevated levels of barium, lead, and to a lesser degree, copper were detected in killifish otoliths at the oil-impacted collection site in coastal Louisi-ana. This may reflect oil contact or other environmental perturbations that occurred concom-itant with oiling. For example, increases in barium in otoliths from oil-exposed fish followed (temporally) freshwater diversions in Louisiana in 2010. This implicates (but does not con-clusively demonstrate) freshwater diversions from the Mississippi River (with previously recorded higher concentrations of lead and copper), designed to halt the ingress of oil, as a mechanism for elevated elemental uptake in otoliths of Louisiana marsh fishes. These results highlight the potentially complex and indirect effects of the Macondo oil spill and human responses to it on Gulf of Mexico ecosystems, and emphasize the need to consider the multiple stressors acting simultaneously on inshore fish communities.
a11111
OPEN ACCESS
Citation:López-Duarte PC, Fodrie FJ, Jensen OP, Whitehead A, Galvez F, Dubansky B, et al. (2016) Is Exposure to Macondo Oil Reflected in the Otolith Chemistry of Marsh-Resident Fish? PLoS ONE 11(9): e0162699. doi:10.1371/journal.pone.0162699
Editor:Heather M. Patterson, Department of Agriculture and Water Resources, AUSTRALIA
Received:January 15, 2016
Accepted:August 26, 2016
Published:September 28, 2016
Copyright:© 2016 López-Duarte et al. This is an open access article distributed under the terms of the
Creative Commons Attribution License, which permits unrestricted use, distribution, and reproduction in any medium, provided the original author and source are credited.
Data Availability Statement:Data are publicly available through the Gulf of Mexico Research Initiative Information & Data Cooperative (GRIIDC) at
https://data.gulfresearchinitiative.org(doi:10.7266/ N7NP22CQ).
Introduction
The Gulf of Mexico (GOM) is a highly dynamic and productive ecosystem that supports recrea-tional and commercial fishing, tourism, as well as significant oil and gas exploration and
extrac-tion industries (~600 million barrels per year) [1,2]. On April 20, 2010, the explosion of the
Deepwater Horizon drilling rig precipitated the 84-day release of an estimated 4.5 million barrels
of Louisiana crude oil into the Gulf of Mexico [3]. Although the release of oil at great depth
impacted deep sea ecosystems [4–6], surface oil also reached the coastline by May, 2010, and
ulti-mately grounded along 25% of the beach and saltmarsh shorelines surveyed in Gulf states [7].
Louisiana coastal wetlands are inextricably linked to the health of GOM fisheries [8–10].
Therefore, there has been considerable interest in describing organismal [11–15] and
popula-tion-level responses [16,17] of saltmarsh-associated nekton to oil pollution throughout the
northern GOM. The Gulf killifish (Fundulus grandis) has served as a valuable model species to
assess oil-spill impacts.Fundulusspp. are numerically dominant marsh residents [17], serve as
an important trophic link in estuarine food webs [18], exhibit considerable site fidelity [19,20],
and perform well in laboratory trials without demonstrating handling artifacts on fitness [21].
Fundulus grandishas been a focal species in post-spill impact assessments, but studies report mismatched outcomes. Negative impacts of oiling are consistently documented at the organismal level as revealed through genomic, physiological, and developmental responses
[11–15], while population-level impacts have not been detected [16,17]. A recent review by
Fodrie et al. [22] highlighted the value of testing for sublethal effects of oil toxicity on fishes
such asF.grandisas a way of reconciling this apparent divergence in organismal and
popula-tion-level studies. Sublethal effects could either result in lagged effects at the population level (thus not yet registering in population surveys), or perhaps affect vital rates that simply do not have strong ties to individual or population-level fitness. Six years post-spill, however, it is diffi-cult to collect fish and know to what degree individuals encountered oil during 2010, and there-fore what expectation should exist regarding the potential for oil-related sublethal effects among those fish (e.g., reduced growth).
One tool for potentially recovering the oil-exposure history of individual fish relies on examination of the chemical composition of otoliths. Otoliths, “ear stones” of calcium carbon-ate loccarbon-ated in the inner ear of teleost fish, grow in daily increments around a central core. As the otolith grows, trace elements from the environment are continuously incorporated into successive rings in a manner that reflects the environmental conditions experienced by that
individual [23]. For instance, salinity and temperature regimes experienced by fish are often
reflected in the concentrations of strontium (Sr) and/or barium (Ba) [24–27].
Previous research in experimental mesocosms demonstrated that crude oil constituents, including magnesium (Mg), chromium (Cr), and Sr, were accumulated in juvenile flatfish– likely through both food intake and via exchange across the gills and then incorporated into
the otoliths [28]. Nickel (Ni) and vanadium (V), also oil constituents [29], have been detected
in otoliths and used as a fingerprint for the magnitude and duration of oil contact by
inverte-brates [30,31] and fishes [32]. Macondo oil has several constituents, including Mg, V, Mn, Fe,
Co, Ni, Cu, Ba, and Pb, which occur at varying concentrations relative to oils from other
sources [33,34]. Indeed, oil constituents vary significantly depending on the source of the oil
[29], and therefore the suite of chemical markers used to identify oil contact may be unique to
each spill (sensu [35]). Despite the promise of this approach, to date, there is only one
pub-lished study that has evaluated otolith-based markers for detecting oil contact in GOM fishes
following the Macondo spill [36]. In that study,F.grandiswere collected from northern GOM
coastal marshes in 2012–2013 at sites that were either oiled in 2010 by the Macondo Spill based
on Shoreline Cleanup and Assessment Technique (SCAT) surveys [7] or near an active oil
FG). FJF was supported by a Gulf Research Program Fellowship. The funders had no role in study design, data collection and analysis, decision to publish, or preparation of the manuscript.
refinery. The results of that study indicate that there was no evidence of oil exposure in the oto-liths of fish at oil-impacted sites 2–3 years after the spill.
To rigorously evaluate whether signatures of Macondo oil appear in the otoliths of fishesin
situ, a positive control is needed, in which other independent markers have confirmed oil
expo-sure for individual fishes. Throughout 2010, including before, during, and after the Macondo
spill, Whitehead et al. [11] collectedF.grandisfrom marsh systems in Louisiana, Mississippi,
and Alabama in a Before-After-Control-Impact (BACI) design. At an oiled site,F.grandis
exhibited a pattern of altered genome-wide gene expression in liver tissues that was indicative of
exposure to oil. Within the gills ofF.grandisexposed to oil, cytochrome CYP1A protein, a
widely used biomarker of exposure to polycyclic aromatic hydrocarbons (PAH) [37–39], was
elevated, correlating with the upregulation of associated genes coincident with the timing and arrival of oil to the northern GOM. These molecular responses were diagnostic of oil exposure
[40] and were not consistent with other environmental variables such as salinity or temperature.
Following this study, Dubansky et al. [13] evaluated multiple tissues from these fish from 2010
and additional sampling in 2011 from Louisiana. Again, genome-wide gene expression, this time in gills, and CYP1A protein in gill, liver, intestine, and kidney tissues were indicative of exposure to contaminating oil. Furthermore, exposure of developing embryos to sediments col-lected from sites in Louisiana caused similar molecular responses and induced developmental abnormalities that were consistent with well-known effects caused by PAHs. From these studies, we have clear evidence that these fish were exposed and responded to the toxic components of oil from the Deepwater Horizon Oil Spill (DHOS) via complex biochemical responses. These exposures persisted for more than a year following initial oiling, suggesting that fish from
Loui-siana marshes were exposed chronically to weathered oil [13]. Using these same oil-exposed fish
[11], our primary objective was to determine whether trace metal signatures associated with the
Macondo spill could be detected at elevated concentrations in the otoliths ofF.grandis. This is
essential proof-of-concept data to demonstrate the applicability of this approach across a diver-sity of inshore and offshore taxa of concern in the northern GOM. Additionally, we evaluated the chemical composition of the same otoliths to more broadly determine if other environmen-tal perturbations in the GOM may have affected otolith elemenenvironmen-tal composition.
Materials and Methods
Ethics Statement
The fish used in this study were euthanized by severing the spinal cord. The protocol was approved by the Institutional Animal Care and Use Committee (IACUC) at Louisiana State University (Protocol Number: 10–098). Saltwater Scientific Collecting permits were provided by the LA Department of Wildlife.
Fish Collections
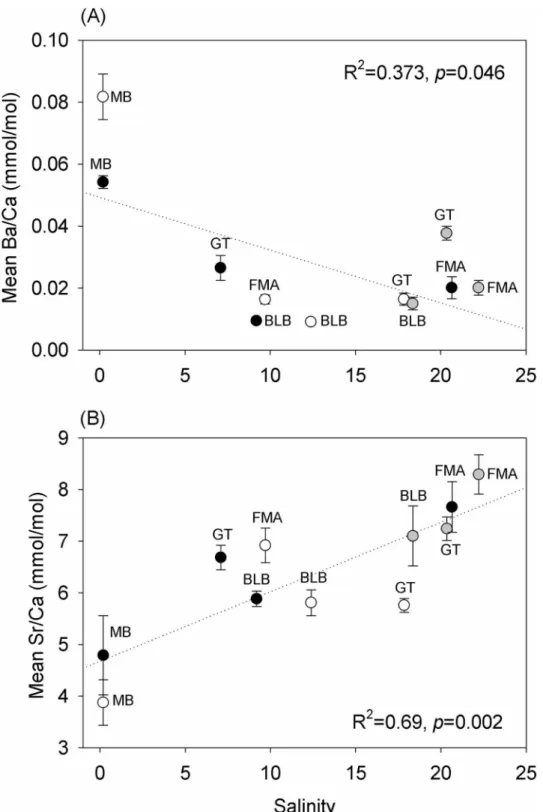
We employed a BACI design to evaluate any changes in the chemical composition of otoliths
associated with the Macondo spill. Male and femaleFundulus grandiswere collected, as
reported in Whitehead et al. [11], using wire mesh traps placed along marsh edges in Grande
Terre, Louisiana (GT); Bayou La Batre, Alabama (BLB); Mobile Bay, Alabama (MB); and Fort
Morgan, Alabama (FMA) (Table 1,Fig 1). Whitehead et al. [11] dissected tissue samples from
male fishin situfor morphological analysis and immunohistochemical analysis of CYP1A
pro-tein expression in gills, genome expression in the liver, and analytical chemistry (total PAHs).
The remaining carcasses (57–99 mm total length,Table 1) were stored at -20°C until use for
otolith microchemistry analysis (Table 1). Analytical chemistry of tissue samples was not
directly exposed to Macondo oil and showed divergent genomic and physiologic responses
coincident with, and diagnostic of, oil exposure [11,13].
FMA and GT are barrier islands and experience similar salinity regimes (>20). MB, on the
other hand, experiences low salinities year-round (<10). BLB falls in the middle of this salinity
continuum (~10–20). Fish from our four study sites were collected on May 1–9, 2010 (n = 6) before oil reached the coastline (pre-oil samples), on June 28–30, 2010 (n = 6) immediately fol-lowing the peak of oil landfall in mid-June (peak-oil samples), and two months later on August
30-September 1, 2010 (post-oil samples, n = 6) (Table 1). No fish were collected in MB during
the post-oil sampling event.
Environmental Data
Trace elemental uptake is often influenced by both temperature and salinity. Therefore, the environmental conditions experienced by the fish in this study were evaluated. Mean values for monthly temperature and salinity in April-August, 2010 (i.e., the period most relevant for our collections), were obtained from USGS and NOAA meteorological stations in the vicinity of
each sampling site (seeTable 1). Reporting monthly means for both salinity and temperature is
appropriate for otolith microchemistry studies because otoliths integrate environmental infor-mation over longer periods of time. For gene expression and many aspects of physiology with
short-term responses [41], records of daily salinity at the time the fish were collected were
appropriate and were reported in Whitehead et al. [11]. To characterize oil contamination
(total PAHs), surface water samples were collected during the three sampling efforts at all sites after the grounding of oil, and sediment samples were collected within a month of the last
sam-pling effort [11]. Analytical chemistry of surface water samples was not sensitive for detecting
oil pollution during pre-, peak, and post-oil sampling efforts, but high PAH levels in sediments
were detected at GT following oiling [11]. Of the field sites, only GT was directly oiled, which
occurred after the first sampling time point (May 09, 2010) and prior to the second sampling time point (June 28, 2010). This was confirmed by satellite imagery, visual observation,
biologi-cal responses, and sediment chemistry as reported in Whitehead et al. [11].
Otolith Preparation
Frozen fish samples were transported to the Rutgers University Marine Field Station (IACUC Protocol No. 88–042), Tuckerton, NJ, where otoliths were dissected and prepared for
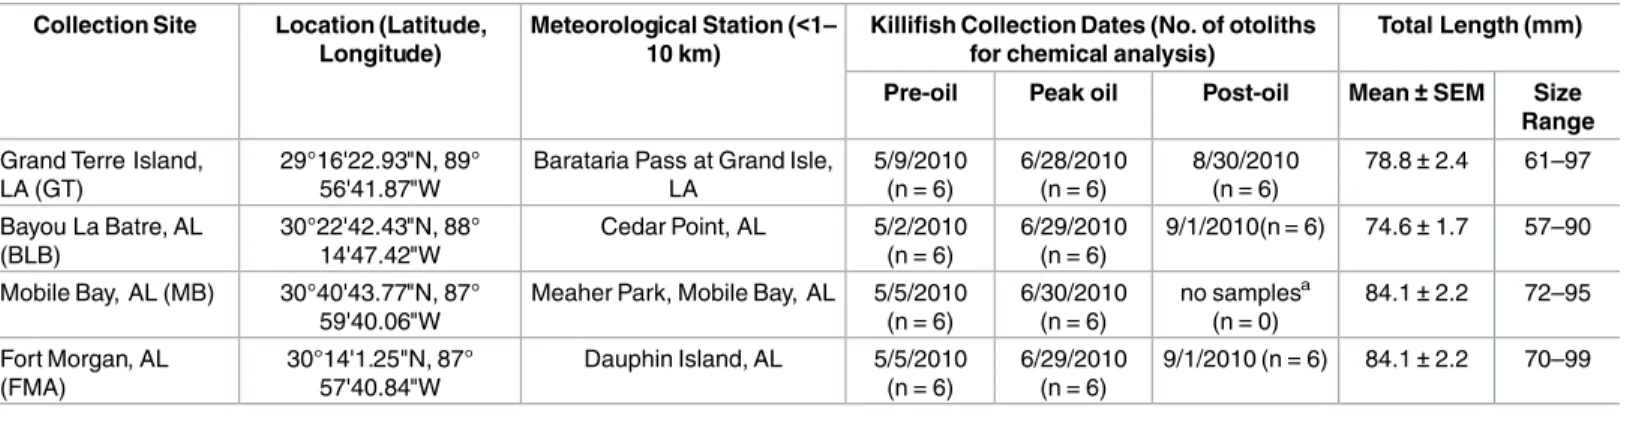
Table 1. Gulf killifish (Fundulus grandis) collection sites, coordinates, meteorological stations (for temperature and salinity records), and sam-pling dates during 2010.
Collection Site Location (Latitude, Longitude)
Meteorological Station (<1– 10 km)
Killifish Collection Dates (No. of otoliths for chemical analysis)
Total Length (mm)
Pre-oil Peak oil Post-oil Mean±SEM Size
Range
Grand Terre Island, LA (GT)
29°16'22.93"N, 89° 56'41.87"W
Barataria Pass at Grand Isle, LA
5/9/2010 (n = 6)
6/28/2010 (n = 6)
8/30/2010 (n = 6)
78.8±2.4 61–97
Bayou La Batre, AL (BLB)
30°22'42.43"N, 88° 14'47.42"W
Cedar Point, AL 5/2/2010 (n = 6)
6/29/2010 (n = 6)
9/1/2010(n = 6) 74.6±1.7 57–90
Mobile Bay, AL (MB) 30°40'43.77"N, 87° 59'40.06"W
Meaher Park, Mobile Bay, AL 5/5/2010 (n = 6)
6/30/2010 (n = 6)
no samplesa
(n = 0)
84.1±2.2 72–95
Fort Morgan, AL (FMA)
30°14'1.25"N, 87° 57'40.84"W
Dauphin Island, AL 5/5/2010 (n = 6)
6/29/2010 (n = 6)
9/1/2010 (n = 6) 84.1±2.2 70–99
aThere are no post-oil samples from MB as the last fish collected at this site are from June (peak-oil).
Fig 1. Map of study sites in the northern Gulf of Mexico. General (inset) and specific location of Gulf killifish (Fundulus grandis) collection sites in Grande Terre [GT], LA; Bayou La Batre, AL [BLB]; Mobile Bay, AL [MB]; and Fort Morgan, AL [FMA], throughout 2010 (May-August). The point labeled DwH indicates the site of the Deepwater Horizon explosion on April 20, 2010. The closest meteorological stations to the fish collection sites are marked by Xs.
microchemical analysis. All supplies used to handle the otoliths were washed in 10% nitric acid (Optima). Both pairs of sagittal otoliths were extracted using teflon tip forceps. Visible tissue was cleaned by gently rubbing the otoliths against a wet Kim Wipe (wet with MilliQ water, Ultrapure) to remove attached organics. Right sagittal otoliths were soaked in MilliQ water for 5 minutes. Water was removed and a 200-μl solution of buffered (0.05 N NaOH) hydrogen
peroxide (15% H2O2) was added to each vial. Two minutes later, 200-μl of 1% nitric acid were
added to each vial. After 5 minutes, the solution in the vials was removed. The otoliths were immediately rinsed three times with 200 μl of MilliQ water and then dried under a class-100 laminar flow hood (Air Control Inc.).
Otoliths were cut and polished to obtain a dorsoventral transverse section (~300 μm thick) that exposed the core. First, clean otoliths were embedded in Epothin 2 Epoxy Resin and Hard-ener. The anterior section of each otolith was cut along the transverse plane with a diamond saw (Hillquist Inc.) at approximately 200–300 μm from the core. This cut side was slightly polished and glued onto a petrographic slide using Epothin 2 Expoxy Resin and Hardener. The posterior side of the otolith was then cut and polished with a diamond polisher (Hillquist Inc.) at a dis-tance of 50–100 μm from the core. Polishing films (Precision Fiber Products, Inc.) of 30, 9, and 3 μm were used to carefully remove otolith material until the core was reached and the surface of the otoliths was further smoothed using a Mircocloth fabric (Buehler) with MicroPolish solu-tion (Buehler). Finally, the otolith cross secsolu-tions were cleaned using a soft tooth brush soaked first in 15% buffered hydrogen peroxide, then 1% nitric acid, and finally rinsed three times using Milli Q water. All samples were dried under the laminar flow hood before being stored.
Otolith Analysis
Otoliths were analyzed using laser-ablation inductively-coupled-plasma mass spectrometry (LAICPMS) at the University of North Carolina at Chapel Hill’s Mass Spectrometry Facility in September 2013. Otolith material was ablated using a Photon Machines Analyte G2 laser abla-tion unit (193 nm wavelength). Each otolith was sampled by ablating one 150-μm line along
the most recent growth increments at the ventral edge of the otolith (4.2 mJ/cm2intensity,
10-μm/s scan speed, and 110-μm spot size). Based on otolith growth data forF.grandisof similar
sizes (Anthony Vastano, personal communication), the ablated portion of otoliths corre-sponded to approximately the last month before capture. Ablated material was transported from the laser unit using a mixture of helium (He) and argon (Ar) gases to a Thermo Scientific Element XR Inductively-Coupled-Plasma Mass Spectrometer (ICPMS). The isotopes of eight
elements were recorded: calcium (48Ca), vanadium (51V), manganese (55Mn), nickel (60Ni),
copper (63Cu), strontium (88Sr), barium (138Ba), and lead (208Pb). To prevent nickel
interfer-ence, the ICPMS was fitted with an aluminum skimmer and sample cones (RA Chilton ICPMS Cones Ltd.). Elements were selected for analysis based on their potential use as indicators of oil
(e.g., V and Ni; [42]) or pollution (e.g., Cu, Pb from terrestrial sources; [43]) exposure. The list
also included elements traditionally used as environmental indicators of temperature and
salin-ity, such as Sr and Ba [44,45], and sediment redox (Mn; [46]). Calcium was used as a universal
internal standard to account for the amount of otolith material ablated. A glass standard spiked with trace elements (National Institute Standards and Technology [NIST]-612 glass reference
material, [47]) was analyzed at the beginning and end of each day, as well as every time the
Data Analysis
Data processing to determine elemental concentrations was conducted as described by Fodrie
and Levin [48]. For each run, the mass spectrometer produced a chromatogram (counts over
time). Detection limits for each element were defined as three standard deviations (SD) above the mean of the background. Detection limits (reported as element:Ca concentrations) were
calculated by averaging data from 16 otoliths and were based on acquiring 100 million48Ca
counts per second: 0.04 μmol V /mol Ca; 0.16 μmol Mn/mol Ca); 0.50 μmol Ni/mol Ca); 0.36 μmol Cu/mol Ca); 0.25 μmol Sr/mol Ca); 0.02 μmol Ba/mol Ca); and 0.05 μmol Pb/mol Ca). For signals above detection limits, background signals were subtracted from sample nals, and the area under the chromatogram peak was calculated (total counts). Elemental sig-nals below the detection limits threshold were assigned a random value between zero and the detection limit.
Following our BACI design, the effect of collection location (control reference vs. impact [i.e., oiled]) and time (before vs. after the grounding of oil at GT) on the elemental concentra-tion of killifish otoliths was evaluated using two-way analysis of variance (ANOVA). Tradi-tional BACI designs study one impact and one control location and do not replicate sites.
Underwood [49] stressed the importance of sampling multiple control sites and multiple
impacts sites when logistically possible, to increase the likelihood that observed differences are due to the impact in question. In this instance, field sites were established prior to the arrival of contaminating oil and we were not able to control the number of impacted or control sites as the trajectory of oil was highly patchy along northern GOM coasts. Oil made landfall at the GT site only, such that the remaining sites (BLB, MB and FMA) were considered unoiled reference sites. Thus, we considered our two-way analyses in three distinct ways: (1) averaging all data from BLB, MB and FMA in to an overall reference signature; (2) using only the data from FMA as the reference signature, given that FMA was most environmentally similar (e.g., salinity, temperature) to GT; and (3) using only data from BLB and FMA as the reference signature, in essence removing MB from our analyses since that site was most environmentally distinct from all other sites (low salinity), and post-spill data from MB were not available. Notably, the qualitative patterns we observed with respect to statistical and biological significance in otolith signals were conserved regardless of what approach we utilized for defining reference sites/
specimens (i.e., regardless of statistical approach, patterns were similar; seeS1,S2,S3andS4
Tables). For simplicity, we hereafter present only the merged results of BLB and FMA as the reference signature.
Our final ANOVA model included site and sampling period as main factors, as well as the effect of the site x sampling period interaction term. This design is based on the hypothesis that temporal changes in otolith signatures at the oiled site (GT) before and after the grounding of
oil should be distinct from temporal changes that occur at unoiled control sites [50]. Thus, the
ANOVA term of most interest was the site x sampling period interaction.
Separate two-way ANOVAs were run for the seven element:Ca ratios that were evaluated. Furthermore, separate two-way ANOVAs were run to first compare the pre-oil vs. peak-oil periods, and then the pre-oil vs. post-oil periods (i.e., 14 total analyses). Because each of the ele-ment:Ca metrics across the two different temporal comparisons was considered a distinct,
independent test of oil contact, we did not make corrections to experiment-wise alpha [51].
Rather, for each element and across all sampling periods, we consideredpvalues (without
denoting an arbitrary alpha), effect sizes, and variances to evaluate the strength of evidence for
otolith-based markers of oil contact [52,53]. For the ANOVAs, all element:Ca data were Log (x
Additionally, the associations between two environmental parameters, salinity and tempera-ture, and otolith Ba:Ca and Sr:Ca were also evaluated using linear regression (i.e., four separate analyses).
Results
Environmental Variables
Surface water temperatures at GT, BLB, MB, and FMA in 2010 were consistent with the 5-year
(2008–2013) seasonal mean for the northern Gulf of Mexico (Fig 2A). At all sites, mean
tem-peratures were approximately 20°C during April, and experienced a seasonal increase to approximately 30°C during May 2010, and remained at an average of 30°C from June to August.
Salinity regimes for these four sites were variable (Fig 2B). Salinity levels near MB were the
lowest. Monthly mean salinity in MB remained below 1 from April-July and rose slightly to 2.5 in August. The salinity at BLB fluctuated considerably between April and August (with daily values ranging from 2 to24). Monthly salinity averages were lowest from April to June (mean = 10) and highest in July-August (mean = 18). Near GT, monthly average salinity was 18 in April, decreased in May to 13, and reached the lowest average in June (7), before increas-ing to 13 in July. Notably, freshwater diversions in Louisiana which were increased in volume to slow the progression of oil into coastal habitats were evident at GT as revealed by the drop in salinity in June and August, which averaged 6 lower than the calculated 5 year mean (2008– 2013) for that time of the year. Salinity data for FMA were not available for the first six months of 2010. However, FMA had the highest salinity levels of all four sites during July and August, fluctuating between 13 and 30 and averaging 22.
Otolith Responses
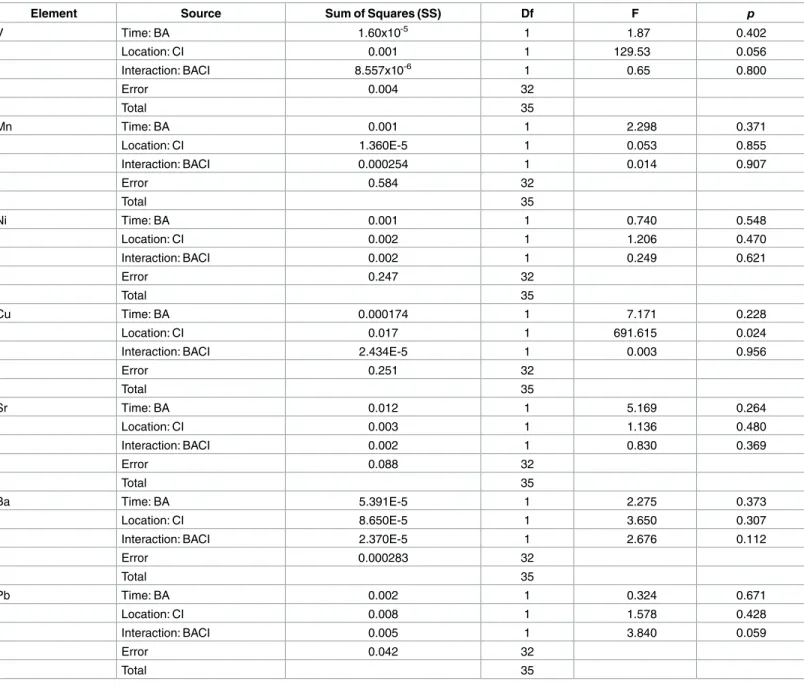
In the immediate aftermath of oil grounding at GT, changes in the otolith concentrations of Ba (moderate evidence) and Pb (strong evidence) were distinct from the concentrations in otoliths
from fish at control sites (Table 2,Fig 3). Mean otolith Ba:Ca (mmol/mol) levels at GT
increased by 40% between the pre-oil and peak-oil sampling, while otolith Ba:Ca concentra-tions among the control sites shifted negligibly over the same time. Statistical support for a meaningful, consistent interaction between site and time in otolith Ba:Ca signatures was not
strong however (p= 0.112;Table 2). Similarly, mean otolith Pb:Ca signatures were similar
between fish from GT and control sites during pre-oil sampling, and then diverged notably during peak-oil sampling. At GT, mean otolith Pb:Ca concentrations rose by over 300% through time (note large standard deviation), while otolith Pb:Ca concentrations of fish at
con-trol sites (collected at the same time as peak oiling at GT) fell to near 50% of pre-oil levels (Fig
3). Statistical evidence supported a marginally significant interaction between site and time on
otolith Pb:Ca in our BACI design (p= 0.059;Table 2). Among all other elements, the only
nota-ble differences across space or time were as follows: (1) otolith V:Ca concentrations were con-sistently higher (approximately double) at GT relative to control sites, regardless of sampling
period (main effect of sitep= 0.056;Table 2); and (2) otolith Cu:Ca concentrations were
con-sistently lower (approximately a 40% decline) at GT relative to control sites, regardless of
sam-pling period (main effect of sitep= 0.024;Table 2).
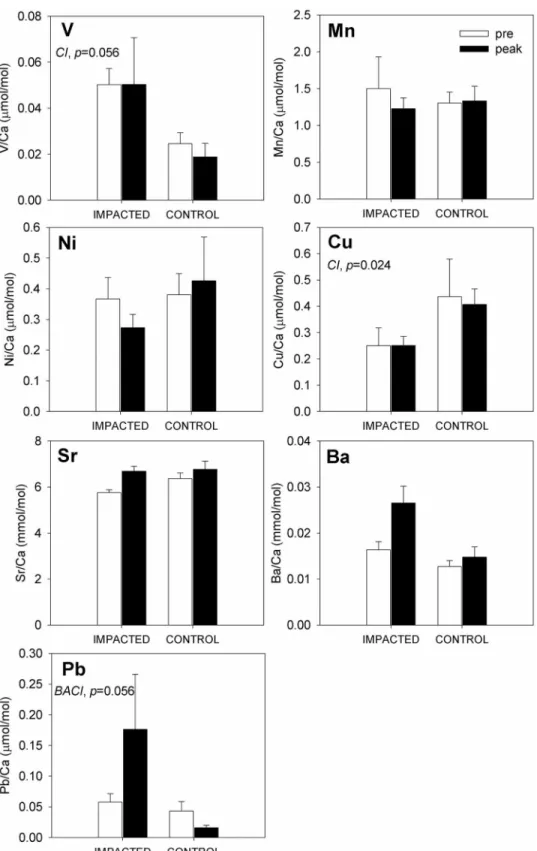
Two months later, at the “post-oil" sampling, otolith concentrations of Ba (strong evidence)
and Pb (strong evidence) were distinct between fish from oiled and reference sites (Table 3,Fig
4). Additionally, otolith concentrations of Cu (strong evidence) and Ni (very modest evidence)
Fig 2. Monthly mean temperature and salinity at fish collection sites. (A) Temperature values were
obtained from Barataria Bay Pass, LA (USGS 073802516) and were considered representatives of surface waters in the northernGulf of Mexico. The solid line represents the values for GT in 2010 and the dashed line the values for the 5-year mean. (B) Salinity values were obtained from stations near collection sites, including Maeher Park, AL (MB), Cedar Point, AL (BLB), Barataria Pass, LA (GT), and Dauphin Island, AL (FMA). The solid line represents values for GT in 2010 and the dashed line the values for the 5-year mean obtained from Barataria Pass.
sampling at the GT site, while otolith Ba:Ca concentrations among the control sites increased by only slightly between pre-oil and post-oil sampling. Moreover, the absolute change in oto-lith Ba:Ca at GT (a 0.02 mmol/mol increase) was five-times greater than the change observed at control sites (a 0.004 mmol/mol increase). Statistical support for an interaction between site
and time in otolith Ba:Ca signatures was compelling (p<0.001;Table 3). As before, Pb:Ca
sig-natures were similar between GT and control fish during pre-oil sampling, and then diverged notably during post-oil sampling. At GT, mean otolith Pb:Ca concentrations rose by over 800% through time (note large standard deviation), while Pb:Ca concentrations at control sites only doubled over the same period. Again, statistical evidence supported a marginally
Table 2. ANOVA table for two factor BACI design, pre- vs. peak oil comparison.
Element Source Sum of Squares (SS) Df F p
V Time: BA 1.60x10⁻⁵ 1 1.87 0.402
Location: CI 0.001 1 129.53 0.056
Interaction: BACI 8.557x10⁻⁶ 1 0.65 0.800
Error 0.004 32
Total 35
Mn Time: BA 0.001 1 2.298 0.371
Location: CI 1.360E-5 1 0.053 0.855
Interaction: BACI 0.000254 1 0.014 0.907
Error 0.584 32
Total 35
Ni Time: BA 0.001 1 0.740 0.548
Location: CI 0.002 1 1.206 0.470
Interaction: BACI 0.002 1 0.249 0.621
Error 0.247 32
Total 35
Cu Time: BA 0.000174 1 7.171 0.228
Location: CI 0.017 1 691.615 0.024
Interaction: BACI 2.434E-5 1 0.003 0.956
Error 0.251 32
Total 35
Sr Time: BA 0.012 1 5.169 0.264
Location: CI 0.003 1 1.136 0.480
Interaction: BACI 0.002 1 0.830 0.369
Error 0.088 32
Total 35
Ba Time: BA 5.391E-5 1 2.275 0.373
Location: CI 8.650E-5 1 3.650 0.307
Interaction: BACI 2.370E-5 1 2.676 0.112
Error 0.000283 32
Total 35
Pb Time: BA 0.002 1 0.324 0.671
Location: CI 0.008 1 1.578 0.428
Interaction: BACI 0.005 1 3.840 0.059
Error 0.042 32
Total 35
BLB and FMA were used as the reference (control) signature. BA = before-after, CI = control-impact.
Fig 3. Composite of trace element concentrations in Gulf killifish (Fundulus grandis) otoliths. Fish
significant interaction between site and time on Pb:Ca in our BACI test (p= 0.070;Table 3). While mean otolith Cu:Ca concentrations were nearly twice as high at control sites relative to GT before the grounding of oil, this pattern was reversed with Cu:Ca concentrations being twice as high at the oiled site relative to control sites during the post-oil sampling (statistical
test for a site x time interaction,p= 0.088;Table 3). This result was driven primarily by changes
over time at GT, as otolith Cu:Ca levels at control sites were relatively stable between pre-oil and post-oil sampling. Mean otolith Ni:Ca concentrations were also elevated at GT post-spill (i.e., a 400% increase relative to pre-oil levels) in a manner not reflected at control sites (where
Table 3. ANOVA table for two-factor BACI design, pre- vs. post-oil comparison.
Element Source Sum of Squares (SS) Df F p
V Time: BA 1.2E-4 1 449.69 0.030
Location: CI 0.001 1 3342.39 0.011
Interaction: BACI 2.672E-7 1 0.001 0.971
Error 0.006 32
Total 35
Mn Time: BA 0.025 1 5.262 0.262
Location: CI 0.003 1 0.676 0.562
Interaction: BACI 0.005 1 0.208 0.651
Error 0.733 32
Total 35
Ni Time: BA 0.064 1 1.233 0.467
Location: CI 0.050 1 0.963 0.506
Interaction: BACI 0.052 1 1.836 0.185
Error 0.906 32
Total 35
Cu Time: BA 0.020 1 0.747 0.546
Location: CI 0.001 1 0.055 0.854
Interaction: BACI 0.027 1 3.094 0.088
Error 0.274 32
Total 35
Sr Time: BA 0.049 1 100.558 0.063
Location: CI 0.006 1 12.078 0.178
Interaction: BACI 4.84E-4 1 0.172 0.681
Error 0.090 32
Total 35
Ba Time: BA 2.46E-4 1 2.556 0.356
Location: CI 2.03E-4 1 2.107 0.384
Interaction: BACI 9.634E-5 1 19.219 <0.001
Error 1.60E-4 32
Total 35
Pb Time: BA 0.040 1 2.202 0.378
Location: CI 0.023 1 1.287 0.460
Interaction: BACI 0.018 1 3.526 0.070
Error 0.165 32
Total 35
Data from GT were used as the impact signature and data from BLB and FMA were used as the reference (control) signature. BA = before-after, CI = control-impact.
Fig 4. Composite of trace element concentrations in Gulf killifish (Fundulus grandis) otoliths. Fish
were collected pre- (white bars) and post (gray bars) oil contamination at impacted (GT) and control sites (FMA, BLB). Each plot depicts the mean elemental concentrations (mean±SEM) inμmol/mol (V, Mn, Cu, Pb) or mmol/mol (Sr and Ba) of several otolith replicates. Sample sizes for the impacted sites are n = 6 (pre) and n = 6 (post) and for control sites n = 12 (pre) and n = 12 (post). Before-after (pre vs. post), impacted-control, and/or interaction effects are noted with a BA, CI, and or BACI respectively along with p values. ANOVA tables for the two-way before-after control-impact (BACI) design are included inTable 3.
Ni:Ca levels remained stable through time). However, statistical evidence for a site x time
inter-action in Ni:Ca was weak (p= 0.185;Table 3), and we note that the elevated post-oil mean at
GT was driven by an outlier. Again, V:Ca concentrations were consistently higher at GT than
all other sites (approximately double; main effect of sitep= 0.011), and over time we recorded
a 25% increase in V:Ca evenly across sites (main effect of timep= 0.030,Table 3). Sr:Ca levels
also increased by roughly 25% between pre-oil and post-oil sampling regardless of site type
(main effect of timep= 0.063;Table 3).
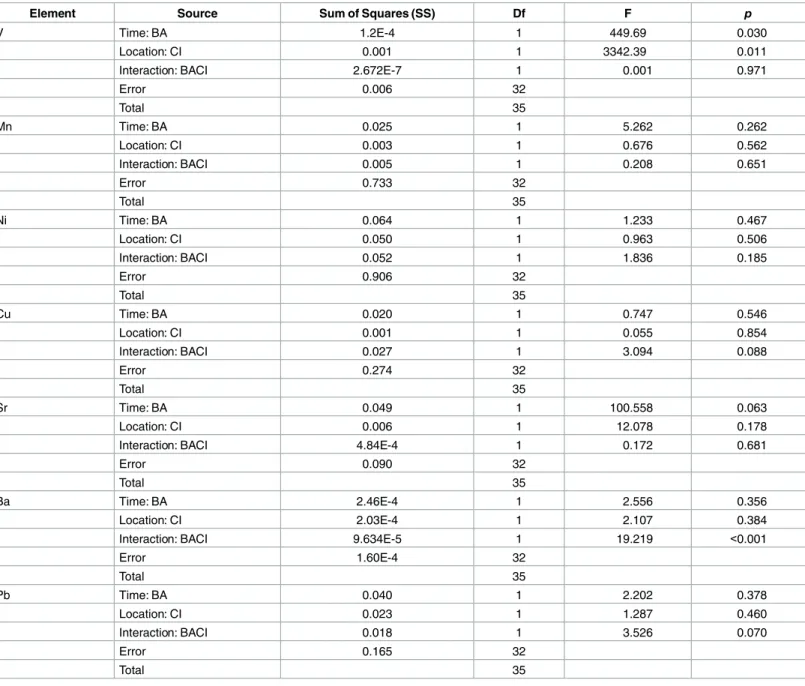
Changes in Ba and Sr concentrations were associated with temporal and spatial changes in
salinity. The relationship between salinity and Ba concentration was negative (R2= 0.373,
p= 0.046) (Fig 5A), while the relationship to Sr concentration was positive (R2= 0.69,
p= 0.002) (Fig 5B). No significant relationship between Ba concentrations and temperature
(R2= 0.02,p= 0.677) or Sr concentrations and temperature (R2= 0.105,p= 0.330) were
detected.
Discussion
We detected differences in the chemical composition ofF.grandisotoliths collected before and
after the Macondo oil spill at impacted vs. control sites, but not necessarily in the elements that we initially expected. Spatial and temporal patterns in otolith elemental concentration varied according to the element being examined, the sites, and the time of fish collection (pre, peak, or post-oil). There were no temporal changes (before-after [BA] effects) when we compared oto-liths collected before the oil reached the marshes in May (pre-oil) and a few days after it reached the marshes in late-June (peak-oil). However, spatial differences (control-impact [CI] effects) in both V and Cu concentrations were detected, but there was no interaction effect between site and time (no BACI effect). The only exception was Pb, where an increase in con-centration was observed only at the impacted site (GT) following oiling, but not at any refer-ence sites (interaction effect). Most importantly, two months following oiling (post-oil), there was an observed increase in the concentrations of Cu, Ba, and Pb only in otoliths at the impacted site (interaction effect), which could indicate a signature of DHOS oil or another dis-tinction for fish from GT in environmental exposure to these elements.
V and Ni: Putative Oil Markers
Crude oil is composed primarily of C, H, O, N, S, V, Ni, and Fe [42]. The initial goal of this
study was to determine whether exposure to crude oil, which has typically higher concentra-tions of V and Ni than seawater, would result in an increase in concentration of these two ele-ments (previously highlighted as oil markers) in otoliths of fish known to have been exposed to oil. Based on our analysis of these data, there was no clear, consistent evidence of an increase in V or Ni in the otoliths of oil-impacted killifish at the GT site or reference sites. This is perhaps not surprising, since V and Ni are not always consistently increased in tissues following
expo-sure to oil [54]. We do acknowledge that in comparing pre-oil vs. post-oil samples, mean Ni
concentrations increased at GT (driven by an outlier) while no increase was observed at our control sites. However, Ni loads in otoliths of individuals collected at GT post-oiling were highly variable and, thus, it is unclear if Ni can serve as a reliable marker of oil exposure. Nota-bly, V concentrations in GT otoliths were already higher than in BLB and FMA before the oil spill, which may reflect a long history (~70 years) of oil exploration and previous spills in
Loui-siana (US Minerals Management Service and US Coast Guard data in Turner et al. [55])
rela-tive to Alabama.
oil-Fig 5. Relationships between (A) Ba and (B) Sr concentrations in in Gulf killifish (Fundulus grandis) otoliths. Fish were collected in MB, FMA, GT, and BLB. Salinity averages include the months preceding
pre-oil (white circles), peak (black circles), and post-pre-oil (gray circles) collections. Because salinity data could not be obtained for May-Jun at FMA, salinity measured at the time of collection was used for this plot.
impacted fish. First, the most likely explanation is that the trace elements that traditionally serve as oil indicators (i.e. V and Ni) occur in low concentrations in Macondo oil relative to other crude oils. V and Ni are the most abundant metals in petroleum, but the concentrations
vary among oil reservoirs around the world [29]. Depending on the source, concentrations of
V can reach up to 1580 ppm and Ni up to 340 ppm [56]. Relative to other crude oils, the
con-centrations of V and Ni in Macondo oil are relatively low,<1.0–1.7 ppm, and<2.0–7.3 ppm,
respectively [33,34].
A recent study by Nelson et al. [36] acknowledged the chemically “light” nature of Macondo
oil in terms of trace metal loads. In that study, the researchers found distinct regional
signa-tures in the chemical composition ofF.grandisotoliths collected two years post-spill across the
northern GOM, but no statistically significant differences in the otoliths of fish from paired oiled versus unoiled sites. However, nearly all of their individuals were spawned after the
Macondo oil reached shore, based on maximum age estimates of 23 months [57]. Thus, it was
unclear if the animals used in those experiments had in fact been exposed to oil. Our results
agree with Nelson et al. [36] and strengthen the conclusion that Ni and V markers do not
docu-ment a history of exposure to Macondo oil inF.grandisotoliths.
Second, following exposure to Macondo oil, fish growth rates and physiological performance could have been impacted, decreasing the rate of incorporation of Ca and other divalent cations into the otoliths. Direct exposure to oil and other toxicants does impact the metabolic and
ener-getic function of fish [58]. Exposure to oil can alter cell membrane structure and function and
can lead to abnormal gill morphology and function [59], potentially affecting respiration and
metabolic potential. Moreover, the metabolic cost associated with PAH metabolism is likely high,
potentially requiring reallocation of energy from growth, reproduction, etc. [58]. Reduced weight
and prey-capturing ability has been associated with mercury contamination in Atlantic killifish (F.heteroclitus), indicating that a metabolic cost associated with toxicity is manifested in growth
[60], and the expression of several genes associated with metabolic activity were divergent in
these fish [11,13]. Further, decrease in otolith growth due to crude oil exposure has been observed
in juvenile sea bass [61]. It follows that because the fish from GT in the present study clearly
exhibited physiological responses to oil pollution, it is possible that somatic or otolith growth could have been reduced, and as a result, oil signatures were not incorporated into the otoliths.
Alternatively, an increase in otolith growth due to crude oil has also been reported following
previous oil spills. A decrease in abundance of large Atlantic killifish (F.heteroclitus) following
an oil spill in the Arthur Kill, New Jersey, was associated with an increase in food resources available to young-of-the-year (small) Atlantic killifish one year after the spill, likely explaining
an increase in fish abundance and faster growth rates among smaller size classes [62]. However,
fish assemblage comparisons conducted two years after the Macondo oil spill in Barataria Bay, Louisiana, indicate that there was no significant difference in the length frequency distributions ofF.grandisin oiled vs. unoiled marshes [17]. Therefore, there is no evidence thatF.grandis
growth rates were affected in a manner that explains our otolith marker results.
Third, increases in levels of Ni and V in the otolith may be delayed relative to other elements based on the pathway of incorporation. For instance, V may only be bioavailable (in aqueous
phase) following microbial degradation of oil [63]. Incorporation of these elements into higher
trophic organisms may therefore be different because of physiological or perhaps food-web fil-ters. For example, bivalve tissues and shells monitored for increased levels of V and Ni following
the “Erika” tanker oil spill in France exhibited an increase in V only after five months, while
ele-vated Ni levels persisted a year after oiling [31]. Although elemental profiles are generally an
indication of surrounding water composition, food sources play a role in the accumulation of
some of the elements that become incorporated into the otolith [64]. Indeed, temporal
taxa (e.g., marsh periwinkles, mussels, dogwelks; [30]. As adults,F.grandisfeed on a variety of
resources, including fiddler crabs, amphipods, tanaids, marsh periwinkles, and polycheates [65].
Evidence suggests that while some of these resources were suppressed by DHOS oil exposure
(e.g. fiddler crabs), others were not (e.g., marsh periwinkles) [66], and oil can remain bound in
sediments and associated food sources for years [13,67,68]. Killifish from this study showed
high CYP1A expression in the intestine of GT fish for over one year following landfall of oil, indicating that these fish were likely exposed to PAHs through the diet or from inadvertent
sedi-ment consumption during feeding [13]. Still, it is unclear to what extent food sources could
con-tribute to metal accumulation in otoliths over time in fish exposed to oil from the DHOS. To date, we have found no evidence in the literature to suggest that trace metals associated with the Macondo oil spill are present in higher concentrations in marsh food webs. For instance, trace
element concentrations in oyster shells exposed to oil also did not corroborate oil exposure [69].
Cu and Pb: Freshwater Diversion or Oil Markers
Notable increases in the concentrations of Cu and Pb were detected in the otoliths of fish col-lected two months after oil landfall at the GT impacted site (BACI effect). GT was not only oiled in the summer of 2010, but also experienced an unprecedented freshwater diversion in an effort to flush oil from the Barataria watershed. This influx of fresh water was released from the Mississippi River at six times the normal discharge volume, lasted from April to
late-August, and reduced salinity in Barataria Bay well below typical values [70]. Therefore, it is
possible that elevated Cu and Pb concentrations in fish otoliths could be associated with either the freshwater diversions (river source) or oil exposure (offshore source), or a combination of both sources and other contamination.
Historically, the main sources of Cu and Pb in the Mississippi River have been municipal wastewaters and mining (in addition to natural sources). Accordingly, these elements are both
monitored because they can be indicators of pollution (e.g., [71,72]). Measurable traces of
dis-solved Cu (2 ppb) and Pb (<0.1 ppb) have been documented in Mississippi River waters [73].
However, their presence in estuaries is longstanding, where significant Pb loads in southern Louisiana are attributed to oil refinery effluent (Pb concentrations of 20 to 14,245 ppm in
wet-lands; [74]). In addition, some elements may be more bioavailable in lower salinities. For
exam-ple, the accumulation of Cu in tissues at lower salinities has been reported for the congenerF.
heteroclitus[75]. By contrast to Mississippi River waters, Cu and Pb concentrations in Macondo oil are 0.5 and 0.3 ppm, respectively, and oil mousse samples collected near salt marshes in Mississippi were only slightly higher in concentration (closer to 3.3 and 1.5 ppm,
respectively) [33]. Yet, Hanson and Zdanowicz [76] argued that organic contaminant exposure
(PAHs) may also affect Cu levels in otoliths, as it is known to affect hepatic Cu concentration
[77]. Following thePrestigeoil spill in Spain, Cu and Pb concentrations in seabird feathers
were two and five times higher than pre-spill levels, respectively, but returned to previous
back-ground concentrations after three years [54]. In our study, Cu and Pb concentrations in
oto-liths from GT fish sampled post-oil were also two and five times higher, respectively, than pre-oil samples, indicating that increased Cu and Pb in the otoliths could be indicative of pre-oil expo-sure in GT fish. Notably, V and Ni were not detected in seabird feathers in the Moreno et al.
[54] study, thus corroborating our results that do not support the utility of V or Ni as indicators
of DHOS oil exposure in otoliths of Gulf fish species.
Sr and Ba: Oil Signature or Record of Freshwater Diversions
slow the entry of oil into coastal areas [78]. At the USGS station in Barataria Pass (<200 meters from the GT collection site), very low salinity was recorded: almost 10 units below the 5-year
mean (Fig 2B). In the present study, an increase in Ba concentration in fish otoliths was
nega-tively correlated with salinity. The uptake of Ba in the otolith matrix can be regulated by (1)
salinity, (2) temperature, and/or the (3) availability of Ba in the water column [79]. Ba has been
negatively related to salinity in juvenile Atlantic croaker (Micropogonias undulatus) [79] and
striped bass [80]. Therefore, the increase in Ba concentrations in otoliths from fish collected in
GT may have been due to the low salinity derived from the freshwater diversions. Sr uptake is also associated with salinity, but the relationship is expected to be positive (Sr decreases with a
decrease in salinity, e.g.,Fig 2b). Therefore, our Sr observations (increase following freshwater
diversion) may suggest that the change in Ba was not exclusively associated with lower salini-ties. Alternatively, the diversions could have resulted in an increase in Ba in the water column, as well as an increase in other trace elements. Multiple trace elements are found in higher
con-centrations in the Mississippi River and the northern Gulf of Mexico [55]. Joung and Shiller
[81] highlighted the importance of considering both natural and anthropogenic sources of Ba
when studying the Ba-salinity relationship in this region.
It is important to note that salinity measured at the time the fish were collected did not
cor-relate with gene expression in the Whitehead et al. [11] study and the patterns of gene
expres-sion were not a result of changes in salinity, but exposure to oil. Consideration of monthly means for both salinity and temperature is appropriate for otolith microchemistry because environmental patterns are integrated into the otolith over longer periods of time. By contrast,
for gene expression and many aspects of physiology with short-term responses [41], monthly
means are not relevant. Moreover, environmental parameters like salinity are not necessarily
associated with stress indicators, but PAHs solubility is higher at lower salinities [82] and this
can enhance PAH-induced mortality (reviewed by Whitehead et al. [83]).
Crude oil also contains trace concentrations of Sr and Ba [29]. However, Sr and Ba
concen-trations in Macondo oil are similar to seawater [34]. While barite (barium sulfate [BaSO4]) is
present in the drilling muds used to stem the flow from the Macondo blowout, it is unlikely to
explain the higher Ba signal in the otoliths ofF.grandiscollected at MB. Furthermore, it seems
unlikely that drilling-mud-derived Ba could have reached coastal estuaries at concentrations high enough to explain chemical signatures observed at GT (or MB). Barium from discharge drilling muds is a concern for benthic communities near areas of high use, and can persist at
high concentrations for decades following drilling [72]. However, barite has a low solubility in
water [84]. Others reported high concentrations of Ba within the oil plume (1000–1300 m
deep) near the Macondo well, but the concentration of Ba peaked 6 km away from the well
[34]. Considering that GT is approximately 150 km from the blowout, it is unlikely that the
drilling muds used at the Macondo well contributed to the high Ba content at the GT site.
Limitations of the Study
A long history of oil contamination in Louisiana, the nature of the Macondo oil spill, and the unpredictable trajectory of the oil to coastal marshes limited some aspects of this study. First, marshes in Louisiana have been exposed to oil contamination due to small scale oil spills and
refinery effluent for over 70 years [55]. Therefore, we speculate that background levels of some
Louisiana that included both areas directly contaminated by oil and not impacted by freshwater diversions as well as sites affected by freshwater diversions but not oil contamination. However, it was not possible to predict where these sites would be at the time the study was initiated.
Conclusions
The functional resilience and integrity of the Gulf of Mexico is being perturbed by both local
(e.g., shoreline development; [85] and regional (climate change; [86]) stressors. Coastal
Louisi-ana, in particular, is susceptible to a variety of oil impacts due to a long history of oil
produc-tion and refinery activity [87], but also compounding stressors such as hurricanes [88,89],
sea-level rise [90,91], large-scale freshwater diversions [10,92], and coastal subsidence from
reduced sedimentation associated with the channelization of the Mississippi River, fossil fuel
extraction, and marsh compaction [93]. Temporal fluctuations in water chemistry are also
common. Despite known oil exposure in GTF.grandis, and the utility of otolith
microchemis-try in assessing oil exposure from other spills (e.g.,Prestige Oil Spill: [28]), the use of otolith
microchemistry for detecting oil exposure is complicated by the nature of the DHOS oil (source and weathering), the large geographical region over which oil was spilled, the long period of oiling, and re-oiling events. Moreover, other environmental stressors such as salinity change are likely recorded in hard body parts of GOM species (e.g., fish otoliths, oyster shells). In the present study, we detected multi-elemental differences across space and time. Low salinity rec-ords indicate changes in Ba concentrations may have been, in part, due to freshwater diver-sions, designed to halt the ingress of oil. Changes in Cu and Pb concentrations may also be linked to land pollution via freshwater diversions and/or be indicative of oil exposure. Our results highlight the potentially complex and indirect effects of the Macondo oil spill and human responses oil spills in Gulf of Mexico ecosystems and emphasize the need to consider multiple stressors acting simultaneously on inshore fish communities.
Supporting Information
S1 Table. ANOVA table for two factor BACI design, pre- vs. peak oil comparison. Data from GT were used as the impact signature and data from BLB, MB, and FMA were used as the reference (control) signature. BA = before-after, CI = control-impact.
(DOCX)
S2 Table. ANOVA table for two-factor BACI design, pre- vs. post-oil comparison. Data from GT were used as the impact signature and data from BLB, MB, and FMA were used as the reference (control) signature. BA = before-after, CI = control-impact.
(DOCX)
S3 Table. ANOVA table for two factor BACI design, pre- vs. peak oil comparison. Data from GT were used as the impact signature and data from FMA were used as the reference (control) signature. BA = before-after, CI = control-impact.
(DOCX)
S4 Table. ANOVA table for two-factor BACI design, pre- vs. post-oil comparison. Data from GT were used as the impact signature and data from FMA were used as the reference (control) signature. BA = before-after, CI = control-impact.
Acknowledgments
We are grateful to the staff of the Mass Spectrometry Facility at the University of North Caro-lina at Chapel Hill and Christopher Filosa for assistance with otolith preparation. We also thank the editorial team at PLoS ONE and two anonymous reviewers for suggestions that strengthen the manuscript. This research was made possible by a grant from The Gulf of Mexico Research Initiative. Data are publicly available through the Gulf of Mexico Research
Initiative Information & Data Cooperative (GRIIDC) athttps://data.gulfresearchinitiative.org
(doi:10.7266/N7NP22CQ).
Author Contributions
Conceptualization: PCL FJF OPJ AW FG BD KWA.
Formal analysis: PCL FJF.
Funding acquisition: PCL FJF OPJ AW FG BD KWA.
Investigation: PCL FJF OPJ AW FG BD KWA.
Methodology: PCL FJF OPJ AW FG BD KWA.
Visualization: PCL.
Writing – original draft: PCL FJF OPJ AW FG BD KWA.
Writing – review & editing: PCL FJF OPJ AW FG BD KWA.
References
1. Adams CM, Hernandez E, Cato JC. The economic significance of the Gulf of Mexico related to popula-tion, income, employment, minerals, fisheries and shipping. Ocean Coast Manag. 2005; 47: 565–580. doi:10.1016/j.ocecoaman.2004.12.002
2. Lellis-Dibble KA, McGlynn KE, Bigford TE. Estuarine fish and shellfish species in U.S. commercial and recreational fisheries : economic value as an incentive to protect and restore. National Oceanic and Atmospheric Administration. NOAA Technical Memorandum no. NMFS-F/SPO-90. 2008.
3. Crone TJ, Tolstoy M. Magnitude of the 2010 Gulf of Mexico oil leak. Science. 2010; 330: 634. doi:10. 1126/science.1195840PMID:20929734
4. Peterson CH, Anderson SS, Cherr GN, Ambrose RF, Anghera S, Bay S, et al. A Tale of Two Spills: Novel Science and Policy Implications of an Emerging New Oil Spill Model. Bioscience. 2012; 62: 461– 469. doi:10.1525/bio.2012.62.5.7
5. Fisher CR, Demopoulos AWJ, Cordes EE, Baums IB, White HK, Bourque JR. Coral Communities as Indicators of Ecosystem-Level Impacts of the Deepwater Horizon Spill. Bioscience. 2014; 64: 796–807. doi:10.1093/biosci/biu129
6. Baguley J, Montagna P, Cooksey C, Hyland J, Bang H, Morrison C, et al. Community response of deep-sea soft-sediment metazoan meiofauna to the Deepwater Horizon blowout and oil spill. Mar Ecol Prog Ser. 2015; 528: 127–140. doi:10.3354/meps11290
7. Michel J, Owens EH, Zengel S, Graham A, Nixon Z, Allard T, et al. Extent and degree of shoreline oil-ing: Deepwater Horizon oil spill, Gulf of Mexico, USA. PLoS One. 2013; 8: e65087. doi:10.1371/ journal.pone.0065087PMID:23776444
8. Boesch D., Turner RE. Dependence of fishery species on salt marshes: the role of food and refuge. Estuaries. 1984; 7: 460–468.
9. Peterson GW, Turner RE. The value of salt marsh edge vs. interior as a habitat for fish and decapod crustaceans in a Louisiana tidal marsh. Estuaries. 1994; 17: 235–262.
10. Chesney EJ, Baltz DM, Thomas RG. Louisiana estuarine and coastal fisheries and habitats: perspec-tives from fish’s eye view. Ecol Appl. 2000; 10: 350–366.
12. Garcia TI, Shen Y, Crawford D, Oleksiak MF, Whitehead A, Walter RB. RNA-Seq reveals complex genetic response to deepwater horizon oil release in Fundulus grandis. BMC Genomics. BMC Geno-mics; 2012; 13: 474. doi:10.1186/1471-2164-13-474PMID:22971268
13. Dubansky B, Whitehead A, Miller JT, Rice CD, Galvez F. Multitissue molecular, genomic, and develop-mental effects of the Deepwater Horizon Oil Spill on resident Gulf Killifish (Fundulus grandis). Environ Sci Technol. 2013; 47: 5074–5082. doi:10.1021/es400458pPMID:23659337
14. Kuhl AJ, Nyman JA, Kaller MD, Green CC. Dispersant and salinity effects on weathering and acute tox-icity of South Louisiana crude oil. Environ Toxico l Chem. 2013; 32: n/a–n/a. doi:10.1002/etc.2346
15. Crowe KM, Newton JC, Kaltenboeck B, Johnson C. Oxidative stress responses of gulf killifish exposed to hydrocarbons from the Deepwater Horizon oil spill: Potential implications for aquatic food resources. Environ Toxico l Chem. 2014; 33: 370–4. doi:10.1002/etc.2427PMID:24122941
16. Moody RM, Cebrian J, Heck KL. Interannual recruitment dynamics for resident and transient marsh species: evidence for a lack of impact by the Macondo oil spill. PLoS One. 2013; 8: e58376–e58376. doi:10.1371/journal.pone.0058376PMID:23516467
17. Able KW, López-duarte PC, Fodrie FJ, Jensen OP, Martin CW, Roberts BJ, et al. Fish Assemblages in Louisiana Salt Marshes : Effects of the Macondo Oil Spill. Estuaries and Coasts. 2015; 37: 1–14. doi: 10.1007/s12237-014-9890-6
18. Hagan SM, Brown SA, Able KW. Production of mummichog (Fundulus heteroclitus): response in marshes treated for common reed (Phragmites australis) removal. Wetlands. 2007; 27: 54–67.
19. Able KW, Vivian DN, Petruzzelli G, Hagan SM. Connectivity among salt marsh subhabitats: residency and movements of the mummichog (Fundulus heteroclitus). Estuaries and Coasts. 2012; 35: 743–753. doi:10.1007/s12237-011-9471-x
20. Nelson TR, Sutton D, DeVries DR. Summer movements of the Gulf Killifish (Fundulus grandis) in a northernGulf of Mexico salt marsh. Estuaries and Coasts. 2014; doi:10.1007/s12237-013-9762-5
21. Van Veld PA, Nacci DE. Toxicity Resistance. In: DiGiulio RT, Hinton DE, editors. The Toxicology of Fishes. Boca Raton: CRC Press—Taylor & Francis Group; 2008. pp. 597–641. doi:10.1201/ 9780203647295.ch13
22. Fodrie FJ, Able KW, Galvez F, Heck KL, Jensen OP, Lopez-Duarte PC, et al. Integrating Organismal and Population Responses of Estuarine Fishes in Macondo Spill Research. Bioscience. 2014; 64: 778–788. doi:10.1093/biosci/biu123
23. Campana SE. Chemistry and composition of fish otoliths: pathways, mechanisms and applicaitons. Mar Ecol Prog Ser. 1999; 188: 263–297.
24. Elsdon TS, Gillanders BM. Reconstructing migratory patterns of fish based on environmental influences on otolith chemistry. Rev Fish Biol Fish. 2003; 13: 219–235.
25. Elsdon TS, Gillanders BM. Alternative life-history patterns of estuarine fish: barium in otoliths elucidates freshwater residency. Can J Fish Aquat Sci. 2005; 62: 1143–1152. doi:10.1139/f05-029
26. Marohn L, Hilge V, Zumholz K, Klügel A, Anders H, Hanel R. Temperature dependency of element incorporation into European eel (Anguilla anguilla) otoliths. Anal Bioanal Chem. 2011; 399: 2175–84. doi:10.1007/s00216-010-4412-2PMID:21107822
27. Webb SD, Woodcock SH, Gillanders BM. Sources of otolith barium and strontium in estuarine fish and the influence of salinity and temperature. Mar Ecol Prog Ser. 2012; 453: 189–199. doi:10.3354/ meps09653
28. Morales-Nin B, Geffen AJ, Cardona F, Kruber C, Saborido-Rey F. The effect of Prestige oil ingestion on the growth and chemical composition of turbot otoliths. Mar Pollut Bull. 2007; 54: 1732–1741. doi:10. 1016/j.marpolbul.2007.07.007PMID:17889035
29. Ball J., Wenger W., Hyden HJ, Horr CA, Myers AT. Metal content of twenty-four petroleums. J Chem Eng Data. 1960; 5: 553–557.
30. Amiard J-C, Bacheley H, Barillé AL, Barillé L, Geffard A, Himery N. Temporal changes in nickel and vanadium concentrations and in condition index and metallothionein levels in three species of molluscs following the “Erika” oil spill. Aquat Living Resour. 2004; 17: 281–288. doi:10.1051/alr:2004037
31. Chiffoleau J, Chauvaud L, Amouroux D, Barats A, Dufour A, Pécheyran C, et al. Nickel and vanadium contamination of benthic invertebrates following the “Erika” wreck. Aquat Living Resour. 2004; 17: 273– 280.
32. Grosser ZA, Bass D, Foglio L, Davidowski L. Determination of metals as markers of oil: contamination in seafood by ICP-MS. AgroFOOR Ind Hi-Tech. 2012; 23: 24–26.
34. Joung D, Shiller AM. Trace element distributions in the water column near the deepwater horizon well blowout. Environ Sci Technol. 2013; 47: 2161–2168. doi:10.1021/es303167pPMID:23383592
35. Wang Z, Fingas MF. Development of oil hydrocarbon fingerprintingand identification techniques. Mar Pollut Bull. 2003; 47: 423–452. doi:10.1016/S0025-326X(03)00215-7PMID:12899888
36. Nelson TR, DeVries DR, Wright RA, Gagnon JE. Fundulus grandis Otolith Microchemistry as a Metric of Estuarine Discrimination and Oil Exposure. Estuaries and Coasts. 2015; doi: 10.1007/s12237-014-9934-y
37. dos Anjos NA, Schulze T, Brack W, Val AL, Schirmer K, Scholz S. Identification and evaluation of cyp1a transcript expression in fish as molecular biomarker for petroleum contamination in tropical fresh water ecosystems. Aquat Toxico l. Elsevier B.V.; 2011; 103: 46–52. doi:10.1016/j.aquatox.2011.02. 004
38. Loughery JR, Arciszewski TJ, Kidd K a, Mercer A, Hewitt LM, MacLatchy DL, et al. Understanding the chronic impacts of oil refinery wastewater requires consideration of sediment contributions to toxicity. Arch Environ Contam Toxico l. 2014; 66: 19–31. doi:10.1007/s00244-013-9954-9PMID:24220765
39. Holth TF, Eidsvoll DP, Farmen E, Sanders MB, Martínez-Gómez C, Budzinski H, et al. Effects of water accommodated fractions of crude oils and diesel on a suite of biomarkers in Atlantic cod (Gadus mor-hua). Aquat Toxico l. Elsevier B.V.; 2014; 154: 240–52. doi:10.1016/j.aquatox.2014.05.013
40. Pilcher W, Miles S, Tang S, Mayer G, Whitehead A. Genomic and genotoxic responses to controlled weathered-Oil exposures confirm and extend field studies on impacts of the deepwater horizon oil spill on native killifish. PLoS One. 2014; 9. doi:10.1371/journal.pone.0106351
41. Whitehead A, Galvez F, Zhang S, Williams LM, Oleksiak MF. Functional genomics of physiological plasticity and local adaptation in killifish. J Hered. 2011; 102: 499–511. doi:10.1093/jhered/esq077 PMID:20581107
42. Ellis J, Rechsteiner C, Moir M, Wilbur S. Determination of volatile nickel and vanadinum species in crude oil and crude oil fractions by gas chromatography coupled to inductively coupled plasma mass spectrometry. J Anal At Spectrom. 2011; 26: 1674–1678. doi:10.1039/c1ja10058k
43. Forrester GE, Swearer SE. Trace elements in otoliths indicate the use of open-coast versus bay nurs-ery habitats by juvenile California halibut. Mar Ecol Prog Ser. 2002; 241: 201–213. doi:10.3354/ meps241201
44. Elsdon TS, Gillanders BM. Interactive effects of temperature and salinity on otolith chemistry: chal-lenges for determining environmental histories of fish. Can J Fish Aquat Sci. 2002; 59: 1796–1808. doi: 10.1139/f02-154
45. Elsdon TS, Gillanders BM. Fish otolith chemistry influenced by exposure to multiple environmental vari-ables. J Exp Mar Bio Ecol. 2004; 313: 269–284. doi:10.1016/j.jembe.2004.08.010
46. Jackman G, Limburg KE, Waldman J. Life on the bottom: the chemical and morphological asymmetry of winter flounder (Pseudopleuronectes americanus) sagittae. Environ Biol Fishes. Environmental Biol-ogy of Fishes; 2015; 99: 27–38. doi:10.1007/s10641-015-0451-z
47. Pearce NJG, Perkins WT, Westgate JA, Gorton MP, Jackson SE, Neal CR, et al. A compilation of new and published major and trace element data for NIST SRM 610 and NIST SRM 612 glass reference materials. Geostand Newsl. 1997; 21: 115–144. doi:10.1111/j.1751-908X.1997.tb00538.x
48. Fodrie FJ, Levin LA. Linking juvenile habitat utilization to population dynamics of California halibut. Lim-nol Oceanogr. 2008; 53: 799–812. doi:10.4319/lo.2008.53.2.0799
49. Underwood AJ. Beyond BACI—the detection of environmental impacts on populations in the real, but variable, workd. J Exp Mar Bio Ecol. 1992; 161: 145–178. doi:10.1016/0022-0981(92)90094-Q
50. Underwood AJ. On beyond BACI: Sampling designs that might reliably detect environmental distur-bances. Ecol Appl. 1994; 4: 3–15. doi:10.2307/1942110
51. Moran MD. Arguments for rejecting the sequential Bonferroni in ecological studies. Oikos. 2003; 100: 403–405. doi:10.1034/j.1600-0706.2003.12010.x
52. Hurlbert SH, Lombardi CM. Final collapse of the Neyman-Pearson decision theoretic framework and rise of the neoFisherian. Ann Zool Fennici. 2009; 46: 311–349. doi:10.5735/086.046.0501
53. Murtaugh PA. In defense of P values. Ecology. 2014; 95: 611–617. doi:10.1890/13-0590.1PMID: 24804441
54. Moreno R, Jover L, Diez C, Sanpera C. Seabird feathers as monitors of the levels and persistence of heavy metal pollution after the Prestige oil spill. Environ Pollut. Elsevier Ltd; 2011; 159: 2454–2460. doi:10.1016/j.envpol.2011.06.033
56. Barwise AJG. Role of Nickel and Vanadium in Petroleum Classification. Energy & Fuels. 1990; 4: 647– 652. doi:10.1021/ef00024a005
57. Lipcius RN, Subrahmanyam CB. Temporal factors influencing killifish abundance and recruitment in Gulf of Mexico salt marshes. Estuar Coast Shelf Sci. 1986; 22: 101–114.
58. Whitehead A. Interactions between Oil-Spill Pollutants and Natural Stressors Can Compound Ecotoxi-cological Effects. Integr Comp Biol. 2013; 53: 635–47. doi:10.1093/icb/ict080PMID:23842611
59. Engelhardt FR, Wong MP, Duey ME. Hydromineral balance and gill morphology in rainbow-trout salmon-gairdneri, acclimated to fresh and sea-water, as affected by petroleum exposure. Aquat Toxi-col. 1981; 1: 175–186. doi:10.1016/0166-445X(81)90013-8
60. Weis JS, Khan AA. Reduction in prey capture ability and condition of mummichogs from a polluted habi-tat. Trans Am Fish Soc. 1991; 120: 127–129. doi:10.1577/1548-8659(1991)120<0127:NRIPCA>2.3. CO;2
61. Kerambrun E, Le Floch S, Sanchez W, Thomas Guyon H, Meziane T, Henry F, et al. Responses of juvenile sea bass, Dicentrarchus labrax, exposed to acute concentrations of crude oil, as assessed by molecular and physiological biomarkers. Chemosphere. Elsevier Ltd; 2012; 87: 692–702. doi:10.1016/ j.chemosphere.2011.12.059
62. Brzorad JN, Burger J. Fish and shrimp populations in the Arthur Kill. In: Burger J, editor. Before and After an Oil Spill: The Arthur Kill. New Brunswick: Rutgers University Press; 1994. pp. 178–200.
63. Sasaki T, Maki H, Ishihara M, Harayama S. Vanadium as an internal marker to evaluate microbial deg-radation of crude oil. Environ Sci Technol. 1998; 32: 3618–3621. doi:10.1021/es980287o
64. Walther BD, Thorrold SR. Water, not food, contributes the majority of strontium and barium deposited in the otoliths of a marine fish. Mar Ecol Prog Ser. 2006; 311: 125–130.
65. Rozas LP, LaSalle MW. A comparison of diets of Gulf killifish, Fundulus grandis Baird and Girard, enter-ing and leaventer-ing a Mississippi brackish marsh. Estuaries. 1990; 13: 332–336.
66. McCall BD, Pennings SC. Disturbance and recovery of salt marsh arthropod communities following BP Deepwater Horizon oil spill. PLoS One. 2012; 7: e32735. doi:10.1371/journal.pone.0032735PMID: 22412916
67. Woodin BR, Smolowitz RM, Stegeman JJ. Induction of cytochrome P4501A in the intertidal fish Ano-plarchus purpurescens by Prudhoe bay crude oil and environmental induction in fish from Prince Wil-liam Sound. Environ Sci Technol. 1997; 31: 1198–1205. doi:10.1021/es9607190
68. Short JW, Rice SD, Heintz RA, Carls MG, Moles A. Long-Term Effects of Crude Oil on Developing Fish: Lessons from the Exxon Valdez Oil Spill. Energy Sources. 2003; 25: 509–517. doi:10.1080/
00908310390195589
69. Carmichael RH, Jones AL, Patterson HK, Walton WC, Pérez-Huerta A, Overton EB, et al. Assimilation of oil-derived elements by oysters due to the deepwater horizon oil spill. Environ Sci Technol. 2012; 46: 12787–12795. doi:10.1021/es302369hPMID:23131011
70. Middleton BA, Johnson D, Roberts BJ. Hydrologic remediation for the Deepwater Horizon incident drove ancillary primary production increase in coastal swamps. Ecohydrology. 2015; 8: 838–850. doi: 10.1002/eco.1625
71. Trefry JH, Metz S, Trocine RP, Nelsen TA. A decline in lead transport by the Mississippi River. Science (80-). 1985; 230: 439–441. doi:10.1126/science.230.4724.439
72. Trefry JH, Dunton KH, Trocine RP, Schonberg S V, McTigue ND, Hersh ES, et al. Chemical and biolog-ical assessment of two offshore drilling sites in the Alaskan Arctic. Mar Environ Res. Elsevier Ltd; 2013; 86: 35–45. doi:10.1016/j.marenvres.2013.02.008
73. Garbarino JR, Hayes HC, Roth DA, Antweiler RC, Brinton TI, Taylor HE. Heavy metals in the Missis-sippi River. In: Meade RH, editor. Contaminants in the MissisMissis-sippi River, 1987–92. Reston, VA: US Geological Survey Circular 1133; 1995. Available:http://water.usgs.gov/pubs/circ/circ1133/
74. Marcantonio F, Flowers GC, Templin N. Lead contamination in a wetland watershed: isotopes as finger-prints of pollution. Environ Geol. 1999; 39: 1070–1076.
75. Blanchard J, Grosell M. Effects of salinity on copper accumulation in the common killifish (Fundulus het-eroclitus). Environ Toxicol Chem. 2005; 24: 1403–1413. doi:10.1897/04-373r.1PMID:16117116
76. Hanson P, Zdanowicz V. Elemental composition of otoliths from Atlantic croaker along an estuarine pol-lution gradient. J Fish Biol. 1999; 54: 656–668.
77. Hanson PJ. Response of hepatic trace element concentrations in fish exposed to elemental and organic contaminants. Estuaries. 1997; 20: 659–676. doi:10.2307/1352242
![Fig 1. Map of study sites in the northern Gulf of Mexico. General (inset) and specific location of Gulf killifish (Fundulus grandis) collection sites in Grande Terre [GT], LA; Bayou La Batre, AL [BLB]; Mobile Bay, AL [MB]; and Fort Morgan, AL [FMA], throug](https://thumb-us.123doks.com/thumbv2/123dok_us/8270845.2190694/5.918.217.867.113.974/northern-general-specific-location-killifish-fundulus-collection-grande.webp)