QUANTITATIVE ANALYSIS OF FECAL CONTAMINATION IN STORMWATER CONVEYANCE SYSTEMS AND THE EFFECTS OF STORM DRAIN DISCHARGE ON
BEACH WATER QUALITY IN WRIGHTSVILLE BEACH, NC.
Kellen Christine Lauer
A thesis submitted to the faculty at the University of North Carolina at Chapel Hill in partial fulfillment of the requirements for the degree of Master of Science in the Department of Marine
Sciences.
Chapel Hill 2015
ii © 2015
iii ABSTRACT
Kellen Christine Lauer: Quantitative analysis of fecal contamination in stormwater conveyance systems and the effects of storm drain discharge on beach water quality in Wrightsville Beach,
NC.
(Under the direction of Rachel T. Noble)
Fecal contamination in stormwater runoff is a concern for public health in coastal beach communities. Historical data collected by the Town of Wrightsville Beach has previously indicated that fecal indicator bacteria (FIB - Escherichia coli (E. coli) and Enterococcus spp.) concentrations frequently exceeded USEPA recommended water quality standards during and after storm events. Using both culture-based methods and quantitative PCR (qPCR), water samples from the storm drain systems of two problem watersheds were analyzed for FIB concentrations in addition to quantification of specific sources of fecal contamination from humans, gulls and dogs. Human and gull fecal contamination were both frequently quantified during the storm events (n=16). Significant correlations were observed between 1 hour
antecedent rainfall and the human-associated fecal Bacteroides marker (r = 0.17, p<0.05, n=149), indicating the potential for future real-time beach management decisions to be made based on rainfall. An across beach study was then conducted to assess the dispersion of the stormwater plume during a typical storm event. The data demonstrated that significant levels of
iv
ACKNOWLEDGEMENTS
I’d first like to thank Rachel Noble for her guidance and support throughout this entire
process. She put her trust in me and let me explore my ideas as they came. I have learned so much from working with all of the people and organizations involved with the different projects that Rachel gave me the opportunity to be a part of.
Thanks to the Noble Lab members who have helped me along the way - I could never have done this without you all. From helping me learn the ropes and answering all of my questions, to literally getting your hands dirty with me as we analyzed our not so glamorous samples. Also, special thanks to Denene Blackwood for all the methodological and molecular advice.
This work would not have been possible without the continuous input and assistance from Wrightsville Beach town managers. Not only was this project funded by the Town of Wrightsville Beach, but I’d specifically like to thank Jonathan Babin and Steve Dellies for their
v
TABLE OF CONTENTS
LIST OF FIGURES...vi
LIST OF TABLES...vii
LIST OF ABBREVITIONS...viii
INTRODUCTION...1
MATERIALS AND METHODS...6
Site characterization...6
Sample collection and processing...8
Specimen processing control and standard preparation...12
DNA extraction...13
qPCR analysis...14
Data analysis...17
RESULTS...19
Stormwater sampling FIB analysis...19
SPC analysis...21
Stormwater sampling MST analysis...22
Relationships to rainfall...26
Across beach Snyder St. dry weather and storm event assessment...27
DISCUSSION...31
CONCLUSIONS...38
vi
LIST OF FIGURES
Figure 1 – Aerial view of the barrier island encompassing the Town
of Wrightsville Beach...3 Figure 2 – Map of the locations of the Snyder St. and Iula St. watersheds
on Wrightsville Beach and sampling points along each of the storm
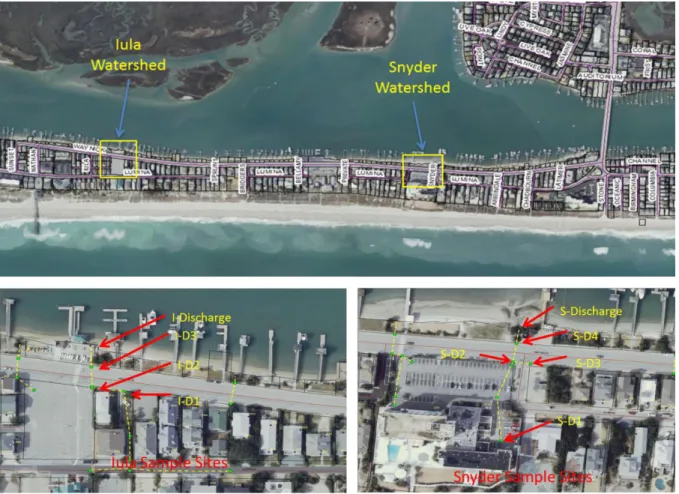
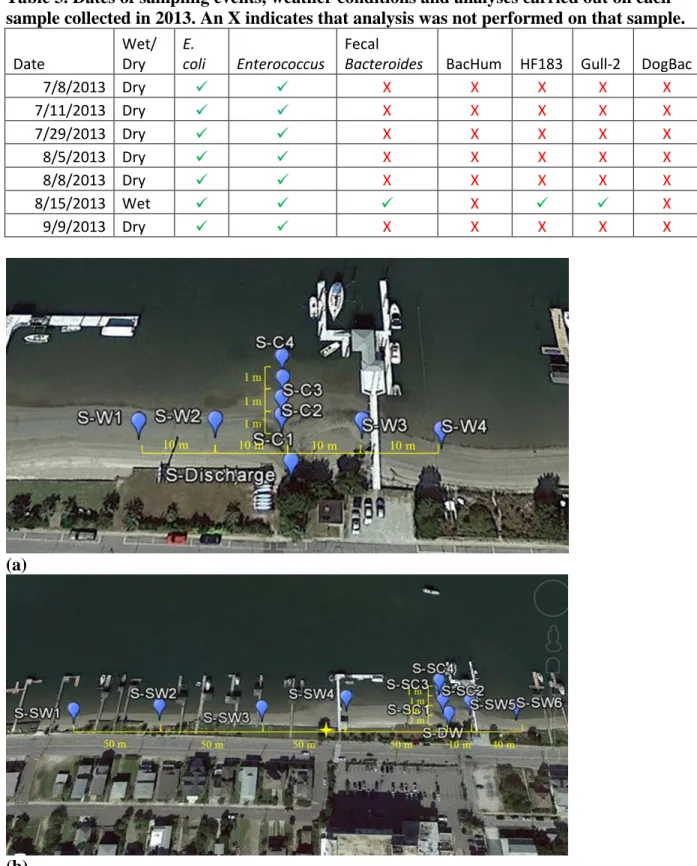
drains...8 Figure 3 - Sampling locations and distances between samples from the
Snyder St. watershed during (a) dry and (b) wet weather sampling
events...11 Figure 4 - Master curves for (a) fecal Bacteroides, (b) HF183, (c) BacHum,
and (d) Gull-2 with the equation of the line, R2, and efficiency
reported...17 Figure 5 - Mean (a) E. coli and (b) Enterococcus concentrations in drain
discharge waters of each storm sampled...21 Figure 6 - Geometric means of human markers measured in all sites of the
(a) Iula St. and (b) Snyder St. watersheds for each storm sampled...24 .
Figure 7 - Geometric means of gull contamination measured in all sites of
each watershed for each storm sampled...25 Figure 8 - Mean human and gull MST marker concentrations measured
(a) along the beach upcoast and downcoast of the Snyder St.
vii
LIST OF TABLES
Table 1 – USEPA water quality standards from 1986 and 2012...2 Table 2 – Dates of sampling events, weather conditions and analyses
carried out on each sample collected in 2011 and 2012...9 Table 3 - Dates of sampling events, weather conditions and analyses
carried out on each sample collected in 2013...11 Table 4 - Cycling conditions for each MST assay on the Bio-Rad CFX96TM
Real-Time System...15 Table 5 - MST assay information...16 Table 6 - Mean values and ranges of FIB concentrations for each storm
event sampled in 2011 and 2012...20 Table 7 - Mean values and ranges of all MST marker concentrations for each
storm sampled in 2011 and 2012...26 Table 8 - Significant relationships between MST marker concentration and
viii
LIST OF ABBREVIATIONS
ATCC American Type Culture Collection CE Cell equivalents
CT Cycle threshold
E. coli Escherichia coli
FIB Fecal indicator bacteria IMS Institute of Marine Sciences MPN Most probable number MST Microbial source tracking NEC Negative extraction control NTC No template control
PC Polycarbonate
SPC Specimen processing control TWB Town of Wrightsville Beach
qPCR Quantitative polymerase chain reaction
1
INTRODUCTION
Fecal contamination of recreational bathing waters is a concern for many coastal communities. Fecal indicator bacteria (FIB) such as Escherichia coli (E. coli, a subset of the fecal coliforms) and Enterococcus spp. are used globally as proxies of the presence of important viral and bacterial pathogens. A range of studies have shown that increased FIB concentrations can be indicative of higher rates of illnesses for beachgoers who have been exposed to
contaminated water or beach sand (e.g. Haile et al., 1999; Colford et al., 2007; Wade et al., 2008; Heaney et al., 2012). Although heightened FIB concentrations can stem from a variety of
sources, including leaking sewage infrastructure and wildlife, stormwater runoff is a major contributor of FIB and pathogens to coastal receiving water bodies (e.g. Ahn et al., 2005; Brownell et al., 2007; Reifel et al., 2009; Zhang et al., 2013).
When North Carolina coastal recreational waters are determined to be unsafe, a beach advisory must be issued to warn the public about the increased risk of illness from exposure to pathogens in the water or beach sands. Water quality standards are established by the USEPA, and are adopted by the states. The two types of water quality standards are a single sample threshold and a 30-day geometric mean. Standards are set based on acceptable risk for
swimming-related illness rates per 1,000 primary contact recreators. The State of North Carolina only uses Enterococci as an indicator of marine water quality, and currently uses standards from the 1986 published water quality criteria (USEPA, 1986). However, new suggested standards were published in by the USEPA in 2012 that have not yet been adopted for use in North
2
have FIB concentrations in exceedance of either the single sample threshold or the geometric mean, the beach will be posted and another sample will be taken. This process is repeated until the FIB concentrations have decreased enough to fall below the threshold, and the beach notification will be taken down.
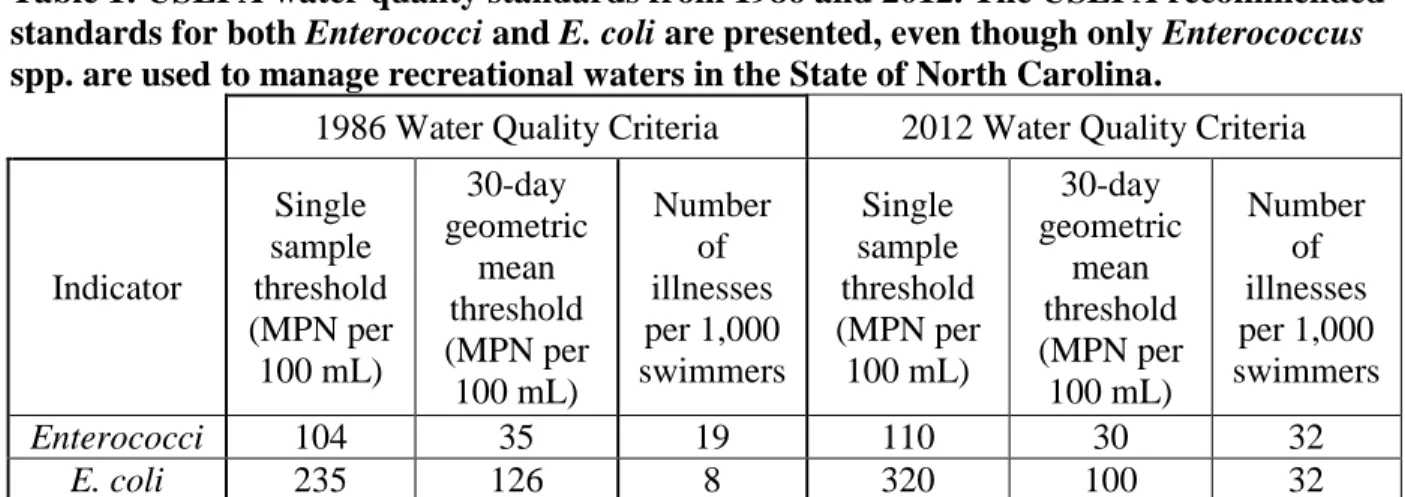
Table 1: USEPA water quality standards from 1986 and 2012. The USEPA recommended standards for both Enterococci and E. coli are presented, even though only Enterococcus spp. are used to manage recreational waters in the State of North Carolina.
1986 Water Quality Criteria 2012 Water Quality Criteria
Indicator Single sample threshold (MPN per 100 mL) 30-day geometric mean threshold (MPN per 100 mL) Number of illnesses per 1,000 swimmers Single sample threshold (MPN per 100 mL) 30-day geometric mean threshold (MPN per 100 mL) Number of illnesses per 1,000 swimmers
Enterococci 104 35 19 110 30 32
E. coli 235 126 8 320 100 32
The Town of Wrightsville Beach (TWB) has a history of being proactive to protect the public, most recently banning the smoking of cigarettes on town beaches. Wrightsville Beach is a popular vacation destination year round, but the population swells from around 2,500 to over 15,000 during the summer months (Imperial & Powell-Williams, 2006). Therefore, protecting the health of residents and visitors is of the utmost importance to town managers. In the past six years, an assessment of water quality during wet and dry weather conditions was conducted at the initiative of TWB managers. Town officials specifically noted that beach water quality during dry weather was excellent. However, during wet weather the areas proximal to the storm drain outfalls (sound side of the island, see Figure 1) were noted to be contaminated on a
3
Figure 1. Aerial view of the barrier island encompassing the Town of Wrightsville Beach.
Based upon this initial data collection, a collaborative study was designed to understand the dynamics of stormwater discharge related contamination. One major objective was to
4
The watersheds in Wrightsville Beach are extremely small and rectangular in size, with the majority of stormwater discharge conveyed to the sound side of the island. Due to the fact that each storm drain empties a small, tractable watershed, identification of the potential sources of fecal contamination in this system was manageable.
The major sources of fecal contamination in Wrightsville Beach include leaking sewage infrastructure, pets (dogs and cats) and sea birds (predominantly seagulls). Since Wrightsville Beach is a mostly residential barrier island with shallow groundwater tables, and therefore a shallow unsaturated zone for the coexistence of stormwater and sewage conveyance systems, inputs of human fecal contamination from damaged sewage infrastructure and/or illicit connections between pipes could be a potential source.
Another potential source of fecal contamination in this area is contamination from animal feces, particularly dogs and seagulls. When dog feces are not picked up, whether on a beach or around the neighborhood, they have the potential to be washed into the storm drains and
receiving waters during a storm event, contributing to the increased bacteria load. Gulls represent another potential source; they are common along the beaches and parking lots of Wrightsville Beach, and there is a bird sanctuary on the north end of the island to protect nesting shorebirds and provide untouched habitat for their survival. Dogs and gulls have been found to be the major animal sources of fecal contamination in several studies of beach water quality (e.g. Edge & Hill, 2007; Jiang et al., 2007; Wright et al., 2009; Zhu et al., 2011).
The aims of this study were three-fold. The first aim was to conduct microbial
contaminant assessments over a range of wet weather conditions, along with characterization of the FIB concentrations and sources of fecal contamination in two tractable watersheds in
5
microbial source tracking (MST) markers were used to determine the magnitude and sources of fecal contamination in the two watersheds. The second aim was to utilize the data generated over a range of storm conditions to determine if relationships to rainfall-based parameters were
6
MATERIALS AND METHODS
Site characterization
The Town of Wrightsville Beach is a 5.4 km2 barrier island community in New Hanover County, North Carolina (Figure 1). Just off the coast of Wilmington, it is a popular beach vacation destination. A year round population of about 2,500 people swells to an estimated 15,000 on weekends in the summer months, and up to 45,000-50,000 on holiday weekends (Imperial & Powell-Williams, 2006; Wrightsville Beach History). Forty-eight percent of the land in Wrightsville Beach is residential and 22% is undeveloped, mostly wetlands and Areas of Environmental Concern. Commercial land usage accounts for 12% of Wrightsville Beach, and land for recreational purposes accounts for 8% (Imperial & Powell-Williams, 2006).
Wrightsville Beach is bordered by the Atlantic Ocean to the southeast and Banks
7
NCAC). Such increases in bacteria concentrations have often been linked to storm drain discharge during and after storm events.
Small, tractable watersheds line Wrightsville Beach from north to south, delineated by storm drains which occur every hundred meters or so. These storm drain outfalls empty onto the sound side beaches, delivering stormwater runoff into Banks Channel. The storm drain
infrastructure includes over 14,000 m of piping, manholes and outfall pipes, of which the town owns only 42.5%. The rest is owned by North Carolina Department of Transportation, New Hanover County and private entities. There are also 152 m of open ditches and 762 linear meters of sheet flow area (Imperial & Powell-Williams, 2006).
8
Figure 2. Map of the locations of the Snyder St. and Iula St. watersheds on Wrightsville Beach and sampling points along each of the storm drains.
Sample collection and processing
9
Johnnie Mercer’s Pier). Samples were transported back to Wrightsville Beach Public Works on
ice and processed upon return, within regulatory holding times of water samples (USEPA, 2002a, b). The weather station used for hourly antecedent rainfall was located on the roof of the Wrightsville Beach Public Works building. This weather station is hosted by Weather
Underground with the station ID KNCWRIGH3. The rain gauge is a MK III (RainWiseInc., Trenton, ME) and it uses Weather View 32 v70 software (Weather Information Systems, Amity, OR).
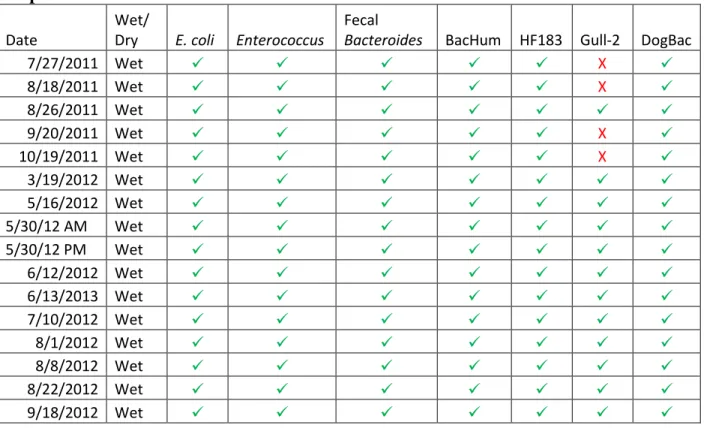
Table 2. Dates of sampling events, weather conditions and analyses carried out on each sample collected in 2011 and 2012. An X indicates that analysis was not performed on that sample.
Date
Wet/
Dry E. coli Enterococcus
Fecal
Bacteroides BacHum HF183 Gull-2 DogBac
7/27/2011 Wet X
8/18/2011 Wet X
8/26/2011 Wet
9/20/2011 Wet X
10/19/2011 Wet X
3/19/2012 Wet
5/16/2012 Wet
5/30/12 AM Wet
5/30/12 PM Wet
6/12/2012 Wet
6/13/2013 Wet
7/10/2012 Wet
8/1/2012 Wet
8/8/2012 Wet
8/22/2012 Wet
9/18/2012 Wet
FIB concentrations were determined using Defined Substrate TechnologyTM as per manufacturer guidelines (IDEXX Laboratories, Inc., Westbrook, ME). E. coli and Enterococcus
10
using the IDEXX MPN Generator Software Program 3.2, downloaded from the IDEXX
Laboratories website, which uses the Thomas MPN equation to calculate FIB densities (Thomas, 1942). All water samples were diluted 1:10 prior to analysis with deionized water. In addition, duplicate subsamples of water were filtered in volumes of 100 mL through 0.4 μm, 47mm diameter polycarbonate (PC) filters (HTTP-04700, Millipore Corp., Bedford, MA) for later use in quantitative PCR (qPCR) analysis. Filters were stored in sterilized 2 mL polypropylene screw cap tubes with 0.3±0.01 g of 0.1 mm zirconia/silica beads (BioSpec Products, Inc., Bartlesville, OK), henceforth referred to as bead tubes, at -20°C for less than two weeks. The bead tubes containing filters were transported to the laboratory at UNC’s Institute of Marine Sciences (IMS) in Morehead City, NC on dry ice and stored at -80°C until used for analysis.
11
Table 3. Dates of sampling events, weather conditions and analyses carried out on each sample collected in 2013. An X indicates that analysis was not performed on that sample.
Date
Wet/ Dry
E.
coli Enterococcus
Fecal
Bacteroides BacHum HF183 Gull-2 DogBac
7/8/2013 Dry X X X X X
7/11/2013 Dry X X X X X
7/29/2013 Dry X X X X X
8/5/2013 Dry X X X X X
8/8/2013 Dry X X X X X
8/15/2013 Wet X X
9/9/2013 Dry X X X X X
(a)
(b)
12
On August 15, 2013 beach water quality was characterized after a typical summer storm event. Grab samples were collected along the beach at a depth of 0.3 m at 200 m, 150 m, 100 m and 50 m downcoast of the pipe outfall, and 10 m and 50 m upcoast of the outfall. The four samples straight out into Banks Channel were collected from the same locations as the dry weather sampling (Figure 3b). Samples were transported directly to IMS on ice and processed immediately upon return in the same manner as described above.
Specimen processing control and standard preparation
For qPCR analysis, a specimen processing control (SPC) was used in order to measure the amount of sample loss during sample processing and matrix inhibition by adding a known amount of DNA at the beginning of the extraction step to each sample, calibration standard and a blank containing a PC filter which became the negative extraction control (NEC). Salmon Testes DNA (Sigma-Aldrich, St. Louis, MO) was added to buffer AE (QIAGEN, Valencia, CA) at a final concentration of 120 ng per 600 μL and is hereafter referred to as the Extraction Buffer. The primers and probe target a segment of the ribosomal RNA gene operon, internal transcribed spacer region 2 of chum salmon, Oncorhynchis keta as described in Haugland et al. 2005.
For the fecal Bacteroides qPCR assay, a genomic calibration standard was prepared from
13
Plasmid standards were used for BacHum, HF183, Gull-2 and DogBac qPCR assays. Standards were synthesized by GenScript (Piscataway, NJ). Gene sequences relating to the target sequences were synthesized and inserted into a linearized pUC57 vector which was cloned into DH5α competent cells. Plasmids containing the insert were extracted using Wizard®
Plus SV Minipreps DNA Purification System (Promega Corp., Madison, WI). Plasmids were linearized using Eco R1 digestion and verified via a 1% agarose gel in Tris-Acetate-EDTA buffer. The weight of purified plasmids was then determined spectrophotometrically (Nanodrop 2000c, Thermo Scientific, Waltham, MA). Nanograms of purified plasmids were converted to copy number by using a copy number calculator available from SciencePrimer
(http://scienceprimer.com/copy-number-calculator-for-realtime-pcr) which requires the amount of DNA (ng), and length of target (bases) to carry out the calculation. Linearized plasmids were diluted and stored at a concentration of 1x10⁸ copies per μL at -20°C in single-use aliquots. DNA extraction
14
was removed and added to a new 1.7 mL low retention microcentrifuge tube. The crude extracts were processed immediately, and could be stored at 4°C for up to one week. For samples that were further purified using the DNA EZ RW04 kit, the crude extract (typically 400 μL) was added to two times its volume of Binding Buffer (not to exceed 800 μL). Half of this solution was added to a DNAsureTM column which was placed in a 2 mL collection tube and centrifuged at 6,000 x g for one minute. The flow through was discarded and this process was repeated with the remaining crude extract and Binding Buffer solution. The column was transferred to a new collection tube and 500 μL of Washing Buffer was added to the column. The column was spun at 6,000 x g for one minute, and the flow through was again discarded. The wash step was repeated for a second time in the same manner. The column was spun again at 6,000 x g for one minute to remove all traces of Washing Buffer. The column was then transferred to a new collection tube and 50 μL of Elution Buffer was added directly to the center of the column, which was allowed to sit at room temperature for one minute. The tube was spun for one minute at 6,000 x g to elute the DNA. Eluted DNA was processed immediately and could be stored at -20°C for up to six months.
qPCR analyses
qPCR was used to quantify fecal Bacteroides spp. and Catellicoccus marimammalium
15
reconstituted in nuclease-free water or Supermix, primers, probe and 5 μL unknown or control. Each group of samples was run with the following: standard curve made from a three- or four-fold serial dilution of the extracted calibration standard in nuclease-free water, the NEC that was extracted with the samples being analyzed and a no template control (NTC) which contained only master mix reagents and nuclease-free water. All samples, standards and controls were run in duplicate, and 2 out of a total of 28 NTCs run came up positive. Table 4 describes the cycling conditions for each assay that was used and Table 5 contains individual assay information. Fecal
Bacteroides, BacHum, and Gull-2 assays utilized the TaqMan® chemistry for quantification, while HF183 and DogBac were SYBR Green-based assays.
Table 4. Cycling conditions for each MST assay on the Bio-Rad CFX96TM Real-Time System.
(1) Initial Denaturation
(2) Denaturation
(3) Annealing with
the Optics On Melt Curve
Assay Temp (°C) Time (minu tes) Temp (°C) Time (minu tes) Temp (°C) Time (minute s) Repea ted cycles (2&3) Holdi ng temp (°C) Holdin g Time (minut es) Final temp (°C) Temp increme nts (°C)
SPC 94 2:00 94 0:30 60 0:45 40
Fecal Bacteroi des
94 2:00 94 0:30 60 0:45 40
BacHum 94 2:00 94 0:15 62 1:00 40
Gull-2 94 2:00 94 0:15 62 1:00 40
HF183 98 2:00 98 0:02 55 0:05 40 60 0:10 95 0.2
16 Table 5. MST assay information.
Assay Name
Primers and Probe
Primer/Probe Sequence 5' to 3' Concentration (μM) Reference
Fecal
Bacteroides
BFDFor CGTTCCATTAGGCAGTTGGT 1
Converse et al., 2009
BFDRev CGTAGGAGTTTGGACCGTGT 1
BFD TM FAM FAM-CTGAGAGGAAGGTCCCCCACA TTGGA-BHQ-1 0.1 BacHum
BacHum-160f TGAGTTCACATGTCCGCATGA 1
Kildare et al., 2007
BacHum-241r
CGTTACCCCGCCTACTATCTAA
TG 1
BacHum-193p TM FAM FAM-TCCGGTAGACGATGGGGATGC GTT-BHQ-1 0.1 HF183 HS183
For ATCATGAGTTCACATGTCCG 0.25 Seurinck et
al., 2005 HS Rev
Seurinck TACCCCGCCTACTATCTAATG 0.25
Gull-2
Gull For TGCATCGACCTAAAGTTTTGA
G 1
Sinigallian o et al.,
2010 Gull Rev GTCAAAGAGCGAGCAGTTACT
A 1
Gull TM FAM BHQ FAM-CTGAGAGGGTGATCGGCCACA TTGGGACT-BHQ-1 0.1 DogBac DogBac
DF475F CGCTTGTATGTACCGGTACG 0.4
Sinigallian o et al.,
2010
Bac708R CAATCGGAGTTCTTCGTG 0.4
SPC
SPC For GGTTTCCGCAGCTGGG 1
Haugland et al., 2005
SPC Rev CCGAGCCGTCCTGGTCTA 1
SPC TM FAM FAM- AGTCGCAGGCGGCCACCGT-BHQ-1 0.1
17
was 77.5°C -78.5°C, and for DogBac this range of temperatures was 84.0°C – 85.0°C. A standard curve with an acceptable efficiency between 90% - 110% (calculated as E = (2 −
10−1/−𝑠𝑙𝑜𝑝𝑒) ∗ 100) and an R2
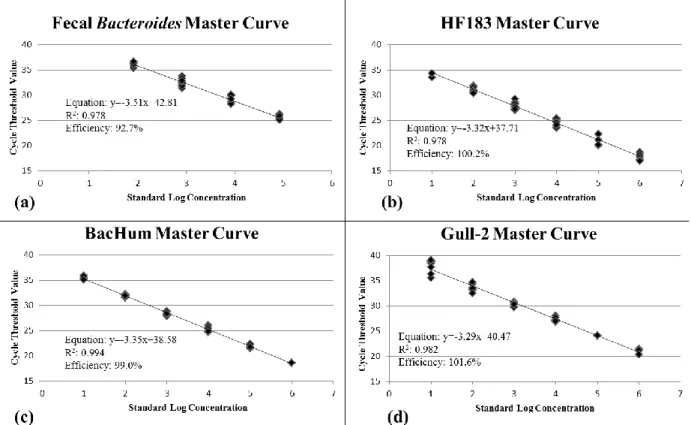
greater than 0.995 could not be obtained for the DogBac assay in this study. Therefore, the DogBac assay was only used to determine the presence or absence of dog fecal contamination in samples. Master curves for each assay used for quantification were created in Microsoft Excel® by combining all of the points from a minimum of four standard curves that were run with different sets of samples. The trend line function was used to get a linear regression of the cumulative points. Master curves are presented in Figure 4.
Figure 4. Master curves for (a) fecal Bacteroides, (b) HF183, (c) BacHum, and (d) Gull-2 with the equation of the line, R2, and efficiency reported.
Data analysis
18
19 RESULTS
Stormwater sampling FIB analysis
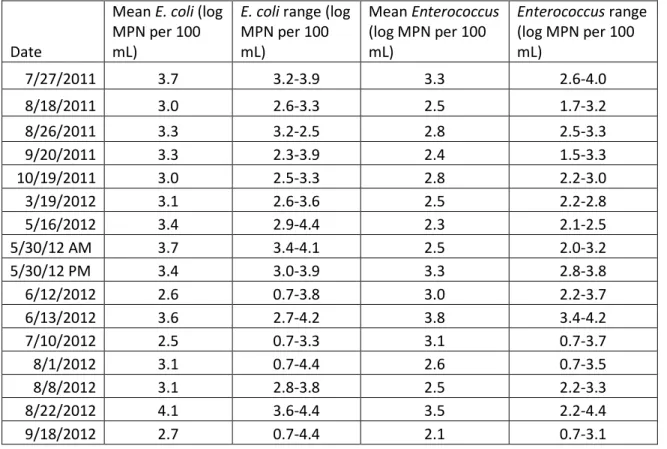
There were 16 storm events assessed from July 27, 2011 to September 18, 2012, providing a wide range of precipitation events representative of the region. Water samples collected from the storm drains during all storm events were high in FIB concentrations, exceeding 24,196 MPN per100 mL for E. coli in both watersheds and for Enterococcus in the Snyder St. watershed. The maximum Enterococcus concentration measured in the Iula St. watershed was 15,531 MPN per100 mL. Throughout the sampling, both E. coli and
Enterococcus values spanned the entire quantifiable range of the Quanti-tray®/2000 system. This ranges from non-detects as <10 MPN per 100 mL which were given a value of 5 MPN per 100 mL, to all positive wells as >24,196 MPN per 100 mL which were given a value of 24,197 MPN per 100 mL. This corresponds to a log concentration range of 0.7 MPN per 100 mL to 4.4 MPN per 100 mL. The mean and range of FIB concentrations for each storm sampled are in Table 6.
The concentrations of FIB in the storm drains exceeded USEPA recommended
20
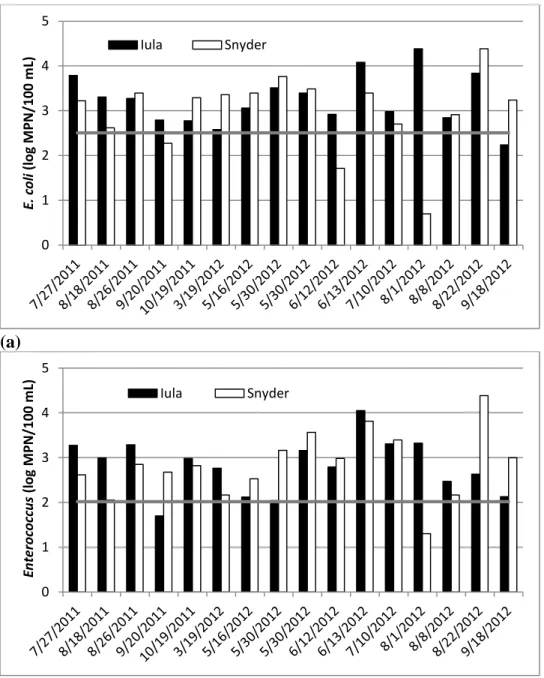
quantified with the methods used in this study, as the maximum quantifiable log concentration of the Quanti-tray®/2000 system is 4.4 MPN per 100 mL. At a maximum, 6.4% of E. coli samples were above the quantification limit and had the potential to have values over 100 times the E. coli single sample threshold. Water sampled from the discharge points of both pipes exceeded the standards for E. coli 87.5% of the time, and for Enterococcus 93.8% of the time. The FIB concentrations in this discharge for both watersheds are presented in Figure 5. The mean log concentrations of E. coli and Enterococcus in the discharge from the Snyder St. drain were 2.8 MPN per 100 mL and 2.7 MPN per 100 mL, respectively. For the Iula St. drain the mean log concentrations of FIB in the discharge were 3.2 MPN per 100 mL for E. coli and 2.8 MPN per 100 mL for Enterococcus. The mean concentrations between the two watershed were not significantly different for either E. coli (p = 0.64) or Enterococcus (p = 0.85).
Table 6. Mean values and ranges of FIB concentrations for each storm event sampled in 2011 and 2012.
Date
Mean E. coli (log MPN per 100 mL)
E. coli range (log MPN per 100 mL)
Mean Enterococcus (log MPN per 100 mL)
Enterococcus range (log MPN per 100 mL)
7/27/2011 3.7 3.2-3.9 3.3 2.6-4.0
8/18/2011 3.0 2.6-3.3 2.5 1.7-3.2
8/26/2011 3.3 3.2-2.5 2.8 2.5-3.3
9/20/2011 3.3 2.3-3.9 2.4 1.5-3.3
10/19/2011 3.0 2.5-3.3 2.8 2.2-3.0
3/19/2012 3.1 2.6-3.6 2.5 2.2-2.8
5/16/2012 3.4 2.9-4.4 2.3 2.1-2.5
5/30/12 AM 3.7 3.4-4.1 2.5 2.0-3.2
5/30/12 PM 3.4 3.0-3.9 3.3 2.8-3.8
6/12/2012 2.6 0.7-3.8 3.0 2.2-3.7
6/13/2012 3.6 2.7-4.2 3.8 3.4-4.2
7/10/2012 2.5 0.7-3.3 3.1 0.7-3.7
8/1/2012 3.1 0.7-4.4 2.6 0.7-3.5
8/8/2012 3.1 2.8-3.8 2.5 2.2-3.3
8/22/2012 4.1 3.6-4.4 3.5 2.2-4.4
21 (a)
(b)
Figure 5. Mean (a) E. coli and (b) Enterococcus concentrations in drain discharge waters of each storm sampled. Grey lines indicate the USEPA recommended single sample
thresholds for each bacteria type.
SPC analysis
The SPC was added in equal amounts to all samples and positive and negative controls (NEC), with the exception of the NTC. The NEC, which was a blank PC filter that was carried through the extraction process along with the samples, was used as a positive SPC and thus its cycle threshold (CT) value was used as guidance for determining whether samples were
0 1 2 3 4 5 E. col i (l og M P N/ 10 0 m L) Iula Snyder 0 1 2 3 4 5 E nt eroc occ us (l og M P N/ 10 0 m
22
inhibited. qPCR reactions can be inhibited by substances which can interfere with the
amplification efficiency of the DNA polymerase. In other words, if the CT value differed by a delay greater than 2.32 CT (equal to half a log difference in concentration), then the sample was considered inhibited and would be diluted according to how delayed the CT value was (Cao et al., 2012). After bead beating and GeneRite extraction, all storm samples from 2011-2012 were initially diluted 1:10 with nuclease-free water before SPC analysis, which was run as a separate assay from that of the target (fecal Bacteroides, BacHum, HF183, Gull-2 or DogBac) assays. Of 140 samples processed, only 10 samples (7%) showed inhibition at the 1:10 dilution and were diluted 1:10 further in an attempt to sufficiently reduce the concentration of the inhibitors in the sample. This gave them a final dilution of 1:100. Three of those samples did not have inhibition completely removed by the 1:100 dilution, so they were run in three serial dilutions: 1:100, 1:1,000 and 1:10,000. This would show a linear response (3.3 CT difference between each 10-fold dilution) if no inhibition was present or show a delayed response for those that sill showed inhibition. Samples from the 2013 storm event were diluted 1:5 with nuclease-free water after bead beating and GeneRite extraction. Only one sample required a final dilution of 1:10, which successfully relieved the inhibition.
Stormwater sampling MST analysis
Rather than relying on a single marker of human fecal contamination, a multiple and tiered marker quantification scheme covering a range of marker specificities and sensitivities was utilized. The markers utilized in this study, from least specific to most specific for human
23
from the Snyder St. watershed. Across both watersheds, 29 other samples (22.1%) from 10 of the storm events had two of the three human markers present. There were wide ranges of
concentrations of each marker quantified throughout the sampling effort, with extremely high levels measured in certain samples. Quantified fecal Bacteroides log concentrations ranged from 1.3 - 6.7 cell equivalents (CE) per 100 mL. Quantified BacHum log concentrations ranged from 0.3 – 4.5 copies per 100 mL. Lastly, quantified HF183 log concentrations ranged from 2.3 – 3.4 copies per 100 mL. When all storm samples were considered together in a Wilcoxon/Kruskal-Wallis rank sum test, there was no difference in the mean concentration of the fecal Bacteroides
marker between the two watersheds. The mean BacHum marker concentration was significantly higher in the Iula St. watershed than in the Snyder St. watershed (H=5.64, p = 0.0175). However, the mean HF183 marker concentration was significantly higher in the Snyder St. watershed than in the Iula St. watershed (H=7.20, p = 0.0073). Figure 6 shows the incidences of measured human contamination in both watersheds.
24 (a)
(b)
Figure 6. Geometric means of human markers measured in all sites of the (a) Iula St. and (b) Snyder St. watersheds for each storm sampled. Stars in (b) indicate the days when all three human markers were detected in a single sample. Error bars are standard error of all four or five sites.
25
single drain site within both watersheds. In the Iula St. watershed the Gull-2 marker was quantified in 58% of the 48 samples collected, with log concentrations ranging from 1.2 – 4.3 copies per 100 mL. However, the highest concentrations of gull fecal contamination were measured in the Snyder St. watershed, at the two sites closest to the Blockade Runner. Seventy-six percent of the 60 samples were positive for the Gull-2 marker, and log concentrations ranged from 1.2 – 6.5 copies per 100 mL (Figure 7). The mean log concentration of the Gull-2 marker measured in all samples from the Iula St. pipe was 1.1 copies per 100 mL. For the Snyder St. pipe this mean log concentration was 2.7 copies per 100 mL, which is 35 times higher. This difference in mean concentrations was found to be significant using a Wilcoxon/Kruskal-Wallis rank sum test (H=10.31, p = 0.0013). The mean and range of values for each MST marker in each storm event are summarized in Table 7.
26
Table 7. Mean values and ranges of all MST marker concentrations for each storm sampled in 2011 and 2012.
Date
Mean fecal Bacteroi des (log CE per 100 mL) fecal Bacteroi des range (log CE per 100 mL) Mean BacHu m (log copies per 100 mL) BacHum range (log copies per 100 mL) Mean HF183 (log copies per 100 mL) HF183 range (log copies per 100 mL) Mean Gull-2 (log copies per 100 mL) Gull-2 range (log copies per 100 mL) DogBac detect ed (# of sample s) 7/27/11 3.6 3.1-4.2 2.5 0.0-4.5 0.0 0.0-0.0 No 8/18/11 3.7 3.1-4.2 1.7 0.0-3.8 0.4 0.0-2.8 No 8/26/11 3.6 2.9-5.8 1.5 0.0-3.5 1.2 0.0-3.4 3.8 2.6-4.9 No 9/20/11 2.7 0.0-3.5 2.5 0.0-3.7 0.0 0.0-0.0 No 10/19/11 2.1 0.0-3.9 0.8 0.0-2.9 0.0 0.0-0.0 No 3/19/12 2.3 0.0-4.8 0.3 0.0-2.3 0.3 0.0-2.3 1.2 0.0-3.7 No 5/16/12 2.3 0.0-4.8 0.6 0.0-2.7 0.3 0.0-2.5 1.4 0.0-3.3 No 5/30/12
AM 2.9 0.0-6.7 0.7 0.0-2.9 0.3 0.0-2.5 3.2 0.0-5.5 1 of 9 5/30/12
PM 1.1 0.0-4.7 0.3 0.0-2.4 0.0 0.0-0.0 2.9 0.0-4.9 No 6/12/12 1.0 0.0-4.7 0.0 0.0-0.0 0.3 0.0-3.1 1.8 0.0-3.6 No 6/13/12 0.4 0.0-3.6 0.0 0.0-0.0 0.4 0.0-3.2 3.2 0.0-4.3 No 7/10/12 2.0 0.0-4.4 1.0 0.0-3.2 0.7 0.0-3.1 2.5 0.0-4.9 2 of 9
8/1/12 1.4 0.0-4.4 0.3 0.0-2.9 0.0 0.0-0.0 0.3 0.0-3.0 No 8/8/12 2.0 0.0-4.4 0.7 0.0-2.9 0.4 0.0-3.3 1.9 0.0-4.3 1 of 9 8/22/12 2.5 0.0-6.2 0.0 0.0-0.0 0.0 0.0-0.0 4.3 2.7-6.5 No 9/18/12 2.7 0.0-4.8 0 0.0-0.0 0 0.0-0.0 1.2 0.0-2.5 No Relationships to rainfall
Certain markers showed weak but significant correlations with antecedent rainfall totals. The following relationships correlate all storm samples collected over the course of the study to the antecedent rainfall totals for each storm event. Fecal Bacteroides marker concentrations had a significant positive relationship (r(149)=0.17, p=0.039) with 1 hour antecedent rainfall. The Gull-2 marker was significantly correlated to 1 hour (r(149)=0.21, p=0.008), 6 hour
27
significantly correlated with 24 hour (r(149)=0.21, p=0.011) and 48 hour (r(149)=0.21, p=0.010) antecedent rainfall. On the contrary, there was a significant negative relationship between fecal
Bacteroides marker concentrations and 24 hour (r(149)=0.25, p=0.002) and 48 hour
(r(149)=0.25, p=0.002) antecedent rainfall. Significant relationships are summarized in Table 8. Table 8: Significant relationships between MST marker concentration and antecedent rainfall totals. Green shaded boxes are positive relationships and red shaded boxes are negative relationships. 1 hour antecede nt rainfall 6 hour anteceden t rainfall 12 hour anteceden t rainfall 18 hour anteceden t rainfall 24 hour anteceden t rainfall 48 hour anteceden t rainfall Fecal
Bacteroides N 151 151 151
r-value 0.17 0.25 0.25
p-value 0.039 0.002 0.002
Gull-2 N 151 151 151 151 151
r-value 0.21 0.23 0.22 0.23 0.31
p-value 0.008 0.005 0.006 0.005 0.0001
Enterococc
us N 151 151
r-value 0.21 0.21
p-value 0.011 0.01
Across beach Snyder St. dry weather and storm event assessment
Due to the higher prominence of human and gull contamination measured in the Snyder St. watershed, a spatial examination of the beach surrounding the drain discharge point was carried out between July and September 2013 to determine the effect that the storm drain discharge would have on beach locations where people would be actively recreating. Sampling upcoast and downcoast of the drain outfall and straight out into Banks Channel took place on multiple occasions in dry weather and an across beach storm sampling event occurred on August 15, 2013.
28
recreational waters for either E. coli or Enterococcus. FIB were below the detection limit of the Quanti-tray®/2000 system (10 MPN per 100 mL) in 12 of 48 samples (25.0%) for E. coli and 25 of 48 samples (52.1%) for Enterococcus. These samples were given a value of 5 MPN per 100 mL for statistical analysis.
The storm event sampled on August 15, 2013 was a typical summer storm for Wrightsville Beach. Rainfall began just before 4:00 AM and continued until 12:00 PM, and storm drains were actively discharging into Banks Channel. The average rainfall rate during the storm was 3.3 mm/hr and the total amount of rainfall in this time period was a moderate 26.4 mm. Samples from around the Snyder St. drain were collected just as the rain was ending so that measurements explained the impacts of the storm event as a whole, and samples would be indicative of what beachgoers are exposed to when swimming immediately after the storm.
In the drain discharge, the E. coli log concentration was 3.4 MPN per 100 mL and the
Enterococcus log concentration was 3.1 MPN per 100 mL (over 10 times the single sample threshold). Even higher log concentrations of Enterococcus were measured at the three sites in Banks Channel closest to the drain outfall (3.7, 3.6 and 3.6 MPN per 100 mL). These storm samples along the beach were significantly higher than the dry weather samples that had also been collected along the beach (Wilcoxon/Kruskal-Wallis rank sum test, H=26.7 for both E. coli
and Enterococcus, p<0.001) There was a significant lineardecrease in E. coli (r(3)=0.95,
p=0.047) in the downcoast samples as the distance from the drain outfall increased, at a rate of -8.5 MPN per m. However, this relationship was not significant for Enterococcus (p = 0.25) as concentrations did not begin to decrease until 150 m downcoast. Even with the observed
29
Human fecal contamination was quantified in the drain discharge through positive results for multiple human-associated markers, fecal Bacteroides and HF183, at log concentrations of 4.0 CE per 100 mL and 3.7 copies per 100 mL, respectively (Figure 8). This human
contamination was also quantified at the four sites closest to the discharge point, the two nearest downcoast sites (S-SW4 and S-SW3, up to 100 m downcoast) and the two nearest sites straight out from the drain into Banks Channel (S-SC1 and S-SC2). The human markers were then below detection limits at sites farther from the discharge.
Log transformed gull contamination was quantified to be 6.0 copies per 100 mL of drain discharge, and measured in all water samples taken upcoast (up to 50 m) and downcoast (up to 200 m) of the storm drain, and all sites straight out into Banks Channel (Figure 8a and b). Because all sites were positive for gull contamination, this indicates that the Snyder St. storm drain is not the only source of gull contamination to Banks Channel. However, the log
concentration of the Gull-2 marker at the nearest upcoast site (3.9 copies per 100 mL) was over 100 times less than the log concentration in the discharge. There was also a significant linear decrease in the Gull-2 marker concentration at successive downcoast sites from the drain outfall (at a rate of -433 copies per m) as the discharge was diluted (r(3)=0.99, p=.005).
FIB and Gull-2 marker concentrations were measured in gull feces collected from Wrightsville Beach during the time of this study (Lauer et al., in prep.). The 10 individual gulls sampled had a mean Gull-2 marker log concentration of 11.7 copies per g of feces. Comparing that concentration to the measured Gull-2 marker concentration in the drain discharge during this storm event, it equates to 2.0𝑥10−5 g of gull feces per 100 mL of drain discharge water. The log
30
discharge, gull fecal contamination only accounts for 0.1% of the Enterococcus quantified in this storm event.
(a)
(b)
31 DISCUSSION
Storm events of varying intensity in Wrightsville Beach lead to orders of magnitude increases in FIB concentrations in the storm drain systems and in receiving waters of Banks Channel. Ubiquitously high FIB concentrations after storm events have also been measured in previous studies conducted in North Carolina (e.g. Hathaway et al., 2010; Parker et al., 2010; Stumpf et al., 2010; Converse et al., 2011; Hathaway & Hunt, 2010), demonstrating that this is not a unique problem to Wrightsville Beach. However, FIB exceedances of 10 or 100 times the USEPA recommended single sample threshold were commonly observed throughout the drain system and discharge waters. Such high concentrations of bacteria pose a threat to the health of those who visit the sound side beaches after a storm event.
32
remained high and averaged 3.9 MPN per100 g dry weight throughout all dry weather sampling events. Enterococcus speciation results showed that Enterococcus casseliflavus, a species that is known to be plant-associated, was the most common Enterococcus species quantified in the drain sediment (Lauer, unpublished data). This indicates that perhaps a portion of the measured
Enterococcus concentrations in the storm drain may not be associated with fresh fecal material. Even though there might be increasingly elevated FIB concentrations in the storm drains due to persistence or growth, it is not to say that growth is the sole cause of these high
concentrations measured during the storm events. Despite the fact that the human markers were ephemeral in this study, each marker was detected over the entire length of the sampling period in both watersheds. Therefore, we know that human contamination is one frequent contributor to the FIB signal measured during storm events. Sauer et al. found similar results in a 2011 study of human contamination in storm drain outfalls around Milwaukee, WI. All 45 drains studied were positive for human contamination at least once, with positive results measured in each drain ranging from 11%-100% of storm events. It appears that some sort of human sewage
contamination is inevitably present in densely settled areas.
Gull feces were confirmed to be the most widespread contributing source of
33
gulls through public education are both strategies which could be put into place in an attempt to reduce the fecal contamination from the gulls. A study published by Converse et al. in 2012 showed that using highly trained dogs to chase and deter gulls from a Lake Michigan beach resulted in a 50% decrease in gulls and a 38% and 29% reduction in Enterococcus and E. coli
concentrations, respectively. Measures were taken to ensure that there was no additional fecal contamination from the dogs used in this study.
Higher mean concentrations of gull contamination in the Snyder St. watershed might be attributable to the locations of garbage dumpsters in the parking lot of the Blockade Runner. If gulls are congregating around these dumpsters to feed, and they then leave their feces behind in the parking lot, it would explain the higher rate of detection and larger concentrations of the Gull-2 marker quantified in the Snyder St. drain. Perhaps a gull survey or installation of a webcam could be used to determine if in fact there is a convergence of gulls around these
dumpsters. If so, the Blockade Runner could then implement measures to reduce gull scavenging with the aim of decreasing the input of gull feces into the storm drain system beneath their parking lot.
34
Finding significant positive relationships between antecedent rainfall and FIB and MST marker concentrations is an important result of this study. Current methods for FIB
quantification can take 24-96 hours for results to become available, which does not allow for a timely warning to be issued to the public on the state of the beach water quality. By the time the results are obtained, the beach management decision reflects the water quality conditions on the previous day, not the current conditions experienced by beachgoers. A potential solution to this problem using the results from this study could be implementing a real-time beach management decision to presumptively post the beaches based on rainfall amounts. Fecal Bacteroides marker concentrations, which were correlated with 1 hour antecedent rainfall, have previously been shown to be a predictor of illness occurrence after exposure to contaminated waters and sand (Wade et al., 2010; Heaney et al., 2012). After about 12 mm (or 0.45 inches) of rainfall in one hour there were consistently high concentrations of the fecal Bacteroides marker in samples, as only two samples were a non-detects above this amount of rainfall. Half an inch of rain in one hour could serve as a threshold for town managers to make a decision to post the beaches or issue a warning to the general public of suspected elevated bacteria concentrations. Such a policy would be more protective of public health since a decision could be made immediately, before most public exposure would occur, as opposed to waiting 24 hours for the results of culture-based methods.
Other significant positive relationships include gull fecal material and all time points of antecedent rainfall up to 24 hours, indicating immediate and continuous delivery of gull fecal contamination throughout even a prolonged storm event. This supports our findings of persistent and widespread gull contamination throughout both watersheds, independent of storm
35
Enterococcus concentrations, the significant relationships between measured Enterococcus and 24 and 48 hour antecedent rainfall highlight the importance of storms in delivering this
contamination to the receiving waters, regardless of the source. Surprisingly, a negative relationship with the fecal Bacteroides marker and 24 and 48 hour rainfall was discovered in these data. This relationship could indicate a flushing of built-up bacteria from the storm drains with prolonged rainfall in a 24 or 48 hour period. Once the bacteria that has been deposited into the storm drains during dry weather is flushed out into receiving waters, the input of fresh fecal contamination may no longer be high enough to maintain the elevated bacteria concentrations measured in the first few hours of a storm event.
The focused study on beach water quality surrounding the Snyder St. storm drain outfall in 2013 found water quality to be excellent during dry weather. Of all 48 samples collected over the six dry days sampled, no water sample was over the single sample threshold for either E. coli
or Enterococcus. Although Banks Channel is lined with docks and boat slips, illicit dumping of boat holding tanks does not appear to be an issue that is negatively impacting the water quality in this area. These results demonstrate that water quality issues in Wrightsville Beach are driven by stormwater runoff conveying contaminants to the receiving waters via storm drain systems.
36
presence of human contamination in the storm drain discharge and surrounding area of Banks Channel is a cause for concern for swimmers in the vicinity of the drain outfall, although dilution does appear to reduce human markers below quantifiable levels by 150 m downcoast. There was no more human contamination introduced by the additional storm drain in the sample area, again pinpointing the source of the problems to the Snyder St. drain.
Although the Gull-2 marker concentration did show a significant decrease as the distance downcoast of the drain outfall increased, the two samples upcoast of the drain were also positive for the Gull-2 marker. Since there was no indication from FIB concentrations or human
contamination that these sites were impacted by the Snyder St. discharge, it is assumed that gull fecal contamination is not exclusively delivered into Banks Channel from the storm drains. However, concentrations of gull contamination upcoast of the drain were over 100 times less than the concentration measured in the discharge.
In this August 2013 storm event, gull feces only explained 0.1% of the Enterococcus
concentration measured in the drain discharge. This was only at one point in time, so measuring discharge throughout an entire storm event would allow for a more complete understanding of FIB and feces loading over the length of the storm event. There was confirmed human
contamination in the discharge which would contribute to the Enterococcus concentrations as well; however, that might not be enough to explain the remaining 99.9% of the measured
Enterococcus. More research into the Enterococcus contributions from human fecal
contamination and any other possible sources would be needed to determine if these findings give support to the notion of Enterococcus growth within the storm drain environment.
37
38
CONCLUSIONS
When storm drains were not actively discharging, there were no FIB exceedances ever
measured in Banks Channel.
Storm events of almost any size in Wrightsville Beach cause a rapid and extreme spike in
FIB levels which are delivered into the receiving waters of Banks Channel.
Fecal contamination from gulls is a widespread problem in Wrightsville Beach, while
human contamination has an ephemeral presence and dog contamination is not as well understood.
Implementing a presumptive beach advisory notification system based on rainfall may be
the most effective way to protect public health by keeping beachgoers out of the water when the water quality has been degraded because of a storm event.
During the across beach storm event study, water up to 200 meters downcoast of the
39
REFERENCES
Ahn, J. H., Grant, S. B., Surbeck, C. Q., DiGiacomo, P. M., Nezlin, N. P., & Jiang, S. (2005). Coastal water quality impact of stormwater runoff from an urban watershed in southern California. Environmental Science & Technology, 39(16), 5940–53.
Albarnaz, J. D., Toso, J., Corrêa, A. a, Simões, C. M. O., & Barardi, C. R. M. (2007). Relationship between the contamination of gulls (Larus dominicanus) and oysters (Crassostrea gigas) with Salmonella serovar Typhimurium by PCR-RFLP. International Journal of Environmental Health Research, 17(2), 133–40.
Anderson, K. L., Whitlock, J. E., & Harwood, V. J. (2005). Persistence and differential survival of fecal indicator bacteria in subtropical waters and sediments. Applied and Environmental Microbiology, 71(6), 3041–48.
Blackwood, A. D. (2014). Personal Communication.
Brownell, M. J., Harwood, V. J., Kurz, R. C., McQuaig, S. M., Lukasik, J., & Scott, T. M. (2007). Confirmation of putative stormwater impact on water quality at a Florida beach by microbial source tracking methods and structure of indicator organism populations. Water Research, 41(16), 3747–57.
Cao, Y., Griffith, J. F., Dorevitch, S., & Weisberg, S. B. (2012). Effectiveness of qPCR permutations, internal controls and dilution as means for minimizing the impact of inhibition while measuring Enterococcus in environmental waters. Journal of Applied Microbiology, 113, 66–75.
Classification on Shellfish Growing Waters. North Carolina Administrative Code. Title 15A Chapter 18A.0902. September 1, 1990.
Colford, J. M., Wade, T. J., Schiff, K. C., Wright, C. C., Griffith, J. F., Sandhu, S. K., Burns, S., Sobsey, M., Lovelace, G., & Weisberg, S. B. (2007). Water quality indicators and the risk of illness at beaches with nonpoint sources of fecal contamination. Epidemiology, 18(1), 27–35.
Converse, R. R., Blackwood, A. D., Kirs, M., Griffith, J. F., & Noble, R. T. (2009). Rapid QPCR-based assay for fecal Bacteroides spp. as a tool for assessing fecal contamination in recreational waters. Water Research, 43(19), 4828–37.
Converse, R. R., Piehler, M. F., & Noble, R. T. (2011). Contrasts in concentrations and loads of conventional and alternative indicators of fecal contamination in coastal stormwater. Water Research, 45(16), 5229–40.
40
J. (2012). Dramatic improvements in beach water quality following gull removal.
Environmental Science & Technology, 46(18), 10206–13. Dellies, S., & Babin, J. (2011). Personal Communication.
Edge, T. A., & Hill, S. (2007). Multiple lines of evidence to identify the sources of fecal pollution at a freshwater beach in Hamilton Harbour, Lake Ontario. Water Research, 41, 3585–94.
Ferguson, D. M., Moore, D. F., Getrich, M. A., & Zhowandai, M. H. (2005). Enumeration and speciation of enterococci found in marine and intertidal sediments and coastal water in southern California. Journal of Applied Microbiology, 99(3), 598–608.
Haile, R. W., Witte, J. S., Gold, M., Cressey, R., Mcgee, C., Milikan, R. C., Glasser, A., Harawa, N., Ervin, C., Harmon, A., Harper, J., Dermand, J., Alamillo, J., Barrett, K., Nides, M., & Wang, G. (1999). The health effects of swimming in ocean water contaminated by storm drain runoff. Epidemiology, 10(4), 355–63.
Hathaway, J. M., Hunt, W. F., & Simmons, O. D. I. (2010). Statistical evaluation of factors affecting indicator bacteria in urban storm-water runoff. Journal of Environmental Engineering, 136(12), 1360–68.
Hathaway, J. M., & Hunt, W. F. (2010). Evaluation of first flush for indicator bacteria and total suspended solids in urban stormwater runoff. Water, Air, & Soil Pollution, 217(1-4), 135– 47.
Haugland, R. A., Siefring, S. C., Wymer, L. J., Brenner, K. P., & Dufour, A. P. (2005). Comparison of Enterococcus measurements in freshwater at two recreational beaches by quantitative polymerase chain reaction and membrane filter culture analysis. Water Research, 39, 559–68.
Heaney, C. D., Sams, E., Dufour, A. P., Brenner, K. P., Haugland, R. A., Chern, E., Wing, S., Marshall, S., Love, D. C., Serre, M., Noble, R., & Wade, T. J. (2012). Fecal indicators in sand, sand contact, and risk of enteric illness among beachgoers. Epidemiology, 23(1), 95– 106.
Imperial, M. T., & Powell-Williams, M. (2006). Town of Wrightsville Beach 2005 CAMA Land Use Plan. Wrightsville Beach, NC.
Jiang, S. C., Chu, W., Olson, B. H., He, J. W., Choi, S., Zhang, J., Le, J. Y., & Gedalanga, P. B. (2007). Microbial source tracking in a small southern California urban watershed indicates wild animals and growth as the source of fecal bacteria. Applied Microbiology and
41
Kildare, B. J., Leutenegger, C. M., McSwain, B. S., Bambic, D. G., Rajal, V. B., & Wuertz, S. (2007). 16S rRNA-based assays for quantitative detection of universal, human-, cow-, and dog-specific fecal Bacteroidales: a Bayesian approach. Water Research, 41(16), 3701–15. Kinzelman, J., McLellan, S. L., Amick, A., Preedit, J., Scopel, C. O., Olapade, O., Gradus, S.,
Singh, A., & Sedmak, G. (2008). Identification of human enteric pathogens in gull feces at Southwestern Lake Michigan bathing beaches. Canadian Journal of Microbiology, 54, 1006–15.
Lauer, K. C., Babin, J., Dellies, S., & Noble, R. T. In prep. Assessing fecal bacteria concentration and the sensitivity and specificity of MST assays in gull and dog fecal samples from Wrightsville Beach, NC.
Layton, B. A., Cao, Y., Ebentier, D. L., Hanley, K., Ballesté, E., Brandão, J., Byappanahalli, M., Converse, R., Farnleitner, A. H., Gentry-Shields, J., Gidley, M. L., Gourmelon, M., Lee, C. S., Lee, J., Lozach, S., Madi, T., Meijer, W. G., Noble, R., Peed, L., Reischer, G. H., Rodrigues, R., Role, J. B., Schriewer, A., Sinigalliano, C., Srinivasan, S., Stewart, J., Van De Werfhorst, L. C., Wang, D., Whitman, R., Wuertz, S., Jay, J., Holden, P. A., Boehm, A. B., Shanks, O., & Griffith, J. F. (2013). Performance of human fecal anaerobe-associated PCR-based assays in a multi-laboratory method evaluation study. Water Research, 47(18), 6897–908.
Lee, C. M., Lin, T. Y., Lin, C. C., Kohbodi, G. A, Bhatt, A., Lee, R., & Jay, J. A. (2006). Persistence of fecal indicator bacteria in Santa Monica Bay beach sediments. Water Research, 40(14), 2593–602.
Lévesque, B., Brousseau, P., Bernier, F., Dewailly, É., & Joly, J. (2000). Study of the bacterial content of ring-billed gull droppings in relation to recreational water quality. Water Research, 34(4), 1089–96.
Lu, J., Ryu, H., Santo Domingo, J. W., Griffith, J. F., & Ashbolt, N. (2011). Molecular detection of Campylobacter spp. in California gull (Larus californicus) excreta. Applied and
Environmental Microbiology, 77(14), 5034–9.
Marino, R. P., & Gannon, J. J. (1991). Survival of fecal coliforms and fecal streptococci in storm drain sediment. Water Research, 25(9), 1089–98.
Noble, R. T., & Fuhrman, J. A. (1998). Use of SYBR Green I for rapid epifluorescence counts of marine viruses and bacteria. Aquatic Microbial Ecology, 14, 113–18.
North Carolina Division of Marine Fisheries. Shellfish Sanitation Section. www.ncfisheries.net. Parker, J. K., McIntyre, D., & Noble, R. T. (2010). Characterizing fecal contamination in
42
Pote, J., Haller, L., Kottelat, R., Sastre, V., Arpagaus, P., & Wildi, W. (2009). Persistence and growth of faecal culturable bacterial indicators in water column and sediments of Vidy Bay, Lake Geneva, Switzerland. Journal of Environmental Sciences, 21(1), 62–69.
Reifel, K. M., Johnson, S. C., DiGiacomo, P. M., Mengel, M. J., Nezlin, N. P., Warrick, J. A., & Jones, B. H. (2009). Impacts of stormwater runoff in the Southern California Bight:
Relationships among plume constituents. Continental Shelf Research, 29(15), 1821–35. Sauer, E. P., Vandewalle, J. L., Bootsma, M. J., & McLellan, S. L. (2011). Detection of the
human specific Bacteroides genetic marker provides evidence of widespread sewage contamination of stormwater in the urban environment. Water Research, 45(14), 4081–91. Seurinck, S., Defoirdt, T., Verstraete, W., & Siciliano, S. D. (2005). Detection and quantification
of the human-specific HF183 Bacteroides 16S rRNA genetic marker with real-time PCR for assessment of human faecal pollution in freshwater. Environmental Microbiology, 7(2), 249–59.
Sinigalliano, C. D., Fleisher, J. M., Gidley, M. L., Solo-Gabriele, H. M., Shibata, T., Plano, L. R. W., Elmir, S. M., Wanless, D., Bartkowiak, J., Boiteau, R., Withum, K., Abdelzaher, A. M., He, G., Ortega, C., Zhu, X., Wright, M. E., Kish, J., Scott, T., Backer, L. C., & Fleming, L. E. (2010). Traditional and molecular analyses for fecal indicator bacteria in non-point source subtropical recreational marine waters. Water Research, 44(13), 3763–72.
Stumpf, C. H., Piehler, M. F., Thompson, S., & Noble, R. T. (2010). Loading of fecal indicator bacteria in North Carolina tidal creek headwaters: hydrographic patterns and terrestrial runoff relationships. Water Research, 44(16), 4704–15.
Thomas, H. A. (1942). Bacterial densities from fermentation tube tests. American Water Works Association. 34, 572-76
United States Environmental Protection Agency. (1986). Quality criteria for water 1986. EPA 440/5-86-001. USEPA. Washington, DC.
United States Environmental Protection Agency. (2002a). Method 1600: Enterococci in Water by Membrane Filtration Using membrane-Enterococcus Indoxyl-β-D-Glucoside Agar (mEI). EPA 821-R-02- 022. USEPA. Washington, DC.
United States Environmental Protection Agency. (2002b). Method 1604: Total Coliforms and
Escherichia coli in Water by Membrane Filtration Using a Simultaneous Detection Technique (MI Medium). EPA 821-R-02-024. USEPA. Washington, DC.
United States Environmental Protection Agency. (2012). Recreational Water Quality Criteria. EPA 820-F-12-058. USEPA. Washington, DC.
43
illness: results using a rapid assay of recreational water quality. Epidemiology, 19(3), 375– 83.
Wade, T. J., Sams, E., Brenner, K. P., Haugland, R., Chern, E., Beach, M., Wymer, L., Rankin, C. C., Love, D., Li, Q., Noble, R., & Dufour, A. P. (2010). Rapidly measured indicators of recreational water quality and swimming-associated illness at marine beaches: a prospective cohort study. Environmental Health, 9(1), 66.
Wright, M. E., Solo-Gabriele, H. M., Elmir, S., & Fleming, L. E. (2009). Microbial load from animal feces at a recreational beach. Marine Pollution Bulletin, 58(11), 1649–56.
Wrightsville Beach History. http://www.wbmuseum.com/History.htm
Zhang, W., Wang, J., Fan, J., Gao, D., & Ju, H. (2013). Effects of rainfall on microbial water quality on Qingdao No. 1 Bathing Beach, China. Marine Pollution Bulletin, 66, 185–90. Zhu, X., Wang, J. D., Solo-Gabriele, H. M., & Fleming, L. E. (2011). A water quality modeling