Architecture, Performance
and Best Practices in
VMware vSphere
®
5
Performance Study
T E C H N I C A L W H I T E P A P E RTable of Contents
Introduction . . . . 4
Architecture . . . . 4
Virtual Device State. . . .4
Networking and SCSI Device Connections . . . .4
Physical Memory of a Virtual Machine . . . .5
Phase 1: Guest Trace Phase . . . .5
Phase 2: Precopy Phase . . . .5
Phase 3: Switchover Phase . . . .5
Enhancements in vSphere 5 . . . . 6
Using Multiple Network Adaptors for vMotion . . . .6
Metro vMotion . . . .6
Stun During Page Send (SDPS) . . . .6
Other Performance Optimizations in vSphere 5 . . . .6
Performance Test Configuration and Methodology . . . .7
Test Configuration . . . 7
Measuring vMotion Performance . . . 7
Capturing Timing Details . . . .8
vMotion Performance in a Web Environment . . . . 8
Test Methodology . . . .8
Load-Generation Software . . . .8
Test Scenario . . . .8
Test Results . . . .9
vMotion Performance in an Email/Messaging Environment . . . . 13
Test Methodology . . . .13
Load-Generation Software . . . .13
Exchange Server Configuration . . . .13
Task Queue Length . . . .13
Number of Task Exceptions . . . .13
Test Results . . . .14
vMotion Performance in a Database Environment . . . . 15
Test Methodology . . . .15
Load-Generation Software . . . .15
vMotion Performance in a VDI/Cloud-Oriented Business Environment . . . . 18
Test Methodology . . . 18
Load-Generation Software . . . 18
Test Scenario . . . 19
Test Results . . . 19
vMotion Best Practices . . . . 22
Conclusion . . . . 23
Appendix A: Hardware Setup . . . . 24
Appendix B: Workload Details . . . . 25
About the Author . . . . 26
Introduction
VMware vSphere® vMotion® enables the live migration of virtual machines from one VMware vSphere® 5 host to another, with no perceivable impact to the end user. vMotion is a key enabler of a number of VMware
technologies, including vSphere Distributed Resource Scheduler (DRS) and vSphere Distributed Power Management (DPM). vMotion brings invaluable benefits to administrators—it helps prevent server downtime, enables troubleshooting and provides flexibility.
Although vMotion has been used successfully since the earliest versions of VMware ESX®, vSphere 5 incorporates a number of performance enhancements to make it easier than ever to enable vMotion on even the largest virtual machines running heavy-duty, enterprise-class applications, with minimal overhead.
This white paper presents a brief description of the vMotion technology, performance enhancements in vSphere 5, and performance implications of this technology with data from a wide variety of Tier 1 application workloads. It also presents the data that quantifies the performance differential between vSphere 5 and vSphere 4.1. Finally, it describes several best practices to follow when using vMotion.
Architecture
Live migration of a virtual machine involves transferring the entire execution state of the virtual machine from the source vSphere host to the destination vSphere host over a high-speed network. The execution state primarily consists of three components:
1. The virtual device state, including the state of the CPU, network and disk adaptors, SVGA, and so on 2. External connections with devices, including networking and SCSI devices
3. The virtual machine’s physical memory
Here we briefly discuss how vMotion technology handles the challenges associated with the transfer of these different states of a virtual machine.
Virtual Device State
vMotion leverages the ability of vSphere to serialize the virtual device state of the virtual machine, which is generally less than 8MB in size. In some cases, it can grow to in excess of 128MB, which can be transferred very quickly over a high-speed network.
Networking and SCSI Device Connections
The virtual networking architecture of vSphere, centered on the concepts of virtual switch and virtual Ethernet network interface card (vNIC), makes it very easy to preserve existing networking connections, even after a virtual machine is migrated to a different machine. Because each vNIC has its own MAC address that is
independent of the physical network adaptor’s MAC address, the virtual machines can be migrated between the hosts and still keep the networking connections alive as long as both the source and destination hosts are on the same subnet. The migration is done efficiently so the networking connections do not time out. After the virtual machine is migrated, the destination vSphere host sends out a RARP packet to the physical network switch, thereby ensuring that the switch updates its tables with the new switch port location of the migrated virtual machine. This migration is completely transparent to the remote clients of the virtual machine.
Physical Memory of a Virtual Machine
The physical memory of the virtual machine is by far the largest component that needs to be transferred during a migration. The virtual machine’s physical memory can be as large as 1TB on vSphere 5, so the efficiency with which the memory is transferred plays a critical role in vMotion performance.
To allow a virtual machine to continue to run during the process of memory transfer and to achieve the desired amount of transparency, the memory state of the virtual machine is transferred in multiple phases. The following describes each phase along with how a guest workload might be impacted in each phase.
Phase 1: Guest Trace Phase
The guest is staged for migration during this phase. Traces are placed on the guest memory pages to track any modifications by the guest during the migration. Tracing all of the memory can cause a brief, noticeable drop in workload throughput. The impact is generally proportional to the overall size of guest memory.
Phase 2: Precopy Phase
Because the virtual machine continues to run and actively modify its memory state on the source host during this phase, the memory contents of the virtual machine are copied from the source vSphere host to the destination vSphere host in an iterative process. The first iteration copies all of the memory. Subsequent iterations copy only the memory pages that were modified during the previous iteration. The number of precopy iterations and the number of memory pages copied during each iteration depend on how actively the memory is changed on the source vSphere host, due to the guest’s ongoing operations. The bulk of vMotion network transfer is done during this phase—without taking any significant number of CPU cycles directly from the guest. One would still observe an impact on guest performance, because the write trace fires during the precopy phase will cause a slight slowdown in page writes.
Phase 3: Switchover Phase
During this final phase, the virtual machine is momentarily quiesced on the source vSphere host, the last set of memory changes are copied to the target vSphere host, and the virtual machine is resumed on the target vSphere host. The guest briefly pauses processing during this step. Although the duration of this phase is generally less than a second, it is the most likely phase where the largest impact on guest performance (an abrupt, temporary increase of latency) is observed. The impact depends on a variety of factors not limited to but including network infrastructure, shared storage configuration, host hardware, vSphere version, and dynamic guest workload.
Enhancements in vSphere 5
Using Multiple Network Adaptors for vMotion
vSphere 5 adds a multi–network adaptor feature that enables the user to utilize multiple network adaptors for vMotion. Test results, discussed later, show that migration times can be dramatically reduced when using this feature. The VMkernel will transparently load balance vMotion traffic over all of the vMotion-enabled vmknics to saturate all of the connections. In fact, even where there is a single vMotion, VMkernel uses all of the available network adaptors to spread the vMotion traffic.
Metro vMotion
vSphere 5 introduces a new latency-aware Metro vMotion feature that not only provides better performance over long latency networks but also increases the round-trip latency limit for vMotion networks from 5 milliseconds to 10 milliseconds. Previously, vMotion was supported only on networks with round-trip latencies of up to 5 milliseconds.
Stun During Page Send (SDPS)
vSphere 5 introduces a new enhancement that ensures vMotion will not fail due to memory copy convergence issues. As noted in the “Architecture” section, transfer of the virtual machine’s memory contents during the vMotion process involves an iterative precopy procedure. In most cases, a precopy iteration should take less time to complete than the previous iteration. However, a pathological case where the virtual machine modifies memory faster than it can be transferred—due to workload characteristics or network infrastructure
limitations—results in aborting vMotion in vSphere 4.1 and prior releases, because precopy fails to make forward progress. The enhancement in vSphere 5 slows down the virtual machine during such pathological cases and ensures that the memory modification rate is slower than the precopy transfer rate, thereby preventing any possible vMotion failures.
Other Performance Optimizations in vSphere 5
Other performance optimizations in vSphere 5 include the following:
• Significant improvements to minimize the impact of memory tracing
• Numerous improvements to reduce the amount of time needed for the guest to resume a normal level of
performance after vMotion
Performance Test Configuration and Methodology
This section describes the test-bed configuration and general testing methodology.
Test Configuration
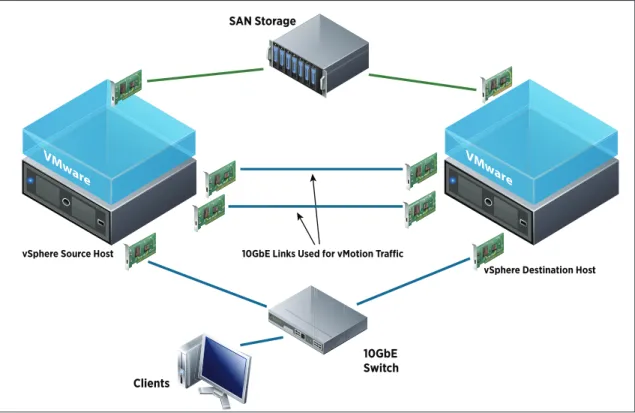
vMotion performance tests used a vSphere cluster comprising two identical HP ProLiant DL370 G6 servers. Each of the servers was configured with dual-socket, quad-core 3.2GHz Intel Xeon W5580 processors, 96GB of RAM, and three 10GbE Intel network adaptors. Figure 1 depicts the hardware configuration. The complete hardware details are provided in Appendix A.
VMwar e VM ware SAN Storage Clients 10GbE Switch
vSphere Destination Host 10GbE Links Used for vMotion Traffic
vSphere Source Host
Figure 1. Test-Bed Configuration
Measuring vMotion Performance
vMotion performance can be gauged by various metrics, such as
• Resources (CPU, memory and network) needed to do the migration
• The total time taken for the migration to complete, beginning from the initiation of the vMotion process • The suspension time during which the virtual machine is quiesced to enable virtual machine switchover • The performance impact (latency and throughput) on the applications running inside the virtual machines
during and after vMotion
Favoring one aspect over the others involves some trade-offs, so the implementation of vMotion has to carefully evaluate and balance these trade-offs. In general, although all of these metrics serve as important measures, based on context of the workload, some metrics are more significant than the others. For instance, when a single Microsoft Exchange Server virtual machine serving a large number of email users is subject to vMotion, the application performance (end-user latency, amount of interruption, and time to resume normal level of
performance) becomes the most critical measure of vMotion performance. On the other hand, overall migration time becomes a more critical measure when multiple vMotion migrations are being performed in a VDI or cloud-oriented business environment.
To measure vMotion performance, we considered a large domain of critical Tier 1 applications, including Web servers, messaging servers, and database servers. We also considered a VDI evacuation scenario in which a large number of desktop virtual machines needed to be migrated.
Capturing Timing Details
As described in the “Architecture” section, vMotion consists of multiple phases including the guest-trace phase, the precopy phase and the switchover phase. To capture the precise and fine-grained timing details of these different phases, we used a VMware SysInfo (VSI) interface and VMkernel logs.
The elapsed time of a vMotion task reported under the “Tasks & Events” tab in the VMware vCenter™ Server does not provide such a fine level of timing information. And the elapsed time reported by the VMware vCenter Server includes not only the actual time taken to complete the vMotion process between the source and destination vSphere hosts (the time during which guest performance is affected), but also includes other latencies contributed by the management layer, such as the time to sync up vMotion task completion information between the VMware vCenter Server and various other host agents running on the source and destination vSphere hosts, which has absolutely no bearing on guest performance.
vMotion Performance in a Web Environment
This case study investigates the impact of live migration on the performance of a Web/application server. Testing focuses on the number of user sessions that meet quality of service (QoS) requirements during vMotion. This study will be very helpful to customers who are increasingly looking to deploy Web applications on cloud environments that are characterized by service-level agreements (SLAs).
Test Methodology
Load-Generation SoftwareSPECweb2005 is an industry-standard Web server workload defined by the Standard Performance Evaluation Corporation (SPEC).
The SPECweb2005 architecture represents a typical Web architecture that consists of clients, Web server software (that includes PHP or JSP support) and a back-end application and database server. The
SPECweb2005 benchmark comprises three component workloads including banking, e-commerce and support. The support workload used in our tests is the most I/O intensive of the three workloads. It emulates a vendor support site that provides downloads, such as driver updates and documentation, over HTTP. The performance score of the workload is measured in terms of the number of simultaneous user/browser sessions a Web server can handle while meeting the QoS requirements specified by the benchmark.
We used the following test scenario for our vMotion tests. Both the source and destination vSphere hosts were configured with two 10GbE ports, one used for Web client traffic and the other for vMotion traffic. For more details on the test configuration, refer to Appendix B.
Test Scenario
The test scenario for this case study includes the following:
• A Rock Web/JSP server deployed in a single virtual machine configured with four vCPUs and 12GB memory • SUSE Linux Enterprise Server 11 x64 as the guest OS
The objectives of the tests were to measure the total migration time and to quantify the application slowdown when a virtual machine is subjected to vMotion during the steady-state phase of the SPECweb2005 benchmark. The SPECweb2005 benchmark was configured to enable fine-grained performance tracking. Specifically, the BEAT_INTERVAL test parameter was configured with a value of 2 seconds, which resulted in the clients’ reporting the performance data every 2 seconds (default: 10 seconds). Two seconds was the lowest granularity level that was supported by the benchmark driver. This fine-grained performance tracking helped us quantify the application slowdown (the number of user sessions failing to meet QoS requirements) during the different phases of the vMotion.
As described in the test scenario, the test used a load of 12,000 support users, which generated a substantial load on the virtual machine in terms of CPU and network usage. During the steady-state period of the
benchmark, the client network traffic was close to 6Gbps and the CPU utilization (esxtop %USED counter) of the virtual machine was about 325%.
Test Results
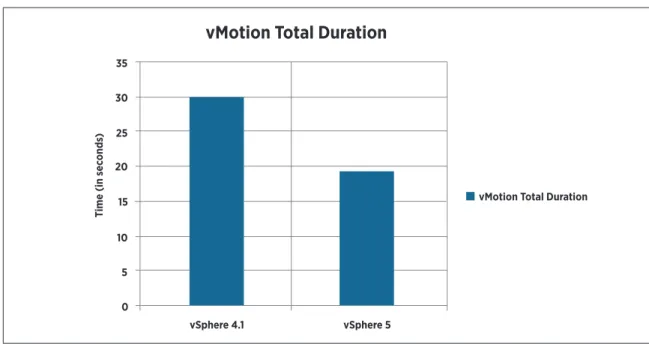
Figure 2 compares the total elapsed time for vMotion in both vSphere 4.1 and vSphere 5 for the following configurations:
1. Both source and destination hosts running vSphere 4.1 2. Both source and destination hosts running vSphere 5
vMotion Total Duration
vSphere 4.1 vSphere 5 35 30 25 20 15 10 5 0
Time (in sec
onds
)
vMotion Total Duration
Figure 2. Duration of vMotion on vSphere 4 .1 and vSphere 5
Both test scenarios used a dedicated 10GbE network adaptor for vMotion traffic. The total vMotion time dropped from 30 seconds to 19 seconds when running vSphere 5, a 37% reduction, clearly showing vMotion performance improvements made in vSphere 5 towards reducing vMotion transfer times. Our analysis indicated that most of the gains were due to the optimizations in vSphere 5 that enabled vMotion to effectively saturate the 10GbE bandwidth during the migration.
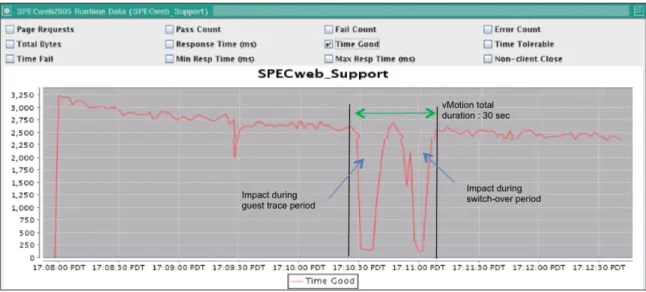
Figure 3 plots the performance of the Web server virtual machine—before, during and after vMotion when running vSphere 4.1.
Figure 3. Web Server Virtual Machine Performance with vMotion on vSphere 4 .1
The figure plots the number of SPECweb2005 user sessions that meet the QoS requirements (“Time Good”) at a given time. In this graph, the first dip observed at 17:09:30 corresponds to the beginning of the steady-state interval of the SPECweb2005 benchmark when the statistics are cleared. The figure shows that even though the actual benchmark load was 12,000 users, due to think-time used in the benchmark, the actual number of users submitting the requests at a given time is about 2,750. During the steady-state interval, 100% of the users were meeting the QoS requirements. The figure shows that the vMotion process started at about 1 minute into the steady-state interval. The figure shows two dips in performance. The first noticeable dip in performance was during the guest trace phase during which trace is installed on all the memory pages. The second dip is
observed during the switchover phase when the virtual machine is momentarily quiesced on the source host and is resumed on the destination host. In spite of these two dips, no network connections were dropped or timed out and the SPECweb2005 benchmark run continued.
Figure 4 plots the performance of the Web server virtual machine—before, during and after vMotion when running vSphere 5 with a single 10GbE network adaptor configured for vMotion.
Figure 4 shows the beginning of the steady state at about 12:20:30 PDT, marked by a small dip. During the steady-state interval, 100% of the users were meeting the QoS requirements. The figure shows that the vMotion process started after 2 minutes into the steady-state interval. In contrast to the two dips observed on vSphere 4.1, only a single noticeable dip in performance was observed during vMotion on vSphere 5. The dip during the guest trace stage was insignificant, due to improvements made in vSphere 5 to minimize the impact of memory tracing. The only noticeable dip in performance was during the switchover phase from the source to the destination host. Even at such high load level, the amount of time the guest was quiesced during the switchover phase was about 1 second. It took less than 5 seconds to resume to the normal level of performance.
In summary, the improvements in vSphere 5 over vSphere 4.1 are twofold: the duration of vMotion and the impact on guest performance during vMotion.
A series of tests was also conducted to evaluate the performance of vMotion when using a 1GbE network for vMotion traffic on both vSphere 4.1 and vSphere 5. A comparative performance on a 10GbE network is also provided. The following test scenarios were considered:
SCENARIO CPUS M EMORY %USED
(esxtop CPU usage counter)
WEB TRAFFIC
Idle Virtual Machine (0 support users) 4 12GB 0% 0Gbps Moderately Loaded Virtual Machine (5,000 support users) 4 12GB 140% 2,500Mbps
Heavily Loaded Virtual Machine (12,000 support users)
4 12GB 325% 6,000Mbps
Table 1. Test Scenarios for vMotion Traffic on vSphere 4 .1 and vSphere 5
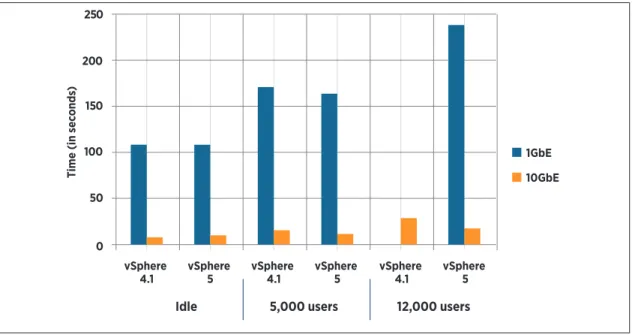
Figure 5 compares the vMotion duration for idle, moderately loaded and heavily loaded virtual machines on a 10GbE network in comparison to on a 1GbE network, on both vSphere 4.1 and vSphere 5.
1GbE 10GbE
vSphere 4.1
Idle 5,000 users 12,000 users
vSphere
5 vSphere 4.1 vSphere 5 vSphere 4.1 vSphere 5 250 50 100 150 200 0
Time (in sec
onds
)
This figure clearly illustrates the benefit of using a 10GbE network for vMotion traffic. It shows that vMotion transfer time is significantly faster (a factor of 8–10 in improvement) when using a 10GbE network as opposed to a 1GbE network for vMotion traffic on both vSphere 4.1 and vSphere 5 in all test scenarios.
The figure also shows a considerable reduction in vMotion transfer time on vSphere 5 compared to vSphere 4.1 when using a 10GbE network, due to the optimizations in vSphere 5 that enable vMotion to effectively saturate a 10GbE bandwidth during the migration.
A more detailed explanation of each of the test scenarios is presented as follows:
Idle virtual machine scenario: The idle virtual machine test presents a scenario in which the virtual machine is idle (CPU activity is zero) but its memory has been completely touched and modified by the guest. In other words, this scenario is different from a freshly booted virtual machine that is assigned zero pages (pages that contain nothing but zeroes). vSphere has optimizations to reduce the amount of data transferred for zero pages. In fact, testing indicates that vMotion transfer time of a freshly booted virtual machine when using a 1GbE network was less than 9 seconds, as opposed to 110 seconds when the virtual machine’s memory is fully touched by the guest on both vSphere 4.1 and vSphere 5.
Moderately loaded virtual machine scenario: In this scenario, the virtual machine was moderately loaded in terms of CPU and network usage. The CPU utilization (esxtop %USED counter) of the virtual machine was about 140%, and the client networking traffic was close to 2.5Gbps. On both vSphere 4.1 and vSphere 5, there was a significant reduction in transfer time when using a 10GbE network. The transfer times on vSphere 5 were marginally better than those on vSphere 4.1 in both 1GbE and 10GbE test scenarios.
Heavily loaded virtual machine scenario: In this scenario, the virtual machine was heavily loaded in terms of CPU and network usage. The CPU utilization (esxtop %USED counter) of the virtual machine was about 325%, and the client networking traffic was close to 6Gbps. On both vSphere 4.1 and vSphere 5, there was a significant reduction in transfer time when using a 10GbE network. During the vMotion test on a 1GbE network in vSphere 4.1, the client experienced latencies that were higher than SPECweb2005 benchmark QoS specifications, and there were also some network connection drops. Therefore, the vSphere 4.1/1GbE data point was marked with a gradient shade. The VMkernel logs indicated that the workload complexity imposed an unusual memory access pattern with the virtual machine modifying memory faster than it can be transferred on a 1GbE network. However, during the vMotion test on a 1GbE network on vSphere 5, the VMkernel logs indicated that the new SDPS enhancement in vSphere 5 (for more details, see the “Architecture” section) took effect when the precopy was failing to make forward progress, and this enabled the vMotion process to progress smoothly. Not a single connection drop was observed during vMotion.
In summary, performance improvements in vSphere 5 are more apparent when running heavy-duty virtual machines and (or) when there are limitations in the networking infrastructure.
Results from these tests clearly indicate that the performance impact of vMotion is minimal on even the largest resource-intensive Web server applications. In addition, the impact is further minimized when running vSphere 5.
vMotion Performance in an Email/
Messaging Environment
Email continues to be the key communication tool among organizations. Accordingly, IT departments regard email systems as mission-critical applications. Microsoft Exchange Server is a widely used email platform in business worldwide. Therefore, Microsoft Exchange Server 2010 was chosen as the email server to use to study the impact of vMotion.
Test Methodology
Load-Generation SoftwareThe Microsoft Exchange Load Generator 2010 tool (LoadGen), the official Exchange Server performance assessment tool from Microsoft, was used to simulate the email users. LoadGen simulates a number of MAPI (Mail Application Program Interface) clients accessing their email on Exchange Servers. Included with LoadGen are profiles for light, medium and heavy workloads. In all of the tests, Outlook 2007 online clients using a very heavy user profile workload—150 messages sent/received per day per user—were used for load generation. Each mailbox was initialized with 100MB of user data.
Tests were configured on the commonly used Exchange Server deployment scenarios.
Exchange Server Configuration
The Exchange Server test environment consisted of two mailbox server role virtual machines and two client access and hub transport combined-role virtual machines to support 8,000 very heavy users. These two types of virtual machines were configured as follows:
• The mailbox server role virtual machine was configured with four vCPUs and 28GB of memory to support
4,000 users. The mailbox server role had higher resource (CPU, memory and storage I/O) requirements. Therefore, a mailbox server role virtual machine was used as a candidate for vMotion testing.
• The client access and hub transport combined-role virtual machine was configured with four vCPUs and 8GB
of memory.
The following test scenarios for vMotion tests were used:
• Test scenario 1 (one virtual machine): Perform vMotion on a single mailbox server role virtual machine
(running a load of 4,000 very heavy users).
• Test scenario 2 (two virtual machines): Perform vMotion on two mailbox server role virtual machines
simultaneously (running a combined load of 8,000 very heavy users).
In this study, the focus was on the duration of vMotion, and the impact on application performance when an Exchange Server virtual machine was subjected to vMotion. To measure the application performance, the following metrics were used:
Task Queue Length
The LoadGen task queue length is used as a popular metric to study the user experience and SLA trending in Exchange Server benchmarking environments. The number of the tasks in the queue will increase if Exchange Server fails to process the dispatched tasks expeditiously. So the rise in the task queue length directly reflects a decline in the client experience.
Number of Task Exceptions
The LoadGen performance counter presents the number of task executions that resulted in a fatal exception, typically due to lack of response from Exchange Servers.
Test Results
Figure 6 compares the total elapsed time during vMotion on vSphere 4.1 and vSphere 5, for both single- and multiple-instance Exchange Server deployments. The source and destination hosts were configured with a single 10GbE port for vMotion.
vSphere 4.1 vSphere 5 1 Virtual Machine 140 160 120 100 80 60 40 20 0 2 Virtual Machines
Time (in sec
onds
)
vMotion Total Duration
Figure 6. Duration of vMotion on vSphere 4 .1 and vSphere 5, for Single and Multiple Exchange Server Deployments
In the single mailbox server virtual machine test scenario, machine memory consumed and in use by the guest was 28GB of memory when the migration of the mailbox server virtual machine was initiated. The vMotion duration dropped from 71 seconds on vSphere 4.1 to 47 seconds on vSphere 5, a 33% reduction. In the two mailbox server virtual machines scenario, the total machine memory consumed and in use by both mailbox server virtual machines was 56GB, when vMotion was initiated. Once again, the vSphere 5 results were quite impressive. The total duration dropped by about 49 seconds when using vSphere 5, a 34% reduction.
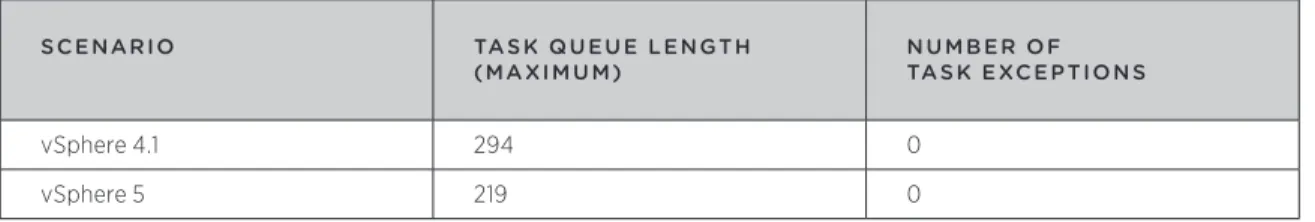
The following table compares the impact on the guest during vMotion on both vSphere 4.1 and vSphere 5 during the one–virtual machine test scenario.
SCENARIO TASK Q U EU E LENGTH
(MA XIM U M) N U M B ER OFTASK EXCEPTION S
vSphere 4.1 294 0
vSphere 5 219 0
Table 2. Impact on the Guest During vMotion on vSphere 4 .1 and vSphere 5
The table shows that the maximum size of the task queue length observed during vMotion on vSphere 5 was 219, much smaller than the 294 observed on vSphere 4.0. This confirms that Exchange Server users got a better response time during the migration period in the vSphere 5 environment. There were no reported task
vMotion Performance in a Database Environment
Database workloads are widely acknowledged to be extremely resource intensive. They are characterized by high consumption of CPU, memory and storage resources. So they serve as an ultimate test of vMotion performance. This study investigates the impact of vMotion on the Microsoft SQL Server online transaction processing (OLTP) performance.
Test Methodology
Load-Generation SoftwareThe open-source DVD Store Version 2 (DS2) was used as the benchmark tool. DS2 simulates an online ecommerce DVD store, where customers log in, browse and order products. It is designed to utilize a number of advanced database features, including transactions, stored procedures, triggers and referential integrity. The main DS2 metric is orders per minute (OPM).
The DVD store benchmark driver was configured to enable fine-grained performance tracking, which helped to quantify the impact on SQL Server throughput (orders processed per second) during different phases of vMotion. Specifically, the source code of the ds2xdriver.cs file was edited with 1-second granularity, which resulted in the client reporting the performance data every 1 second (default: 10 seconds).
Test cases modeled single–virtual machine and multiple–virtual machine deployment scenarios.
Test 1: Single-Instance SQL Server Deployment
• Microsoft SQL Server was deployed in a single virtual machine configured with four vCPUs and
16GB of memory.
• The DS2 workload used a database size of 50GB with 50,000,000 customers. • A benchmark load of 12 DS2 users was used.
Test 2: Multiple-Instance SQL Server Deployment
• Microsoft SQL Server was deployed in two virtual machines. Each virtual machine was configured with
four vCPUs and 16GB of memory.
• The DS2 client ran on two client machines, with each client talking to a unique SQL Server virtual machine. • The load on both the SQL Server virtual machines was identical, with the aggregate load of 24 DS2 users. • The total database size was 100GB, with 100,000,000 users.
In the first test scenario, a load of 12 DS2 users generated a substantial load on the virtual machine in terms of CPU and memory usage. vMotion was initiated during the steady-state period of the benchmark, when the CPU utilization (esxtop %USED counter) of the virtual machine was close to 115%. The machine memory consumed and in use by the guest was 16GB. The second test scenario used two SQL Server virtual machines, each of which was subjected to an identical load of 12 DS2 users. The CPU percent utilization (esxtop %USED counter) of each of the virtual machines was about 115%, and the total machine memory consumed and in use by both the guests was 32GB. vMotion was initiated on both the virtual machines during the steady-state period of the workload.
Test Results
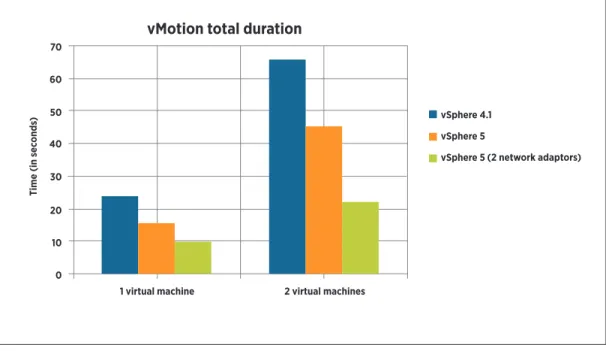
Figure 7 summarizes the results of the vMotion test scenarios for both vSphere 4.1 and vSphere 5. The source and destination hosts were configured with one 10GbE port for vMotion on vSphere 4.1 and 5. A configuration with two ports for vMotion on vSphere 5 was also tested.
vSphere 4.1 vSphere 5 vSphere 5 (2 NICs) 1 Virtual Machine 70 60 50 40 30 20 10 0 2 Virtual Machines
Time (in sec
onds
)
vMotion total duration
(2 network adaptors)
2 virtual machines 1 virtual machine
Figure 7. Duration of vMotion on vSphere 4 .1 and vSphere 5
The figure shows the total elapsed time during vMotion in both single and multiple-instance SQL Server deployment scenarios. These results clearly show the enhancements made in vSphere 5, reducing the total elapsed time. First consider the single–virtual machine tests. The total time of vMotion dropped from 23 seconds to 15 seconds when using a single 10GbE network adaptor, a 35% reduction. When using two 10GbE network adaptors for vMotion (enabled by the new multi–network adaptor feature in vSphere 5), the total migration time dropped to 10 seconds, an improvement over vSphere 4.1 by a factor of 2.3. This data point illustrates the fact that the multi–network adaptor feature transparently load balances the vMotion traffic onto multiple network adaptors, even in the case when a single virtual machine is subjected to vMotion. This feature can be especially useful when a virtual machine is configured with a large amount of memory. Figure 7 also shows similar
improvements in the two virtual machine scenario. Compared to the vSphere 4.1 baseline result, the total time of vMotion dropped by about 32% when using a single 10GbE network adaptor, and there was a reduction by a factor of 3 when using two 10GbE network adaptors.
In summary, the new multi–network adaptor feature added in vSphere 5 dramatically reduces the total migration times in both single–virtual machine and multiple–virtual machine scenarios.
Figure 8 plots the performance of a SQL Server virtual machine—before, during and after vMotion—when running vSphere 4.1. 0 0 14 27 40 53 66 79 92 105 118 131 144 157 170 183 196 209 222 235 248 261 274 287 50 100 150 200 250 300 350 400 450 vSphere 4.1
Orders per second
Or
ders per sec
ond
Time (in seconds)
Figure 8. Performance of SQL Server Virtual Machine Before, During and After vMotion on vSphere 4 .1
The figure plots the orders processed per second by the SQL Server at a given time during the steady-state interval of the benchmark. The figure shows that vMotion started at about 103 seconds into the steady-state interval, and the total duration of vMotion was 23 seconds. The figure shows two dips in performance. The first noticeable dip in performance was during the guest trace phase, during which trace was installed on all the memory pages. The second dip was observed during the switchover phase, when the virtual machine was momentarily quiesced on the source host and was resumed on the destination host. The duration of the switchover time, during which the application throughput was zero, was less than 1 second. The amount of time needed to resume to a normal level of performance after the end of the switchover stage was about 9 seconds. Overall, the performance impact on the guest performance was not severe, even when the SQL Server virtual machine was executing a substantial load.
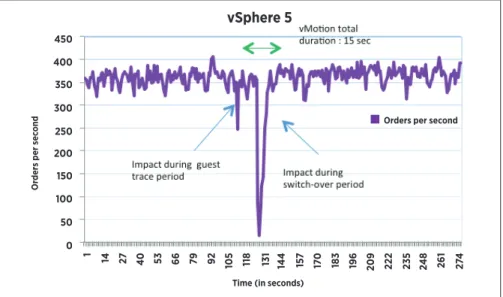
Figure 9 plots the performance of the SQL Server virtual machine—before, during and after vMotion—when running vSphere 5 with a single 10GbE network adaptor configured for vMotion.
0 1 14 27 40 53 66 79 92 105 118 131 144 157 170 183 196 209 222 235 248 261 274 50 100 150 200 250 300 350 400 450 vSphere 5 Or
ders per sec
ond
Time (in seconds)
Orders per second
The figure shows that vMotion started after 110 seconds into the steady-state interval. In contrast to the two dips observed on vSphere 4.1, only a single dip in performance was noticed during the vMotion process. The dip during the guest trace stage was insignificant, due to improvements made in vSphere 5 to minimize the impact of memory tracing. The only noticeable dip in performance was during the switchover phase from the source to the destination host. The duration of the switchover time, during which the application throughput was zero, was less than half a second. Consequently, the throughput tracked at 1-second granularity in the figure was always non-zero. The amount of time needed to resume to a normal level of performance after the end of the switchover stage was about 7 seconds, which was about 2 seconds better than what was observed on vSphere 4.1.
In summary, the improvements in vSphere 5 over vSphere 4.1 are twofold: the duration of vMotion and the impact on guest performance during vMotion.
Results from these tests clearly indicate that the performance impact of vMotion is very minimal on even the largest resource-intensive database applications.
vMotion Performance in a VDI/Cloud-Oriented
Business Environment
Virtual desktop infrastructure (VDI) and cloud are the fastest-growing environments today. They have similar characteristics, such as high virtual machine consolidation ratios, with typically hundreds of small to medium-sized desktop virtual machines consolidated on a single host. The administrators of these environments find the benefits of vMotion very appealing, such as the following:
Datacenter maintenance without downtime: Move or evacuate all the virtual machines off a vSphere host that requires downtime (for hardware replacement, firmware upgrade, and so on), with no disruption in service.
Troubleshooting: Move all the virtual machines off a vSphere host for troubleshooting suspected issues with underlying hardware.
In VDI/cloud environments, the overall migration time in virtual machine evacuation scenarios is a very important measure, because the goal is to minimize service interruption time. So, unlike the previous tests that focus on both the total migration time and application performance during vMotion, the primary focus of these tests is to measure the total migration time. Testing shows how well vMotion can take advantage of all the server resources (including CPU, memory and network) to minimize overall migration time.
This study uses VMware View™ to implement virtualized desktop systems. Virtualized desktop systems, enabled through VMware View, run in virtual machines on vSphere hosts and provide complete, isolated PC
environments to end users. Users can flexibly access their desktop environments from any location, from any client. This solution also tremendously benefits IT administrators because it enables them to gain centralized control over desktop computing resources as well as the ability to optimize resource utilization through virtual machine consolidation.
Test Methodology
Load-Generation SoftwareTests used the VMware View Planner 2.0 benchmark tool, which is designed to simulate a large-scale deployment of virtualized desktop systems in a VMware View environment.
Each of the virtualized desktop systems ran a View Planner workload profile. The profile can be customized to simulate various user scenarios such as order entry workers running applications such as Word or Excel, or executive workers running applications such as PowerPoint.
The test scenario used the following workload profile:
Test Scenario
The test scenario used 64 desktop virtual machines. The workload profile consisted of Internet Explorer and Adobe Reader.
• VMware View Planner was configured with 64 desktop virtual machines with a density of eight virtual
machines per core.
• Each desktop virtual machine was configured with one vCPU and 1GB memory and ran Windows 7 as the
guest OS.
• VMware View Planner profile: local mode, 32 desktop virtual machines running Internet Explorer workload;
32 virtual machines running Adobe Reader workload.
• The vSphere host CPU utilization (esxtop %PCPU counter) was about 25%; the total machine memory
consumed and in use by all the desktop virtual machines was 64GB during the steady-state period. The methodology for the virtual machine evacuation tests involved the following steps:
1. Start the VMware View Planner workload and wait for all the desktop virtual machines to power on and start the workload execution.
2. During the steady-state period of the benchmark, place the vSphere host that is hosting all the desktop virtual machines into maintenance mode. This will cause vSphere DRS to automatically migrate all the virtual machines to another vSphere host.
3. The total migration time is measured from the initiation of the host maintenance mode operation to its completion, which will include the migration times for all the virtual machines running on the vSphere host.
Test Results
Figure 10 summarizes the results of the evacuation test scenario. The source and destination hosts were configured with one 10GbE port for vMotion on vSphere 4.1 and 5. vSphere 5 was also tested with the source and destination hosts configured with two 10GbE ports for vMotion.
vSphere 4.1 vSphere 5 vSphere 5 (2 NICs) 12 10 8 6 4 2 0
Time (in minut
es
)
Total Migration Time
Figure 10 compares the total migration time between the vSphere 4.1 and vSphere 5 configurations. These results clearly show the enhancements made in vSphere 5 that reduce the total elapsed time when compared to vSphere 4.1. The total migration time during the evacuation dramatically dropped from 11 minutes in vSphere 4.1 to a little over 2 minutes in vSphere 5, a 5x improvement factor, when using a single 10GbE network adaptor. The improvement when using two 10GbE network adaptors was only marginal compared to using a single 10GbE network adaptor for this particular test scenario. This is because of the latencies in the management layer among various agents running on VMware vCenter Server and the source and destination vSphere hosts that limited the optimal use of the bandwidth usage. This will be clearly explained later in this section. The impact of the latencies is more pronounced in scenarios that consist of only small virtual machines, such as the test scenario that was considered. For an environment that consists of a mixture of small and large virtual machines (for example, 12GB or 16GB), it is recommended to use two 10GbE network adaptors. The use of multiple network adaptors for reducing the vMotion duration for larger virtual machines was already
demonstrated in the previous section.
Figures 11 and 12 show network bandwidth usage in vSphere 4.1 and vSphere 5 during the evacuation scenario. Both configurations use a single 10GbE port for vMotion traffic.
0 1000 2000 3000 4000 5000 6000 7000 8000 9000 10000 8:38:20 PM 8:40:00 PM 8:41:40 PM 8:43:20 PM 8:45:00 PM 8:46:40 PM 8:48:20 PM 8:50:51 PM
vMotion Bandwidth Usage in vSphere 4.1 During Evacuation
Bandwidth Usage
(Mbps
)
Time Figure 11. Network Bandwidth Usage in vSphere 4 .1 During Evacuation Scenario
Figure 11 shows network bandwidth usage by vMotion in vSphere 4.1 during an evacuation scenario that featured 64 virtual machines. In vSphere 4.1, there is already support for up to eight simultaneous migrations per host, which resulted in eight distinct phases of network usage. During each phase, there were eight simultaneous migrations, and peak bandwidth usage was close to 8Gbps. However, as shown in the figure, network bandwidth usage between the eight phases is marked by idle usage due to synchronization latencies in the management layer among various agents running on VMware vCenter Server, source and destination vSphere hosts. As a result, although average migration time for all virtual machines was only about 6 seconds, total migration time,
0 1000 2000 3000 4000 5000 6000 7000 8000 9000 10000 2:14:46 AM 2:15:10 AM 2:15:30 AM 2:15:50 AM 2:16:10 AM 2:16:30 AM 2:16:50 AM 2:17:19 AM
vMotion Bandwidth Usage in vSphere 5 During Evacuation
Bandwidth Usage
(Mbps
)
Time
Total migration time: 2 minutes and 14 seconds
Figure 12. Network Bandwidth Usage in vSphere 5 During Evacuation Scenario
Figure 12 illustrates the improvements made in vSphere 5 to effectively utilize the available network bandwidth. Unlike the bimodal behavior observed in vSphere 4.1, there are no clearly noticeable phases. In addition, peak network utilization was 9Gbps compared to less than 8Gbps in vSphere 4.1. As a result, total migration time during the evacuation dramatically dropped from 11 minutes to a little over 2 minutes, a 5x improvement factor. In summary, improvements are twofold: the near elimination of synchronization latencies, which resulted in idle usage periods, and better utilization of 10GbE bandwidth.
vMotion Best Practices
The following are best practices when using vMotion:
• Consider using a 10GbE vMotion network. Using a 10GbE network in place of a 1GbE network for vMotion
will result in significant improvements in vMotion performance. When using very large virtual machines (for example, 64GB or more), consider using multiple 10GbE network adaptors for vMotion to further improve vMotion performance.
• When configuring resource pools at the host level, do not fully commit the CPU capacity of the host. You
should leave at least 30% of a CPU unreserved for vMotion. When you initiate vMotion, the VMkernel will opportunistically attempt to reserve some CPU resources. If that reservation fails, vMotion still proceeds, but its performance might be impacted. Similarly, when using resource pools at the vSphere Distributed Resource Scheduler (DRS)–enabled cluster level, plan to leave at least 10% of the CPU capacity unreserved. CPU reservations that fully commit the capacity of the cluster can prevent DRS from migrating virtual machines between hosts.
• vSphere 5 (and prior releases) enables the use of host-local swap, which enables you to specify a local
datastore for storing the virtual machine swap files, saving space on the SAN. Additionally, vSphere 5 now enables VMware ESXi™ host swapping to a solid-state disk (SSD) by allowing you to configure a swap cache on an SSD. Leveraging an SSD for swap cache or placing virtual machine swap files on a host local datastore can impact vMotion performance. If you are very concerned about virtual machine migration or host evacuation time, consider placing virtual machine swap files on a shared storage such as SAN or NAS.
• When using the multiple–network adaptor feature, configure all the vMotion vmnics under one vSwitch and
create one vMotion vmknic for each vmnic. In the vmknic properties, configure each vmknic to leverage a different vmnic as its active vmnic, with the rest marked as standby. This way, if any of the vMotion vmnics become disconnected or fail, vMotion will transparently switch over to one of the standby vmnics. When all your vmnics are functional, though, each vmknic will route traffic over its assigned, dedicated vmnic.
• If you are constrained by your networking infrastructure and must have multiple traffic flows (for example,
virtual machine traffic and vMotion traffic) sharing the same set of network adaptors, use the vSphere Network I/O Control (NetIOC) feature to partition the network bandwidth allocation among the different traffic flows.
• ESXi 5 introduces virtual NUMA (vNUMA), which exposes the ESXi host’s NUMA topology to the guest
operating systems. When using this feature, apply vMotion to move virtual machines between clusters that are composed of hosts with matching NUMA architectures. This is because the very first time a vNUMA-enabled virtual machine is powered on, its vNUMA topology is set, based in part on the NUMA topology of the underly-ing physical host on which it is runnunderly-ing. After a virtual machine’s vNUMA topology is initialized, it doesn’t change. This means that if a vNUMA virtual machine is migrated to a host with a different NUMA topology, the virtual machine’s vNUMA topology might no longer be optimal for the underlying physical NUMA topology, potentially resulting in reduced performance.
Conclusion
VMware vSphere vMotion is one of the most popular features of VMware vSphere. vMotion provides invaluable benefits to administrators of virtualized datacenters. It enables load balancing, helps prevent server downtime, enables troubleshooting and provides flexibility—with no perceivable impact on application availability and responsiveness.
vSphere 5 includes a number of performance enhancements and new features that have been introduced in vMotion. Among these improvements are a multiple–network adaptor capability for vMotion, better utilization of 10GbE bandwidth, Metro vMotion, and optimizations to further reduce impact on application performance. A series of tests were conducted to quantify the performance gains of vMotion in vSphere 5 over
vSphere 4.1 in a number of scenarios including Web servers, messaging servers and database servers. An evacuation scenario was also performed in which a large number of virtual machines were migrated. Test results show the following:
• Improvements in vSphere 5 over vSphere 4.1 are twofold: the duration of vMotion and the impact on
application performance during vMotion.
• There are consistent performance gains in the range of 30% in vMotion duration on vSphere 5,
due to the optimizations introduced in vMotion in vSphere 5.
• The newly added multi–network adaptor feature in vSphere 5 results in dramatic improvements in performance
Appendix A: Hardware Setup
vSphere host:
• Number of hosts: two (2)
• System: HP ProLiant DL370 G6 servers
• Processor: Intel Xeon W5580 processors @ 3.199GHz
• Cores: eight (8) cores, two (2) chips, four (4) cores/chip (Intel Hyper-Threading Technology enabled) • Memory: 96GB
• Network adaptors: three (3) single-port Intel 10 Gigabit XF SR Server Adapters, on-board quad-port
Intel Gigabit Server Adapter
• Hypervisor: VMware ESX 4.1 and VMware ESXi 5 SAN storage:
• Model: EMC CX3-40 SAN Array consisting of 60 disks Network switch:
• Model: Summit X450a-24t switches • Slots: 2*10G XFP slots (XGM2-2xf)
• Transceivers: 4*XFP transceivers (10G-SR XFP) Client machine:
• Number of clients: 10
• System: Dell PowerEdge R200
• Processor: Intel Xeon processor @ 2,400MHz • Cores: four (4)
• Memory: 8,192MB SDRAM
• Network controller: Broadcom NetXtreme BCM5721 Gigabit Ethernet PCI Express • Operating system: Red Hat Enterprise Linux 4 x86_64 (2.6.9-42.ELsmp) • JVM Version: Java SE Runtime Environment (build 1.6.0_01-b06)
Backend simulator machine:
• Number of simulators: one (1) • System: HP ProLiant DL380 G5
• Processor: Intel Xeon processor @ 2,333MHz • Cores: eight (8)
• Memory: 32GB • Network controller: Intel 82571EB GbE
• Operating system: Red Hat Enterprise Linux 5 Update 1 (x86_64) • Web server: Rock Web Server v1.4.2
Appendix B: Workload Details
Test scenario 1 (Web server scenario): • Number of virtual machines: one (1)
• Virtual machine configuration: four (4) vCPUs, 16GB RAM, vmxnet3 virtual network adaptors,
LSI Logic virtual SCSI adapter
• OS version: SUSE Linux Enterprise Server 11, x64
• Web server: Rock Web Server v1.4.7 (x86_64), Rock JSP/Servlet Container v1.3.2 (x86_64) • Workload : SPECweb2005
• Benchmark parameters: 12,000 SPECweb2005 support sessions • SPECweb2005 BEAT_INTERVAL: 2 seconds
Test scenario 2 (Email server scenario): • Number of virtual machines: two (2)
• Virtual machine configuration: four (4) vCPUs, 28GB RAM • OS version: Microsoft Windows Server 2008 R2 Datacenter Edition • Exchange Server: Microsoft Exchange Server 2010
• Workload: Microsoft Load Generator 2010 tool (LoadGen)
• LoadGen workload profile: Outlook 20070 online client using very heavy user profile Test scenario 3 (Database server scenario):
• Number of virtual machines: two (2)
• Virtual machine configuration: four (4) vCPUs, 16GB RAM • OS version: Windows Server 2008 R2 Enterprise • Database server: Microsoft SQL Server 2008 R2 • Workload: DVD Store Version 2 (DS2)
• DS2 benchmark parameters: n_threads=12, db_size=50GB, pct_newcustomers=10 • DS2 benchmark parameters: n_searches=1, search_batch_size=20
Test scenario 4 (Evacuation scenario): • Number of virtual machines: 64
• Virtual machine configuration: one (1) vCPU, 1GB RAM • OS version: Windows 7 (32-bit)
• Workload: VMware View Planner 2.0
About the Author
Sreekanth Setty is a staff member with the Performance Engineering team at VMware. His work focuses on performance-related topics, with an emphasis on networking and virtualization. He has published his findings in a number of white papers and has presented them at various technical conferences. He has a master’s degree in computer science from the University of Texas, Austin.
Acknowledgments
The author would like to sincerely thank Gabriel Tarasuk-Levin, Shilpi Agarwal and Victor White for their reviews and helpful suggestions on this paper. He also would like to extend thanks to other colleagues on his team.