Research
Discussion
Paper
The Evolution of Payment
Costs in Australia
Chris Stewart, Iris Chan, Crystal Ossolinski,
David Halperin and Paul Ryan
research so as to encourage discussion and comment. Views expressed in this paper are those of the authors and not necessarily those of the Reserve Bank. Use of any results from this paper should clearly attribute the work to the authors and not to the Reserve Bank of Australia.
The contents of this publication shall not be reproduced, sold or distributed without the prior consent of the Reserve Bank of Australia.
ISSN 1320-7229 (Print) ISSN 1448-5109 (Online)
Chris Stewart, Iris Chan, Crystal Ossolinski, David Halperin and Paul Ryan
Research Discussion Paper 2014-14
December 2014
Payments Policy Department Reserve Bank of Australia
We would like to thank the entities that participated in this study. We would also like to thank David Emery, Darren Flood, Tony Richards, Stephanie Bolt, Tim West, Clare Noone, Fumiko Hayashi, Michele Bullock, John Simon and Carl Schwartz for useful comments and suggestions. The views expressed in this paper are our own and do not necessarily reflect those of the Reserve Bank of Australia. Any errors are our own.
Authors: ossolinskic, halperind and ryanpe at domain rba.gov.au Media Office: [email protected]
This paper examines the costs borne by financial institutions, merchants, and consumers in making, facilitating and accepting consumer-to-business payments. It examines the resource costs incurred by these sectors, how these have changed since 2006, and how fees and other transfers determine which sectors ultimately bear these costs. It also examines how resource costs vary at different transaction sizes and, for merchants, how costs differ between small and large entities.
The results suggest that the resource costs of the payments system have fallen as a per cent of GDP since 2006. On a per transaction basis, direct debit remains the lowest-cost payment instrument while cheques remain the most expensive. At the point of sale, payments using cash, eftpos and contactless MasterCard & Visa debit cards have broadly similar costs for transactions under about $20; above $20, eftpos is the lowest-cost payment method. The results indicate that the relationship between resource and private costs varies significantly across instruments. The greater share of the overall cost is borne by merchants. The consumer undertaking a transaction typically pays a small proportion of its cost; consumers face a similar cost for credit card payments as for debit card payments despite the higher cost of credit cards to the economy. Finally, the results suggest that small businesses incur higher costs than large merchants.
JEL Classification Numbers: E4, G2, L2
Keywords: banks, consumers, financial institutions, merchants, retail payments, surcharging
1. Introduction 1
2. Related Literature and Scope 4
2.1 Measurement of Costs 5
2.2 Resource Costs, Private Costs and Transfers 6
2.3 Fixed and Variable Costs 7
2.4 Institutional Coverage and Data Collection 7
2.5 Payment Instruments 8
3. Methodology 10
3.1 Data Collection and Sample 10
3.2 Caveats 12
4. Resource Costs of Payments 14
4.1 Overall Resource Costs 14
4.2 Account Maintenance Costs 21
4.3 Cash 22
4.4 Personal Cheques 26
4.5 Credit and Debit Cards 28
4.6 Direct Debit and BPAY 32
5. Private Net Costs 33
5.1 MasterCard & Visa Credit Cards 36
5.2 Debit Cards 37
5.3 Cash 38
6. Influence of Payment Size 38
7. Small Businesses Costs 41
7.1 Acceptance 41
8. Conclusion 45
Appendix A: Additional Detailed Results 48
Appendix B: Payment Activity in the Sample 58
Appendix C: Costs for Consumers in Making Payments 61
Appendix D: Description of Survey of SMEs 64
References 66
Chris Stewart, Iris Chan, Crystal Ossolinski, David Halperin and Paul Ryan
1.
Introduction
This study provides comprehensive estimates of the costs borne by merchants, financial institutions and individuals in the use of different retail payment methods. The absolute and relative costs involved in making and receiving payments are important as they influence the decisions of these sectors and, therefore, the mix of payments in the economy. They are also important considerations for policymakers when trying to understand the efficiency of the payments system. These costs are typically not transparent to policymakers or end users of payment systems.
This study follows earlier work on payments costs by the Reserve Bank and the Australian Competition and Consumer Commission (Schwartz et al 2008; RBA and ACCC 2000). These studies helped to inform subsequent policy deliberations, although it should be kept in mind that policy deliberations take into account a wider range of considerations than just costs as measured by these types of studies. Given the significant changes in technology, payment functionality, issuing arrangements, pricing and payment use patterns that have occurred in recent years it is timely to refresh this work with new cost data. This study extends the earlier work in a number of directions. In particular, it:
• explores both the resources used (resource costs) and the fees and other transfers (which contribute to private costs) associated with different payment instruments1
• captures the payments costs of a wider range of merchants, including small businesses
1 The distinction between resource costs (the economic resources that are expended to ‘produce’ a payment, see Schwartz et al (2008)) and private costs (the combination of resource costs plus the transfer payments paid or received by parties) is discussed in more detail in Section 2.
• collects information on a wider range of payment instruments, for example so-called ‘companion credit cards’ (American Express credit cards issued by the major banks to customers alongside a MasterCard or Visa credit card)
• separately identifies the costs of contactless card transactions given their rapid growth and implications for tender times and other costs.
As with the earlier Reserve Bank work, the study has benefited from close cooperation with a wide range of financial institutions and merchants. These entities helped determine what information could be reliably obtained, provided a large amount of data to the Reserve Bank for analysis, and worked with the Reserve Bank to improve the accuracy and consistency of these data.
The key findings of the study include:
• The aggregate resource cost incurred by merchants and financial institutions in receiving payments from consumers is estimated to be about $8.4 billion in 2013, or about 0.54 per cent of GDP. Financial institutions incur the majority of these costs. Around one-third of costs are incurred by merchants, with tender time (the time taken at the till to process the payment) being the most significant component.
• The aggregate costs associated with consumer-to-business payments are estimated to have changed little in nominal terms since the 2007 study, and to have fallen as a per cent of GDP. The fall primarily reflects that per transaction costs have fallen across most instruments. Marginally offsetting the fall, the shift towards greater use of more expensive instruments has worked to raise the cost of the payments system.
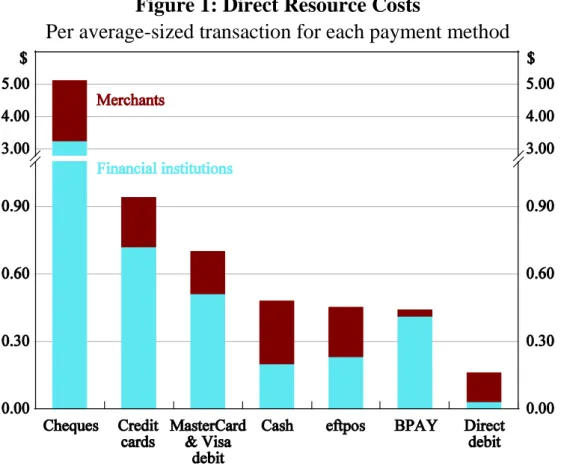
• To conduct a comparison of the cost across instruments, the cost of maintaining accounts (which may facilitate payments made with multiple instruments) is excluded and only the direct cost of making a payment using that method is considered. On this basis, cash, eftpos and contactless MasterCard & Visa debit transactions have broadly similar resource costs for transactions of under about $20. Above $20, eftpos is the lowest-cost payment method. At the average transaction size for each instrument, MasterCard & Visa debit card payments are
more resource intensive than eftpos, while credit card transactions are the most resource-intensive card payment method even when excluding the costs of credit and rewards (Figure 1). Of all methods considered in the study, direct debit remains the lowest cost, while cheques remain the most expensive.
Figure 1: Direct Resource Costs
Per average-sized transaction for each payment method
Note: Payment function only
Source: Authors’ calculations based on survey data
• The aggregate and relative costs associated with card payments are changing considerably with the advent of contactless payments. Contactless card payments are estimated to incur 10 to 20 per cent lower resource costs than a comparable contact-based card transaction.
• Once fees and other transfers between sectors are included, the burden of private costs across sectors differs from that of resource costs and varies significantly across instruments. The majority of private costs are incurred by merchants and consumers who typically pay a net transfer to the financial sector to use payment services, although merchants may pass these costs on to consumers in general via the prices on their goods and services. Across instruments, the private cost to
consumers is relatively similar despite large differences in resource costs. On average, the private cost to consumers of using a credit card is similar to that for a debit card despite the higher resource costs incurred for credit card transactions. Although consumers pay fees to hold credit cards, they also receive significant incentives to use them to make purchases, due to rewards points and the interest-free period.
• Results from a survey of small and medium enterprises (SMEs) suggest that while the ranking of the private costs of instruments is similar to that for large businesses, the private costs faced by SMEs are higher. In part, this is because SMEs do not benefit from the economies of scale that can be achieved by large merchants due to their larger payment volumes. In addition, merchant service fees are higher for small businesses.
The rest of this paper proceeds as follows. Section 2 discusses the literature on payment costs. Section 3 outlines the scope of this study and details the estimation methodology. Section 4 presents resource costs of payments in Australia, both in aggregate and by instrument. This is supplemented in Section 5 by a discussion of how these costs are borne by different sectors. Section 6 examines how resource costs vary at different transaction sizes and Section 7 focuses on the private (gross) costs to SMEs of accepting payments. Section 8 concludes.
2.
Related Literature and Scope
The Bank’s 2007 study (Schwartz et al 2008) was among the first to use data collected directly from financial institutions and merchants to estimate the costs of making retail payments. Earlier studies had instead tried to estimate costs indirectly or focused on a narrower set of instruments (e.g. Food Marketing Institute 2000; Gresvik and Øwre 2003). The indirect measurement of costs – often via information on fees – arose because of the difficulties of obtaining commercially sensitive cost information. While fees are a reasonable proxy for costs in some situations, there are other instances where they are not sufficient given that profit margins are not separately identified and so are also captured in this measure of costs.
Since the Bank’s 2007 study, payment cost studies using proprietary data have been conducted almost exclusively by central banks as part of their role overseeing the efficiency of payments systems. These include a comprehensive study by Gresvik and Haare (2009) in Norway and a study coordinated by the European Central Bank (ECB) published in 2012 (Schmiedel, Kostova and Ruttenberg 2012).2 Results across different countries estimated the cost of
consumer-to-business payments at between 0.42 per cent and 1.35 per cent of GDP. Most of this dispersion arises from differences in underlying costs between countries rather than sectoral coverage.
In general, studies undertaken since the Bank’s 2007 cost study are similar in scope and methodology. In all cases, estimating the benefits of payments has been beyond the scope of these studies given the difficulties of defining and measuring these benefits. Any differences in scope or coverage have generally reflected national circumstances. For example, most countries participating in the ECB study did not include costs associated with cheques given they are generally not used extensively for retail payments in most of Europe.
2.1 Measurement of Costs
Studies of payment costs have focused almost exclusively on measures of long-run costs, which includes both the cost of the infrastructure required to support payments and the cost of making payments using that infrastructure.3 For example,
when applied to card payments, this long-run cost concept covers both the cost of point-of-sale terminals as well as the cost of conducting card transactions using this equipment. In practice, the average cost of making payments has been used as an estimate for long-run costs given the difficulty of measuring infrastructure costs that may be fixed in the short term but variable in the long term.
2 For more discussion on the benefits and limitations of cost studies for central banks, see Hayashi and Keeton (2012).
3 Arango and Taylor (2008) is one exception, looking at the marginal costs of different payment methods for merchants in Canada, along with merchant perceptions of costs, reliability and risk. Another is the paper by Garcia-Swartz, Hahn and Layne-Farrar (2006), which looks at benefits and costs.
One respect in which the measurement of costs differs across studies relates to how prescriptive each study has been around the allocation of costs that might be common to payment instruments and other business functions. Allocation is required because much of the infrastructure that supports payment transactions also facilitates other functions for financial institutions and merchants, such as managing statements and invoicing. To address this, some studies have taken a prescriptive approach as to the types of costs to allocate to payments in order to improve consistency across respondents, while others – including this study – have left these allocations to responding institutions to better account for differences in the structure of each.
2.2 Resource Costs, Private Costs and Transfers
When considering costs incurred by financial institutions, merchants and consumers in facilitating and making payments, most studies distinguish between resource costs and private costs. Resource, or social, costs are the economic resources expended by the various participants to ‘produce’ a payment (Schwartz
et al 2008). Additionally, participants may also incur or receive transfer payments
from other parties; combining these with the resource costs incurred by a participant generates the net private cost for that participant. These transfers are not resource costs as they are merely a redistribution between participants in the payments system rather than ‘real’ resources spent on the system as a whole. For example, a transaction fee paid by a merchant to its bank represents a transfer and a private cost to the merchant, but not a cost for society as a whole. Estimates of private costs are particularly useful in gauging the incentives for different parties to provide or use different payment services.
While resource costs have been the primary focus of international studies, analysis of institutions’ private costs has also been considered in a number of studies (e.g. Brits and Winder 2005; National Bank of Belgium 2006). Some studies have also combined this with an analysis of fixed and variable costs, thereby allowing for a consideration of how private incentives may change at different payment values and how these compare to socially optimal outcomes (Danmarks Nationalbank 2012; Segendorf and Jansson 2012).
2.3 Fixed and Variable Costs
Payment costs can be categorised into fixed and variable components. Fixed costs are generally infrastructure-type costs that would be incurred regardless of the number of payments made, while variable costs are those that depend on the number or value of transactions undertaken. The ability to distinguish between fixed and variable costs permits comparison of the cost of particular payment types as the transaction value varies. It can also inform the extent to which different payment instruments benefit from economies of scale.
The categorisation of costs as fixed or variable will differ to some extent between different institutions. This study asked financial institutions and merchants to indicate whether different cost items are fixed or vary with transaction volumes and values. Different cost items were then allocated as fixed or variable using this information.
2.4 Institutional Coverage and Data Collection
Institutional coverage is broadly similar across different studies of payment costs. Studies conducted by central banks tend to rely on direct surveys of the costs of financial institutions and merchants. Some studies collect additional data directly from companies that provide services to these entities, such as cash-in-transit companies, to examine more detailed aspects of resource and private costs (Segendorf and Jansson 2012). This paper follows the same approach as the Bank’s 2007 study by directly surveying financial institutions and merchants, and proxying the resource costs of their service providers by using the fees paid to them, paying careful attention to avoid double counting between resource costs and transfers.
Participation by financial institutions across other studies is typically quite high and the major banks of each country are generally represented. Merchant coverage is more varied, ranging from a handful of firms to over 1 000. For studies with a smaller number of respondents, merchant samples are usually focused on larger merchants. Even for studies involving a wider range of merchants, the cost information from larger merchants has tended to be more complete and up to date (Schmeidel et al 2012) and certain industries appear to have been more responsive
(for example, see comments by Gresvik and Haare (2009)). This study includes 17 large merchants, and has used a survey of small merchants (with around 260 respondents) to better understand any differences in costs faced by these businesses.
Estimates of the costs incurred by consumers in using payment instruments are often included in payment cost studies as extensions. Studies that consider the cost to consumers include Gresvik and Haare (2009) for Norway, and Danmarks Nationalbank (2012), Turján et al (2011) and Segendorf and Jansson (2012) for Denmark, Hungary and Sweden, respectively (as part of country-specific analyses of the data collected for the ECB study). This type of analysis relies on estimates of the number and value of transactions undertaken by consumers and the time taken to conduct these transactions to estimate the opportunity cost of payments activity. In line with these European studies and the Bank’s 2007 study, the current study has collected cost data directly from financial institutions and merchants, and has estimated consumer costs based on estimates of the time that consumers take to make payments. Therefore, consumer cost estimates are less robust than estimates of financial institutions’ and merchants’ costs and are not included in the reported estimates of total resource costs for the economy. More details on the construction of these estimates can be found in Appendix C.
2.5 Payment Instruments
The particular payment instruments included in each cost study have been determined by their relative importance to that country’s payments system. For example, cheques tend to be excluded from studies conducted by countries in which cheque use is low. Additionally, some studies focus solely on point-of-sale payments to the exclusion of billing and remote payments. Due to the wide variety of payment instruments used in Australia, this study’s coverage is in line with the most inclusive overseas studies. In particular, this study considers the costs associated with cash, debit and credit cards, cheques, direct debit and BPAY
payments.4 It also considers some of these individual payment methods in more
detail, including the costs for different methods of cash withdrawal, as well as different types of card and remote payments.
Reflecting recent developments in the Australian payments landscape, the study also examines the costs of new products and new methods of authorisation and/or authenticating retail payments. Recent innovations have included:
• The transition from using the magnetic stripe on cards to using chips for the storage of card details and transmission of these details to the terminal.
• The introduction of contactless payments functionality, which allows the wireless transmission of card details.
• The move from signature authentication to PINs for American Express, Diners Club, MasterCard and Visa cards (eftpos has always been PIN-only). In addition, lower-value payments often no longer require PIN authentication.
• The increased issuance of dual-network debit cards by the major banks.
• An increase in the number of institutions offering companion American Express cards.
These innovations will have directly altered the costs of accepting and making payments. For instance, some of these developments will have directly affected terminal and tender time costs for merchants, while others will have altered card production and fraud costs for financial institutions. These innovations may also have indirectly altered costs by affecting both the economies of scale for system participants and potentially the nature of competition.
4 The study also collected information on payments made through agency arrangements. Agencies handle payments on behalf of merchants. This can be electronically, such as PayPal, or physically, such as at Australia Post branches. Merchants directly incur low resource costs of a few cents per transaction when employing an agent. However, the agent can charge relatively high fees – often of up to 2 per cent of the transaction value – for providing this service. Market concentration prevents the disclosure of further results.
3.
Methodology
This study estimates the resource cost of consumer payments in the Australian economy in a manner similar to the Bank’s 2007 study and international studies. Financial institution and merchant costs were directly surveyed by the Bank and consumer costs are estimated based on the cost of a consumer’s time to make payments. This study focuses on average costs, which take into account the cost of infrastructure supporting payment instruments. The results shown are for weighted-average costs across entities, although the use of median costs leads to the same conclusions about the relative cost of instruments.
3.1 Data Collection and Sample
Consistent with previous studies, the current study focuses on payments by individuals to merchants rather than on business-to-business payments and/or person-to-person payments. The payment instruments covered by the study are estimated to account for nearly all of the number and more than 95 per cent of the value of consumer payments to businesses (Ossolinski, Lam and Emery 2014). The majority of costs are measured directly by surveying financial institutions, merchants and, in the case of the costs of currency production, the Reserve Bank and the Royal Australian Mint. In a few cases, costs are estimated indirectly based on publicly available information or the fees that survey participants pay (non-surveyed) third parties for payment-related services. For example, the resource costs of transporting cash was not directly collected from cash-in-transit companies but instead proxied by the fees paid for this service. While estimating some costs based on fees will overstate the cost of these payment services given that the profit margins of these third parties will also be captured, the size of these indirectly estimated costs is generally small in both absolute size and relative to other payment costs.
The detailed study included participation by 16 financial institutions and 17 large merchants, with around another 260 small merchants answering a separate small- and medium-sized business survey.5
• Financial institutions ranged in size from large banks to specialist service organisations. In aggregate, they reported nearly 30 million transaction accounts and 10 million personal credit card accounts, capturing the vast majority of all such accounts in Australia.
• Merchants were selected to cover a wide range of consumer expenditure categories. Ten large merchants were retailers predominantly collecting payments at the point of sale, whether in a supermarket, department store or general retail environment. Over the twelve-month sample period, these retailers reported total sales of $109 billion, about a third of the value of retail sales in Australia over 2013. The other seven merchants were billers that predominantly receive payments remotely – with little point-of-sale activity – for insurance, telecommunications and utilities. These billers reported total sales of $46 billion during the sample period, which represents a significant share of total household consumption on insurance, telecommunications and utilities of about $120 billion.
• Small merchants were recruited through a number of merchant associations, with more details provided in Section 7 and Appendix D.
Survey forms were distributed in April 2014. To reduce reporting burden, respondents were given flexibility in selecting the twelve-month period for which they reported costs. Financial institutions typically provided figures for the year to September 2013, while merchants provided somewhat more recent figures. The data were subjected to a number of validation checks following submission, including internal consistency checks, querying responses with participants, benchmarking against responses from other participants and comparison with other
5 Around half of financial institutions and merchants that were asked to participate in the study accepted. Those that declined cited competing demands on their time or an inability to provide sufficiently detailed payment cost information.
sources such as the Reserve Bank’s Retail Payments Statistics and responses to the 2007 study.
For financial institutions’ costs, personal and business transactions were identified separately. This allowed the estimation of costs per transaction to account for potential economies of scale and common costs across both personal and business transactions.
To obtain economy-wide estimates of the cost of consumer-to-business payments, estimates of costs per transaction for non-cash payments were scaled up by the number of these payments measured in the Retail Payments Statistics and information on the share of consumer-to-business transactions from the study. The per transaction cost estimates for cash transactions were scaled up by the number of consumer cash payments per person (Ossolinski et al 2014) and the population estimate for 2013. Following the 2007 study, minors between 9 and 17 years of age were assumed to make half the number of transactions of adults.
3.2 Caveats
A number of the caveats are worth bearing in mind. Like all such studies, the focus is on measuring resource costs (and some financial flows between parties). The study does not measure the benefits associated with different payment instruments nor whether the structure of the market promotes innovation. Both these factors need to be considered when drawing policy implications from these numbers; increased use of the lowest-cost payment system or less use of the higher-cost systems does not necessarily imply better outcomes.
A second issue is that while a comprehensive approach to identifying costs and the number of transactions has been used, coverage is not exhaustive. The study does not attempt to measure, for example, any costs arising from: the ‘cash’, ‘informal’ or ‘black’ economies; arguments that costs that might arise if cash is less hygienic
than cards (MasterCard 2014); or the costs to individuals experiencing credit stress from credit cards. These costs, by their very nature, are difficult to quantify.6
A third issue is the ability of financial institutions and merchants to separately identify costs and transactions across payment instruments. A number of financial institutions reported difficulty identifying subcomponents of costs, particularly overhead costs and the amortised share of previous investment expenditure. Further, some financial institutions reported that it was difficult to allocate costs across the different types of card payments. Similarly, some merchants were unable to distinguish between the costs of different types of card payments in the information provided to them by their acquirers. However, in most cases respondents were able to provide an estimate of total costs which were then apportioned across different cost items or instruments using the Reserve Bank’s understanding of the Australian payments industry and the costs incurred by similar institutions in the sample.
The final issue involves the choice of costs that are included when measuring the resource costs used in making credit card payments. Credit cards generally have three aspects – a mechanism by which consumers can pay a merchant, an interest-free loan for up to 60 days, and reward points tied to the value of the purchase. While each of these aspects is measured, the main results of this study focus on the payment aspects, and do not include the costs associated with the interest-free period or rewards. Including the costs of providing the rewards or the interest-free period would increase the cost of credit cards, particularly to financial institutions, although they remain less expensive than cheques.
6 For example, there is no reliable way to estimate the number of informal or black economy transactions that would cease if different payment options, particularly cash, were not available. In addition, the tax revenue forgone because of undocumented income and sales, which Chakravorti and Mazzotta (2013) identify as a large cost associated with the informal economy, could generally be considered – in the framework of cost studies as – an (illegal) transfer.
4.
Resource Costs of Payments
4.1 Overall Resource Costs
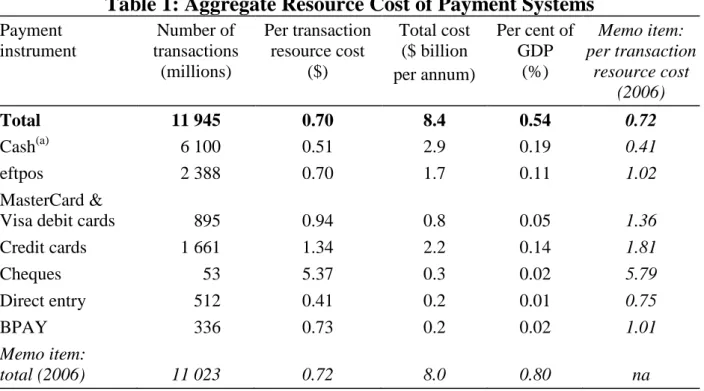
The aggregate resource costs incurred by large merchants, financial institutions and the public sector in facilitating consumer-to-business payments are estimated to have been about $8.4 billion per annum in 2013, or about 0.54 per cent of GDP (Table 1). Payment resource costs of consumers are estimated at an additional $2.6 billion, the equivalent of about 0.17 per cent of GDP or 0.41 per cent of household expenditure; these are not included in the estimate of aggregate costs as they are considerably less reliable than costs for merchants and financial institutions.7 Detailed results for the resource costs associated with each payment
instrument can be found in Appendix A.
Table 1: Aggregate Resource Cost of Payment Systems
Payment instrument Number of transactions (millions) Per transaction resource cost ($) Total cost ($ billion per annum) Per cent of GDP (%) Memo item: per transaction resource cost (2006) Total 11 945 0.70 8.4 0.54 0.72 Cash(a) 6 100 0.51 2.9 0.19 0.41 eftpos 2 388 0.70 1.7 0.11 1.02 MasterCard &
Visa debit cards 895 0.94 0.8 0.05 1.36
Credit cards 1 661 1.34 2.2 0.14 1.81 Cheques 53 5.37 0.3 0.02 5.79 Direct entry 512 0.41 0.2 0.01 0.75 BPAY 336 0.73 0.2 0.02 1.01 Memo item: total (2006) 11 023 0.72 8.0 0.80 na
Notes: Based on estimates from financial institutions and large merchants (a) Includes costs incurred by public sector
Sources: ABS; Authors’ calculations based on survey data; RBA
7 Consumer costs are discussed in more detail in Appendix C.
The results suggest that the aggregate resource cost of the payments system is little changed in nominal terms since 2006, although it has fallen as a share of GDP (Schwartz et al 2008). The per transaction cost of almost all instruments has fallen since 2006, which has worked to reduce the overall resource cost. At the same time, however, a change in the mix of payments since 2006 has worked to increase costs. In particular, the share of payments made using cash has fallen, while the share of payments made using cards, which typically require more resources per payment, has increased. Furthermore, growth in the total number of payments in the economy is estimated to have been slightly slower than growth in real GDP.8
It is worth noting that these estimates are likely to be somewhat sensitive to sample coverage. While, as noted above, the coverage of financial institutions is very good, the coverage of merchants is narrower, with detailed information focused on larger merchants that are likely to experience lower costs per transaction for payment services. Augmenting these results with indicative cost numbers from the small business survey (see Section 7) would increase the total costs to the economy to around $10 billion or 0.64 per cent of GDP.9 Such an augmentation is, however,
imprecise.10 Regardless of whether the base or augmented measure of aggregate
cost is considered, these aggregate estimates suggest that the cost of ‘producing’ a
8 The number of electronic transactions is measured directly from the population of financial institutions through the Retail Payments Statistics, while the number of cash transactions is estimated from survey data and is subject to a margin of error. Details of the preferred estimate of cash transactions are in Appendix B. If the higher estimate of cash transactions in Appendix B is used, the aggregate cost increases by 0.03 percentage points of GDP.
9 Australian Taxation Office data for sole traders, partnerships, and small- and micro-sized companies in consumer-facing industries suggest that they account for around $177 billion in sales, or 29 per cent of total sales in these industries. The costs incurred by SMEs was not estimated in the 2007 study.
10 There are a number of caveats: the SME cost estimates primarily focused on private costs (resource cost estimations are inferred); a much smaller share of SMEs responded to the survey; the industry coverage may not be representative; it was not possible to implement the same quality assurance processes around data from these institutions; and the scaling of payments made to SMEs is less certain.
payment in the Australian payments system is towards the lower end of estimates for other economies for which studies have been undertaken.11
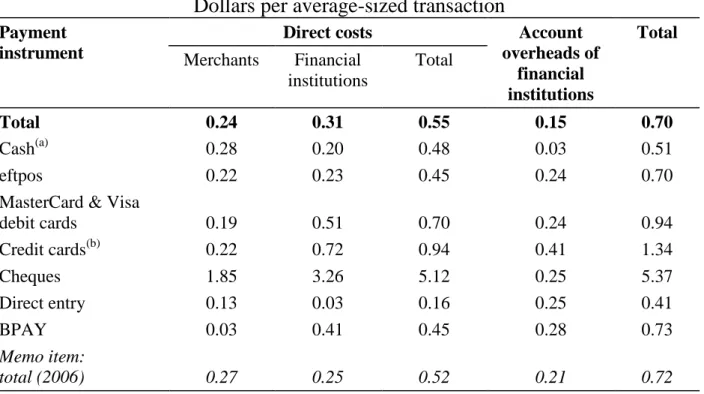
The per transaction resource costs presented in Table 1 are the sum of both the direct costs of each payment and the costs of managing the accounts from which payments are made or received; Table 2 shows these costs separately. In this paper, the comparison of costs across instruments focuses on differences in direct costs because these costs are incurred in the chain of events required to make a payment; the costs of maintaining accounts are excluded because these costs can be common costs across a number of payment instruments. Account keeping costs are discussed separately to direct costs in more detail in Section 4.2.
Focusing on total direct costs, the least costly options that are typically available at the point of sale are cash and eftpos at $0.48 and $0.45 per transaction (Table 2). MasterCard & Visa debit and credit cards use around 1½ to 2 times the level of resources per transaction than either cash or eftpos. Of the remote payment options, direct debit is considerably less resource intensive than BPAY, debit and credit cards. Finally, cheques are the most resource intensive of the payment methods considered by the study by a considerable margin, costing over $5 per transaction. These rankings of cash, debit cards, credit cards and cheques are broadly consistent with overseas studies and the 2007 study.
A number of factors are relevant when considering the relative resource costs of these instruments. First, for the purpose of comparing the overall resource intensity of different instruments it is relevant to consider how they are actually used in the economy, and so the costs are measured at the average transaction size for each instrument. Section 6 explores in more detail how transaction size and cost are related. One implication of that analysis is that while cash is reasonably cheap for
11 A thirteen country study of payment costs in Europe found that resource costs associated with payments accounted for an average of about 1 per cent of GDP, with results for individual countries ranging from 0.42 per cent to 1.35 per cent of GDP (Schmiedel et al 2012). A recent estimate for Norway suggests costs of about 0.48 per cent of GDP (Norges Bank 2014). The extent to which international studies have been able to incorporate small business costs is not entirely clear, but the results of these studies are likely to reflect the costs of large businesses which are better able to provide accurate data on costs and payment volumes (Scheimdel
et al 2012, p 12).
the small-value payments for which it is used ($26 on average, based on data from the RBA’s 2013 Survey of Consumers’ Use of Payment Methods), it is not necessarily a low-cost instrument at larger transaction sizes.12
Table 2: Per Transaction Direct Costs and Account Overheads
Dollars per average-sized transaction
Payment instrument
Direct costs Account
overheads of financial institutions Total Merchants Financial institutions Total Total 0.24 0.31 0.55 0.15 0.70 Cash(a) 0.28 0.20 0.48 0.03 0.51 eftpos 0.22 0.23 0.45 0.24 0.70 MasterCard & Visa
debit cards 0.19 0.51 0.70 0.24 0.94 Credit cards(b) 0.22 0.72 0.94 0.41 1.34 Cheques 1.85 3.26 5.12 0.25 5.37 Direct entry 0.13 0.03 0.16 0.25 0.41 BPAY 0.03 0.41 0.45 0.28 0.73 Memo item: total (2006) 0.27 0.25 0.52 0.21 0.72
Notes: (a) Direct costs to financial institutions for cash transactions include costs incurred by the public sector (b) Does not include the costs of the credit function and rewards
Sources: Authors’ calculations based on survey data; Schwartz et al (2008)
Second, relative resource costs also reflect the features of the different products. For example, the fact that eftpos did not offer card-not-present or international payments at the time of the study is likely to be one reason why the average resource cost per transaction is estimated to be significantly lower for eftpos transactions than for MasterCard & Visa debit card transactions or credit card transactions. It is also important to restate that the costs of credit provision and rewards, the differentiating features of credit cards, are not included in the payment costs calculated above. Including the cost of resources used for these functions and the transfers to consumers, the average total private cost of a credit card payment
12 Some indicative transaction sizes for consumer-to-business payments are: eftpos $52, MasterCard & Visa debit cards $69, credit cards $128, cheques $3 533, direct debit $510 and BPAY from a transaction account $540 (Table B1).
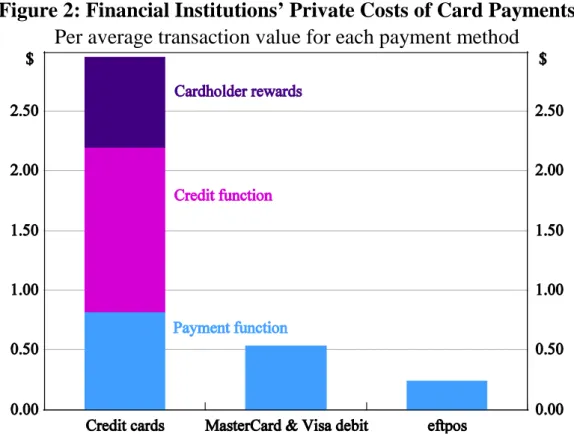
for financial institutions is estimated to be $2.95 per average transaction (Figure 2). The effects of fees and transfers are discussed in Section 5.
Figure 2: Financial Institutions’ Private Costs of Card Payments
Per average transaction value for each payment method
Note: Excludes account overheads
Source: Authors’ calculations based on survey data
Third, economies of scale in the provision of payment services also influence costs per transaction. The ranking of cash and debit card costs in overseas studies provides some support to the idea that there are economies of scale. Countries with high cash use relative to debit card use (like Hungary and Portugal) report that cash is cheaper than debit cards on a per transaction basis, while studies for those countries which make greater use of debit cards (Denmark, Norway and Sweden) report that debit cards are cheaper (Schmiedel et al 2012). However, the costs per transaction across countries may also reflect greater use of lower-cost instruments within countries.
Fourth, differences in tender time – the time between the customer being informed of the transaction amount and the time the payment is completed – can play an
important role in determining costs per transaction.13 For point-of-sale payments,
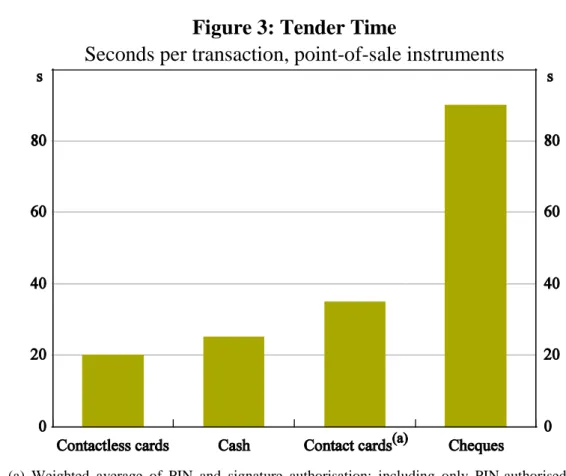
figures obtained from a number of large merchants suggest, for example, that tender time for a cash transaction is about 25 seconds (Figure 3). Overseas research suggests broadly similar times, of about 20–30 seconds per cash payment (Bradford 2005; Borzekowski and Kiser 2008). Cheque transactions are found to be the slowest, taking somewhere between one and two minutes. Signature- and PIN-based card transactions are reported by merchants to be slower than cash but considerably quicker than cheques. Contactless card transactions are estimated to be slightly quicker than cash transactions, although different merchants in our sample reported contrasting experiences.14 Polasik et al (2013) report broadly
similar transaction times between cash and contactless transactions in Poland. The difference in tender time between contactless and contact transactions does not affect the ranking of instruments at their average transaction sizes, but can affect the ranking of instruments at low transaction values (see Section 6).
13 Some studies define tender time more broadly, potentially including the time taken in queuing at the point of sale or the time taken to ‘ring up’ the total sale price from individual items. Such costs are not, however, explicitly estimated in this study. In the first case, queuing time will be influenced by a range of factors beyond the payment method choice. In the second case, the time taken to ‘ring up’ sales is not a time cost that arises from a particular payment method but rather part of the wider sales and inventory management process.
14 For the purposes of this study, ‘contactless card payments’ refers to transactions using contactless technology and which are under $100 (and hence do not need a PIN). Contactless card payments can be made for values over $100 with the use of a PIN, at which point tender time could be assumed to be the same as a contact-based card transaction. A few factors seem to influence whether cash or contactless card transactions are reported to be quicker. These include such factors as the technology in the PIN pad used by the merchant, the transaction size (with payments around the same size as currency denominations more likely to be made with cash), whether the contactless transaction can be processed ‘offline’, etc. A number of merchants also noted that the occasional failure of a contactless transaction increases tender time as the consumer has to retry their card or switch payment types.
Figure 3: Tender Time
Seconds per transaction, point-of-sale instruments
Note: (a) Weighted average of PIN and signature authorisation; including only PIN-authorised transactions reduces this by four seconds
Source: Authors’ calculations based on merchant estimates
Most resource costs are incurred by financial institutions ($5.4 billion), although sizeable costs are also incurred by merchants ($2.9 billion).15 Financial
institutions’ costs largely consist of the costs incurred to directly support payments being made, in particular the costs of building and maintaining information technology (IT) networks, the cost of processing payments (particularly the manually intensive processes surrounding cash processing and distribution) and customer service costs. In addition, the costs associated with running transaction and credit card accounts, which provide the capacity to make payments, are considerable.
The overall resource cost to financial institutions is estimated to be little changed since 2006, reflecting a range of developments that have affected resource costs in
15 Resource costs are also incurred by the public sector, which produces and distributes notes and coins, and runs some of the centralised components of the payments system. However, these are very small on a per transaction basis.
offsetting ways. On a per transaction basis, costs of running accounts are lower for all payment methods. In part, this reflects the fact that the intervening years have seen efficiency gains, such as those associated with the greater use of the internet to offer services. It also reflects the fact that the fixed costs are now spread across a greater number of electronic payments. Costs directly related to payment activities are also lower, with the exception of MasterCard & Visa credit cards. Investment in payment infrastructure by the financial and public sectors since 2006 is another factor that has reduced per transaction costs for many instruments in 2013.16
Offsetting these cost savings, consumers have been making greater use of more expensive instruments.
Since 2006, merchant resource costs are largely unchanged in aggregate, although there have been changes in some cost components. For example, costs have been lowered by initiatives that speed up tender time (including the move from signature to PIN verification and the introduction of contactless payments). Concurrently, costs have been boosted by higher staff wages and investment expenditure associated with terminal upgrades in order to process chip-and-PIN and contactless transactions.
4.2 Account Maintenance Costs
With the exception of cash transactions, all payment options covered in this study require a consumer to establish a transaction or credit card account at a financial institution. The establishment and maintenance of these accounts involves a number of costs for financial institutions. Examples include the cost of staff time used in processing applications and customer requests, the building and upkeep of IT systems and the marketing of new products.
Annual costs per account are estimated to have fallen since the 2007 study. Part of the decline in the per account costs can be explained by economies of scale. However, there has also been a broad-based decrease in the costs of many different
16 For example, the Community of Interest Network (COIN) has worked to reduce the number of physical network connections in the direct entry, eftpos and ATM systems. The Reserve Bank has also overseen the linking of the COIN and the SWIFT network for the exchange of bulk files, thereby simplifying the process of sending settlement instructions. Developments specific to each instrument are discussed further below.
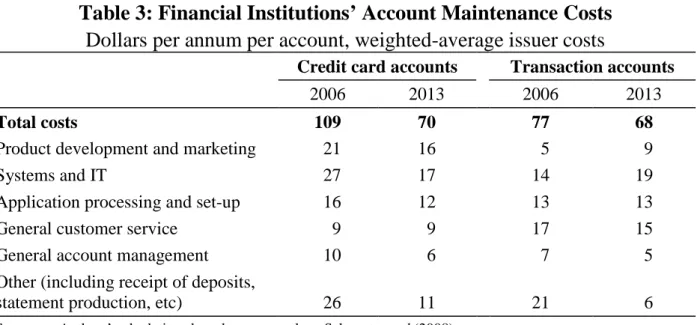
components – such as systems and IT, application processing, general customer service and statement production costs (Table 3). This is likely to reflect both changes in the way that customers interact with their financial institutions as well as operational efficiencies from previous upgrades to core banking and customer systems (Stewart, Robertson and Heath 2013). That is, customers are undertaking more of their banking business through relatively inexpensive online channels, rather than through bank branches or telephone banking, while the costs associated with online channels have also fallen. For example, in 2006, respondents reported that telephone banking calls – often answered by staff – comprised close to 30 per cent of telephone- and internet-based connections. By 2013, telephone banking calls comprised only 5 per cent of these connections and rarely involved staff interaction.
Table 3: Financial Institutions’ Account Maintenance Costs
Dollars per annum per account, weighted-average issuer costs
Credit card accounts Transaction accounts
2006 2013 2006 2013
Total costs 109 70 77 68
Product development and marketing 21 16 5 9 Systems and IT 27 17 14 19 Application processing and set-up 16 12 13 13 General customer service 9 9 17 15 General account management 10 6 7 5 Other (including receipt of deposits,
statement production, etc) 26 11 21 6
Sources: Authors’ calculations based on survey data; Schwartz et al (2008)
Sections 4.3 to 4.6 cover the costs of each instrument excluding these account maintenance costs.
4.3 Cash
While cash is the most widely used payment method in Australia for consumer transactions there are some challenges in measuring the costs of cash payments. Its widespread use means that measuring the ‘end-to-end’ cost of a cash payment involves estimating the costs incurred by a large number of entities, including financial institutions, merchants, consumers and the public sector. For example,
financial institutions incur costs running branch and ATM networks that allow customers to withdraw and deposit cash; merchants incur costs in handling cash, both at the point of sale and during the performance of back-office functions; the public sector incurs costs producing the physical notes and coins; and consumers incur costs – mainly their time – in obtaining and using cash. Furthermore, some of cash’s characteristics – such as the ability to withdraw a large amount to make multiple payments and the absence of a centralised ledger or record keeping – mean that estimating the total number of cash transactions in the economy, and hence costs per transaction, is particularly difficult.
Addressing these issues in a broadly similar fashion as Schwartz et al (2008), this study estimates the total resource costs (excluding consumer costs) associated with cash payments to be $2.9 billion in 2013. The resource cost of cash transactions arise almost entirely from the costs associated with withdrawing and accepting cash, with little cost incurred in its production or in other activities, such as maintaining accounts to support cash transactions. Based on an estimated 6.1 billion consumer-to-business cash transactions per annum, the average direct cost of using cash is about $0.48 per transaction (Table 2).17 This is somewhat
higher than estimated at the time of the 2007 study.18
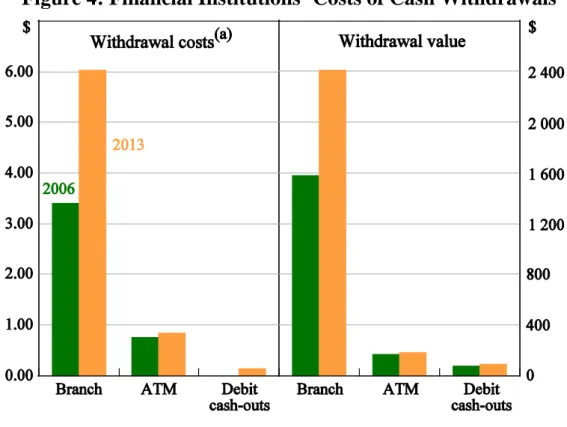
In regards to cash withdrawals, financial institutions are estimated to incur costs of about $0.91 (the average value of a personal cash withdrawal is about $280). The majority of cash withdrawals occur through ATMs, which involve an average cost of $0.85 per transaction (Figure 4). Costs associated with the maintenance of branches – including their staffing and location rental – mean that withdrawals
17 Information on the methodology used to calculate the number of cash transactions can be found in Appendix B.
18 The approach to cash in the 2014 study is slightly different to the 2007 study. In line with the approach taken for other payment instruments, the costs of cash considered in this study include only costs directly relevant to consumer payments to businesses: the costs of consumers withdrawing cash, and the cost to merchants of accepting cash payments and making deposits. In contrast to the 2007 study, the costs to financial institutions of consumer cash deposits and business cash withdrawals have been excluded, as the majority of these costs are likely to relate to transactions outside the scope of this study, such as person-to-person, business-to-consumer or business-to-business payments. The total cost of cash for 2006 in Table 4 is calculated using the 2014 methodology and so differs from the number presented in the 2007 report ($0.44 per transaction).
through this channel are particularly costly, at around $6.00. This difference has become increasingly stark since 2006 as a diminishing number of withdrawals at branches has reduced the scope to spread the fixed cost of branches.19 The total
resource cost of a debit cash-out withdrawal – whether a stand-alone transaction or combined with the purchase of goods or services – is estimated to be about $0.44 per withdrawal. Merchants incur the majority of this cost, about $0.30 per withdrawal, mainly in tender time, with financial institutions incurring the remaining costs.20
Figure 4: Financial Institutions’ Costs of Cash Withdrawals
Note: (a) Costs for debit cash-outs were not estimated for 2006 Source: Authors’ calculations based on survey data
19 Discussions with some banks suggest that the diminishing number of cheque transactions has made it harder to accurately measure the separate costs of cash and cheque acceptance at branches, implying that the estimate of the costs of branch cash withdrawals are potentially overstated while financial institutions’ costs of cheques may be understated.
20 Resource costs associated with purchase-only eftpos transactions are discussed in Section 4.5.
It is also worth noting that the costs of ATM withdrawals differ markedly across ATM owners. For example, while the average ATM-based cash withdrawal is estimated to cost ATM owners about $0.77 (with card issuers incurring the extra $0.08 per transaction), a few entities reported average costs of between $1 and $2.50. This is potentially a function of the ATM owner’s size and is heavily influenced by whether the entity’s ATM locations are owned or rented from other parties. In the latter case, for example, the ATM owner often pays high rent to the site owner to install and run a machine in a ‘convenience’ location (such as a store, petrol station or licensed venue).
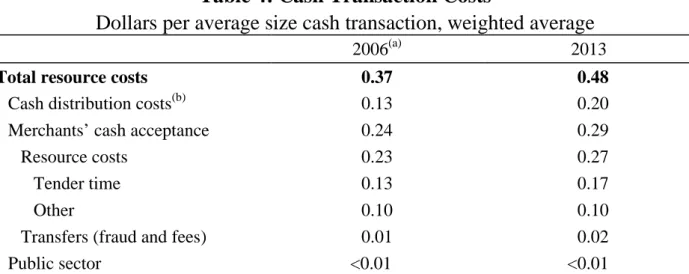
Overall, the average cost of a cash payment is estimated to be around $0.48 (Table 4). Around $0.20 of these costs are incurred by financial institutions and merchants in the course of distributing cash (given the cost per withdrawal
discussed above is spread over multiple transactions). Merchants incur costs per transaction of approximately $0.27 in accepting cash, with the largest single component – about two-thirds – being tender time. The cost of tender time has increased somewhat since 2006, reflecting higher staff wages. To some degree tender time costs will have been reduced as more retailers offer self-serve checkouts. This has, however, shifted some of the costs to consumers and increased merchants’ spending on point-of-sale equipment.
Table 4: Cash Transaction Costs
Dollars per average size cash transaction, weighted average
2006(a) 2013
Total resource costs 0.37 0.48
Cash distribution costs(b) 0.13 0.20 Merchants’ cash acceptance 0.24 0.29 Resource costs 0.23 0.27 Tender time 0.13 0.17 Other 0.10 0.10 Transfers (fraud and fees) 0.01 0.02 Public sector <0.01 <0.01
Notes: (a) Two methodological changes around the exclusion of consumer deposit and business withdrawal costs to financial institutions have resulted in the aggregate costs per transaction in 2006 reported above ($0.37) being lower than was reported in 2007 ($0.44)
(b) Includes merchants’ costs of providing cash-outs Source: Authors’ calculations based on survey data
The cost of cash and coin production for the public sector is estimated to be less than $0.01 per transaction. This includes the costs associated with the production process (including equipment, materials and labour), research and development, the distribution of the currency (including storage and security), and note quality testing and counterfeit prevention. The low cost of cash production is consistent with a range of international evidence. For example, for Canada, Switzerland and the United States, banknote costs were below $0.36 cents per banknote21 (Williams
and Anderson 2007), with a banknote only having to be used around 20 times for its costs to average around $0.01 per payment.
4.4 Personal Cheques
The total resource costs associated with cheque payments by consumers are estimated to be $0.3 billion (Table 1), lower than in 2006. Each cheque is estimated to impose resource costs of $5.12 per transaction, making cheques the most expensive retail payment method covered by the study (for more detail, see Table A6).
The change in the cost per transaction of cheques over the past decade is uncertain. Schwartz et al (2008) estimated total resource costs of about $5.30 per transaction, but noted that this might be overstated given alternative estimates (Centre for International Economics and Edgar, Dunn and Company 2006) and that estimating these costs was particularly challenging. The difficulty in estimating cheque costs remains, especially given these instruments now make up less than 1 per cent of consumer payments. Again, difficulties in separating cheque and cash costs might potentially result in some overstatement of the costs of cash transactions and an understatement of the costs of cheque transactions.
Notwithstanding these difficulties, there are a number of reasons why the costs for financial institutions’ of cheques may have fallen since 2006, with the point estimates suggesting a fall from $4.22 to $3.26 per transaction. These include the major banks outsourcing their cheque processing arrangements around the time of the earlier study, reorganising and consolidating the processing of cheques, and
21 Range calculated from local currency estimates converted to Australian dollars on 11 August 2014.
investing in systems that image cheques to help reduce costs associated with customer inquiries (and in the future, the transporting of cheques).
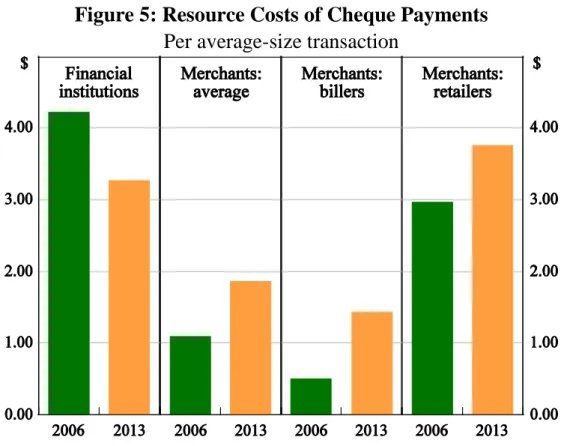
The cost of cheque usage varies significantly for merchants across and within sectors (Figure 5). This is influenced by a number of operational differences across merchants. For example, billers bear no tender time costs as they do not have a physical presence. Also, the ability to attach additional information to a cheque payment (e.g. stapling a cheque to the bill and sending them together in the post) means that these payments remain more prevalent for billers than retailers, and hence billers can still benefit from some economies of scale. Although a private cost and not a resource cost, retailers can also pay a fee of up to 10 per cent to guarantee receipt of funds even if the cheque bounces. Given the high cost, a number of larger merchants noted during the study that they have now stopped accepting cheques.
Figure 5: Resource Costs of Cheque Payments
Per average-size transaction
4.5 Credit and Debit Cards
Both credit and debit cards offer consumers the ability to pay electronically for goods and services as well as to obtain cash using either cash-out or cash advance facilities. As well as enabling consumers to pay at the point of sale, credit and debit cards allow transactions to be conducted over the internet and phone.
A number of credit card networks operate in Australia – most notably American Express, MasterCard and Visa – allowing cardholders to undertake transactions using funds borrowed from their financial institution. Beyond offering cardholders the use of these funds – often on an interest-free basis for up to 60 days – these cards often also provide rewards on amounts spent. The three debit card networks operating in Australia – eftpos, MasterCard and Visa – offer cardholders similar payment functionality; consumers pay using their own funds and generally do not receive any rewards. Different credit and debit card networks can incur different costs, potentially reflecting differences in the efficiency of parties in the transaction and the features offered by the networks.
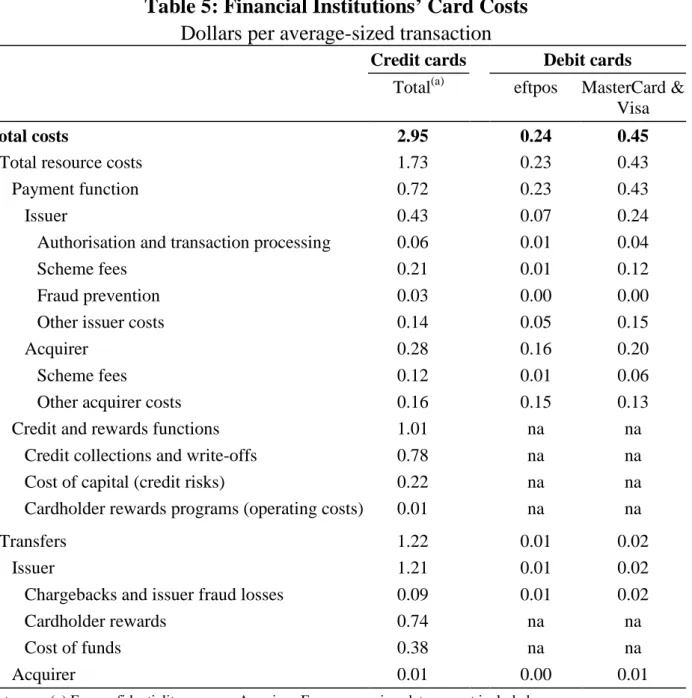
In aggregate, the study indicates that consumers’ use of the credit and debit card systems for payment-related purposes (as opposed to credit and rewards functions) consumed resources of about $3.0 billion (excluding account overheads), with the majority of this comprised of resources used in credit card transactions (Table 1). On a per transaction basis, both eftpos and MasterCard & Visa debit card transactions continue to involve lower resource costs than credit card transactions (Tables 5 and 6).
Table 5: Financial Institutions’ Card Costs
Dollars per average-sized transaction
Credit cards Debit cards
Total(a) eftpos MasterCard & Visa
Total costs 2.95 0.24 0.45
Total resource costs 1.73 0.23 0.43 Payment function 0.72 0.23 0.43 Issuer 0.43 0.07 0.24 Authorisation and transaction processing 0.06 0.01 0.04 Scheme fees 0.21 0.01 0.12 Fraud prevention 0.03 0.00 0.00 Other issuer costs 0.14 0.05 0.15 Acquirer 0.28 0.16 0.20 Scheme fees 0.12 0.01 0.06 Other acquirer costs 0.16 0.15 0.13 Credit and rewards functions 1.01 na na
Credit collections and write-offs 0.78 na na Cost of capital (credit risks) 0.22 na na Cardholder rewards programs (operating costs) 0.01 na na Transfers 1.22 0.01 0.02
Issuer 1.21 0.01 0.02 Chargebacks and issuer fraud losses 0.09 0.01 0.02 Cardholder rewards 0.74 na na Cost of funds 0.38 na na Acquirer 0.01 0.00 0.01
Note: (a) For confidentiality reasons, American Express acquirer data are not included Source: Authors’ calculations based on survey data
Table 6: Merchants’ Card Costs
Dollars per average-sized transaction
Credit cards Debit cards
Total(a) eftpos MasterCard & Visa
Total costs 0.66 0.24 0.32
Total resource costs 0.22 0.22 0.19
Card present
Total costs 0.52 0.24 0.25 Total resource costs 0.21 0.22 0.17 Tender time 0.17 0.19 0.14 Contactless 0.11 na 0.12 Contact-only 0.20 0.19 0.22 Other POS 0.03 0.03 0.02 Other (including back-office processing) 0.01 0.01 0.01 Transfers 0.32 0.02 0.08 Fees to acquirers 0.32 0.02 0.08 Other transfers (including fraud) 0.00 0.00 0.00
Card not present
Total costs 2.07 na 1.28 Total resource costs 0.38 na 0.45 Transfers 1.69 na 0.83 Fees to acquirers 1.63 na 0.75 Other transfers (including fraud) 0.06 na 0.08
Note: (a) Includes American Express, MasterCard and Visa Source: Authors’ calculations based on survey data
The lower resource costs of debit card transactions for financial institutions partially arise from differences in scheme fees – which are used as a proxy for the resource costs incurred by the schemes (Table 5).22 Scheme fees within the eftpos
network average only $0.02 per transaction, well below the $0.19 average for MasterCard & Visa debit transactions and the $0.32 average for MasterCard &
22 For example, schemes may incur costs of clearing, marketing and centralised governance and product development.
Visa credit transactions.23 Other costs of eftpos cards – including card production,
transaction processing and fraud prevention – are also lower than the equivalent costs for the MasterCard & Visa debit and credit networks. These differences in cost are, in turn, partially influenced by differences in card characteristics. At the time of the study, for example, eftpos transactions could only be authorised with the use of a PIN while other debit and credit cards allowed both PIN and signature authorisation at retailers and could be used online, resulting in higher fraud-related costs.24 Likewise, eftpos cards had lower costs of production than
contactless-enabled MasterCard & Visa debit and credit cards as they did not have chip or contactless functionality.
For merchants, the lower resource costs of debit card transactions largely reflect differences in tender times (Table 6). In particular, credit card transactions generally have higher transaction amounts than debit cards – making it more likely that the consumer will have to use a slower signature or PIN authorisation rather than being able to use contactless functionality. Indeed, the study suggests that tender time costs for a contact transaction are about $0.20 per transaction, relative to $0.11 per transaction for a contactless payment. (This also explains why contact-only eftpos transactions involve more resource costs for merchants than MasterCard & Visa debit transactions, which include a significant proportion of contactless transactions).
Since 2006, the resource costs associated with eftpos transactions have fallen on a per transaction basis, reflecting lower costs to merchants (Table A5).25 The largest
contributing factor is that the reported tender time cost of eftpos transactions has fallen; although eftpos did not offer contactless transactions in 2013, merchants reported that processing speeds have increased. Other costs of eftpos transactions have also fallen, presumably driven by economies of scale as the number of eftpos transactions has doubled.
23 Interchange fees are not a resource cost and are excluded from this calculation; see Section 5 for private cost calculations.
24 Signature authorisation was phased out subsequent to the study period.
25 The evolution of MasterCard & Visa debit card costs is not presented owing to the small number of entities able to provide costs on this item in the 2007 study.
In contrast, the costs of credit cards have increased slightly since the previous study (Table A3). The small increase primarily arises from higher scheme fees. Furthermore, the costs of ‘acquiring’ credit card transactions have also increased marginally for financial institutions, as more advanced terminals have needed to be installed at merchants to take advantage of contactless cards. These implementation costs have only been partially offset by lower fraud losses from the improved security.26
Resource costs of credit cards faced by point-of-sale merchants have fallen, reflecting a decrease in tender time costs and other point-of-sale transaction costs (Table A4). However, the resource costs faced by merchants accepting card-not-present transactions have increased, driven by spending on scheme initiatives to improve the security of customer card details.
Finally, within credit cards, the resource costs of transactions using American Express and MasterCard or Visa cards are similar where data are available (Tables A3 and A4; note that acquiring data for American Express are excluded to maintain confidentiality). Regardless of which card network is used, credit cards are more resource intensive than debit card transactions.
4.6 Direct Debit and BPAY
Direct debit payments involve the automatic debiting of funds from a customer’s transaction or savings account. These are initiated by merchants who have obtained prior authorisation from their customer.27 There is no scheme involved in direct
debit payments; direct debits are facilitated by the set of bilateral relationships between financial institutions.28 BPAY, in contrast, is a scheme that financial
institutions can join. BPAY allows a customer to pay a bill or invoice using the
26 The majority of fraud costs now arise from card-not-present (online) transactions (APCA 2014). Discussions at the time that the scope of this study was being determined indicated that financial institutions did not consider there to be a significant difference in fraud losses between contact and contactless transactions.
27 Authorisation may also be obtained by the merchant to debit payments from the customer’s credit card account. These are processed and settled through the relevant credit card network and so treated as a credit card payment in this report.
28 Clearing rules have been established by the Australian Payments Clearing Association.
biller’s unique BPAY identifier and the customer’s unique customer number (generated by the merchant).
Both direct debits and BPAY have relatively low resource costs. They involve the lowest resource cost to merchants of all the payment methods considered, primarily because both are remote electronic payment options involving no tender time and few manual processing tasks. As for other instruments, the per transaction costs associated with these payments have fallen since 2006 (Tables A6 and A7); the economies of scale generated by continued growth in transaction volumes have more than offset an increase in the aggregate costs incurred by merchants and financial institutions.
Merchants incur higher back-office costs for direct debits than for BPAY; the authorisation process can involve manual processes and merchants may incur costs chasing failed payments as there is no guarantee that funds are available in the customer’s account at the due date of the automated payment. In contrast, financial institutions incur higher costs for BPAY transactions than direct debits; financial institutions incur costs setting up and servicing BPAY biller accounts (which offer billers more services than are built into direct entry payments) and pay scheme fees to BPAY for clearing, marketing, centralised governance and product development services.29 In total, direct debit payments involve the least resource cost across all
payment methods, reflecting the very simple service they provide, which uses the long-standing direct entry system with no other built-in features.
5.
Private Net Costs
The discussion so far has focused on the resources used by each sector to produce a given payment. However, the cost borne by each participant in the payment chain – the private net cost – depends on both the resources used and the transfers between the participants in the form of fees or implicit charges. Analysis of net private costs demonstrates how total resource costs for society are distributed across the participants and is more relevant in the private decision-making of consumers,
29 Costs relating to BPAY View were excluded as this is an invoicing function of BPAY, not a payment function (although it may lower costs relating to exceptions management).