How the Masters of IT
Deliver More Value
and Less Risk
December 2010
Contents
Executive Summary
Overview 3
The Best Performing Masters of IT 3
Guidance and Recommendations 4
Detailed Benchmark Findings Background and Introduction 6
GDP Growth Rates and Corporate Profits 7
Benchmarked Outcomes: Growth and Risk Metrics 7
Revenue, Profit, and Customer Retention 8
Impact of Revenue and Profit on IT Spend 9
Business Risks related to the use of IT 10
Outcomes by Size and Spend on IT 11
Who Manages Value, Risk and Compliance for IT 13
Focus of Evaluation and the IT Portfolio 14
Tools for Managing Value and Risk: Collaboration, Dashboards, Scorecards and Reporting 14
Proven Management Tools for Delivering Value from IT 15
Balanced Scorecards, IT Portfolio Management and COBIT ` 16
Corporate Governance and IT Governance: Similar and Different 17
Proven GRC Tools for IT 19
Largest Business Risks related to the use of IT 20 Sources of Information for Risk and Compliance 21
Impact of Automated Information Gathering and Reporting 21
Timeliness of Assessments and GRC Tools 22
Systems of Record for Assessment Findings 23
Systems of Record for Policies Governing the use of IT 24 Systems of Records for IT Assets and Controls 25
Systems of Record for Risks and Regulatory Mandates 26 Delivering More Value and Less Risk 27
Choosing Wisely 28 The Management and GRC Tools Delivering More Value and Less Risk 29
Additional Resources 31
About the Research 32
About IT Policy Compliance Group 33
Executive Summary
Overview
This research report covers findings from primary research conducted by the IT Policy Compliance Group (ITPCG) on the masters of IT, and what these people and organizations are doing differently with IT to deliver the most value and least risk, compared with all other organizations.
The Best Performing Masters of IT
The major findings reveal several management practices, tools and supporting IT systems that are unique to the best performing organizations. These include:
Profile of the Masters of IT Revenue and profits that are
75 percent higher than industry peers
Customer retention-rates that are 50 percent higher than industry peers
Spending on IT budgets that is 30 percent higher than industry peers
Spending on information security that is 37 percent higher than peers
Business disruptions that are
100 percent lower than industry peers
Data loss or theft incidents that are 75 percent lower than industry peers
Audit deficiencies that are
65 percent less than industry peers
IT Balanced Scorecards that are linked to business Balanced Scorecards
Ongoing IT Portfolio revision for effective management of asset use, growth strategy, value and risk
Strategic IT Maps that align value and risk between the business of the enterprise and IT
Standardization on COBIT, ISO and CIS benchmarks to preserve value, manage controls and mitigate risk
Organizational contribution and consensus that is enabled through the use of collaborative applications
The use of IT GRC applications and systems to preserve value, manage risk and regulatory mandates
Electronic systems of record in IT GRC systems for values, policies, controls, risks, assets and regulatory mandates
Automation of key procedures to manage value and risk
Daily, weekly and bi-monthly assessments to manage value and risk
Dashboards, scorecards and reporting focused on operating units, business units, business functions, regulatory mandates, across silos and people
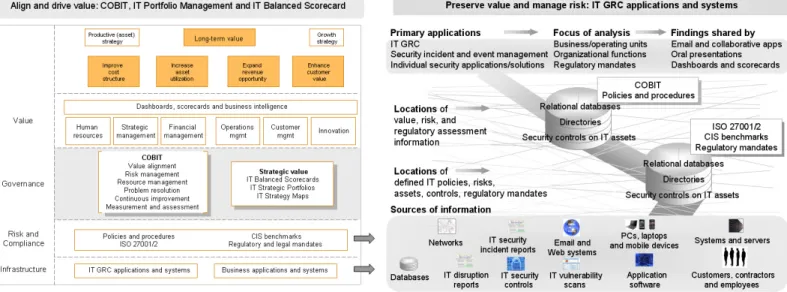
The masters of IT are using COBIT, IT Balanced Scorecards and IT Portfolio Management to align and deliver more Value, while using IT GRC systems and applications to preserve value, manage risks and regulatory mandates. Figure 1: How the Masters of IT Deliver More Value and Less Risk
Source: IT Policy Compliance Group, 2010 Guidance and recommendations based on the research findings include:
Guidance and Recommendations
Key insights to consider
Value depends on communication, not just management tools
Communication depends on acquiring and sharing usable information
Paper, spreadsheets and office applications do not scale and are unreliable
Automation to gather and report on value, risks and controls is key to improved results
IT GRC applications and systems manage the largest risks related to the use of IT, including: - Lost or stolen customer data
- Lost of stolen corporate data - Internet security threats - Business downtime
- At risk revenue, profit and customer retention
Identify the critical parts of the business mix that depend on the delivery of value from IT
Identify the high-risk parts of the business mix that depend on the use of IT
Use specific management tools to align and manage value, including:
- IT Balanced Scorecards, Strategic IT Maps, IT Portfolio Management and COBIT
Encourage input from senior leaders and
establish collaboration among functions and teams
Manage value, risks, controls and compliance with specific IT GRC systems, including: - COBIT, ISO, CIS benchmarks
- Applications for dashboards, scorecards,
assessment, reporting, workflow and collaboration
Organization of the Report
There are four sections to this report, as follows:
Executive Summary:
Key findings and recommendations from the research
Detailed Benchmark Findings: Detailed findings of the research
Additional Resources:
Additional readings, organizations, publications and educational resources
Research Background:
Sample sizes and demographics of the research
Detailed Benchmark Findings
Background and Introduction
During the past year, advisory members of the IT Policy Compliance Group requested research that would assist them and their organizations for a number of hot-topic strategies and initiatives. A few of
these topics included aligning IT with corporate goals and objectives, while others focused on IT budgets, the governance of IT, managing risk, and spending for regulatory audit among others.
Taken separately, the research could take years to complete and not meet the needs of people being asked to make decisions for their organizations in the
near-term. As a result, the topics were incorporated into a series of benchmarks that hopefully honors the requests. Based on input from numerous contributors, the purpose of the research included: identifying the impact that economic conditions are having on IT budgets and outcomes, identifying successful strategies and tools for aligning and managing the value delivered by IT based on outcomes being achieved by organizations, and the strategies and tools being used to manage value, risk and compliance.
Some of the hypothesis prior to the research included:
Outcomes being experienced were independent of organization size
Outcomes depended on the use of specific management frameworks
Outcomes depended on specific tools to govern risk and compliance related to the use of IT
Some of the hypothesis is confirmed by the research findings, whereas others are
not. For example, more small businesses are experiencing worse outcomes than was the case two years ago. A major reason found for the change: larger cutbacks in spending on IT and audit among smaller firms. Confirmed in findings from 2009 through 2010, the trend toward worsening outcomes among small businesses accelerated in 2010 and is attributable to economic conditions.
The use of COBIT, IT Portfolio Management, IT Balanced Scorecards and IT Strategy Maps were found to be emerging management tools in 2005 and 2006, were more widely adopted by 2008, and by 2010 are the principle strategic tools being employed by the best-performing organizations to manage and govern value and risk related to the use of IT.
IT GRC applications and systems are the principle tools being used to manage value, risks and controls related to the use of IT. Their widespread adoption among those experiencing the best outcomes confirms earlier findings, including:
1) Use of applications, analytics, scorecards and collaboration systems for managing business value related to IT 2) Use of IT Balanced Scorecards, IT Portfolio Management IT Strategy Maps and COBIT to manage and govern
the value being delivered by IT
3) Use of IT GRC systems with ISO, COBIT and CIS benchmarks to preserve value, and manage risk and controls related to IT
The report that results from the research is a compendium of efforts, including primary and secondary research sources. Primary research sources includes quantitative benchmarks dating back to 2006 for spend data, data from ongoing benchmarks regarding management frameworks employed to manage value and risk related to the use of IT, and research conducted in 2010 covering the applications, systems and
information being used to preserve value, manage risk, controls and compliance related to the use of IT. Requested topics
Aligning IT with corporate goals and objectives
Delivery of value from the use of IT
Impact of the economy on IT spend
Enterprise GRC systems
Enterprise risk management
Governance of IT IT GRC systems IT risk management IT budgets Spending on information and IT security
Spending on regulatory audit
Tools for managing risk and audit
How information is being used to manage audits
Quality management and IT
IT Portfolio Management, IT Balanced Scorecards, IT Strategy Maps and COBIT are
now the principle strategic tools employed to manage value and risk related to the use of IT.
IT GRC applications and systems are the principle tools
being used to manage value, risks and controls related
to the use of IT.
The primary research also includes interviews conducted with members of the IT Policy Compliance Group and blind-interviews conducted from random samples. Secondary research includes information on GDP, corporate profits, and some of the related resources listed in the Appendix.
GDP Growth Rates and Corporate Profits
The business cycle of 2008 and 2009 resulted in negative changes in gross domestic product (GDP) in the United States (U.S.) and other parts of the World. Depending on the focus, the trough of the recession ranges from negative 0.5 to negative 7.5 percentage points in real GDP during the period. Since 2009, U.S. GDP climbed into positive single digits. Climbing along with GDP, average corporate profits for U.S.-based firms increased to more than 10 percent by 2010 (Figure 2).
Figure 2: Changes in U.S. GDP and Corporate Profit
2010 IMF GDP Projections - Australia: +3.0% - Canada: +3.1% - Belgium: +1.6% - Brazil: +7.5% - China: 10.5% - France: +1.6% - Germany +3.3% - Greece: -4.0% - India: +9.7% - Ireland: -0.3% - Italy: +1.0% - Japan: +2.8% - Malaysia: +6.7% - Mexico: +5.0% - Portugal: +1.1% - South Africa: +3.0% - Spain: -0.3% - Russia: +4.0% - Portugal: +1.1% - Suadi Arabia: +3.4% - Singapore: +1.1% - South Korea: +6.1% - United Arab Emirates: +2.4% - United Kingdom: +1.7% - United States: +2.6% - Venezuela: -1.3%
Sources: U.S Bureau of Economic Analysis (BEA) and the International Monetary Fund, 2010
However, conditions in the U.S. are not shared in other countries around the World and recent projections for 2010 changes in GDP from the International Monetary Fund (IMF) reveal the differences. Brazil, China, India and Malaysia exhibit robust growth rates, while recession continues to impact such countries as Greece, Ireland, Spain and Venezuela. Benchmarked Outcomes: Growth and Risk Metrics
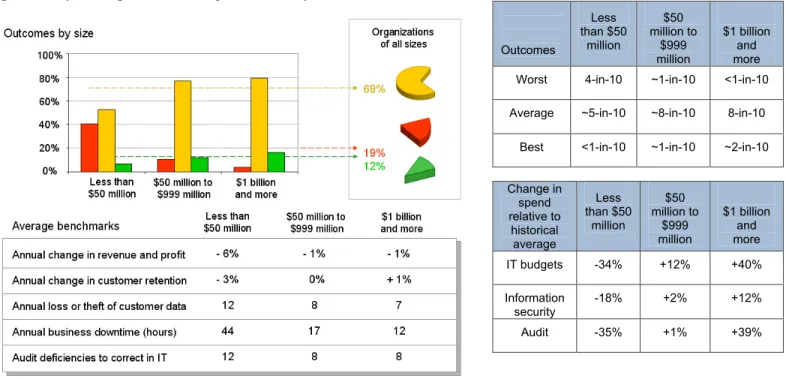
Aggregate revenue and profit growth during the past year, measured in on-going benchmarks of the ITPCG, closely follows the changes in GDP and appears as a traditional bell-curve, with a majority of firms operating in the middle or at the average and with two extremes on either side: one segment of the population doing very well, the other doing very poorly. Similar results are found with other outcomes, including: business downtime caused by failures or disruptions in IT, the loss or theft of sensitive data due to any cause, and the number of deficiencies that must be corrected in IT to pass audits among others.
Best outcomes
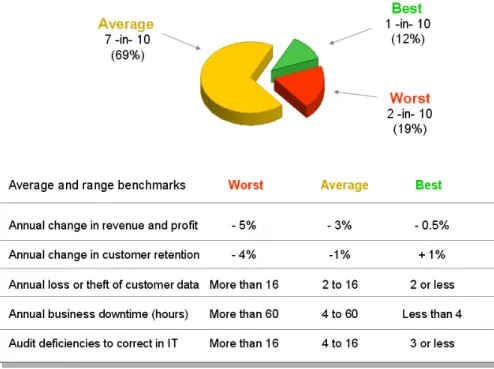
Slightly more than 1-in-10 (12 percent) organizations experience the best outcomes. These firms — small, midsize and large alike — share similar experience, including: the highest revenue, the largest profits and the highest levels of
customer retention. In addition, these organizations experience the lowest rate of loss or theft of customer data due to any cause, the least amount of business downtime due to failures or disruptions in IT, and the smallest number of deficiencies in IT that must be corrected to pass audits.
Average outcomes
Almost 7-in-10 (69 percent) organizations experience average outcomes. This majority shares similar operating outcomes, including: moderate levels of revenue and profit growth compared to the best performers and moderate levels of customer
retention. In addition, losses or thefts of customer data are higher among average performers when compared to the rates being experienced by the best performers, along with higher levels of business downtime from failures or disruptions in IT, and higher numbers of efficiencies in IT that must be corrected to pass audits.
Worst outcomes
Nearly 2-in-10 (19 percent) organizations are experiencing the worst outcomes that include much lower revenue, profit and customer retention rates. In addition, these firms are suffering from the highest rates of loss or theft of customer data, the highest levels of business downtime due to failures or disruptions in IT, and the largest numbers of deficiencies in IT that must be corrected to pass audits.
The distribution of outcomes from the most recent benchmark conducted in late 2010 mirrors results from prior benchmarks: 1-in-10 organizations are posting the best results, 7-in-10 operates at the average and 2-in-10 is experiencing the worst outcomes (Figure 3).
Figure 3: Benchmarked Outcomes: Growth and Risk Metrics
1-in-10 organizations post the best results, 7-in-10 operates
at the average and 2-in-10 experiences the worst results.
Source: IT Policy Compliance Group, 2010
However, the average changes in revenue, profit and customer retention during the past year actually mask the range of different outcomes being experienced by organizations.
Revenue, Profit, and Customer Retention
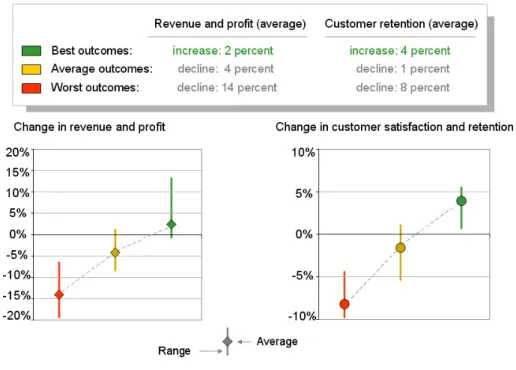
Average changes in corporate revenues, profit levels and customer retention rates in 2010 mask actual differences being experienced by any one sector or organization. For example, changes in revenue from 2009 among organizations in the U.S. range from negative 20 percent to positive 14 percent, while corporate profit rates demonstrate similar swings. Customer satisfaction and retention rates for 2010 for corporations in the U.S. demonstrate similar swings from 2009, ranging from lows of negative 12 percent to positive six percent.
Best outcomes
Organizations experiencing the best outcomes are experiencing changes in revenue and profits that range from negative one percent to positive 14 percent. The average among these firms is positive two percent when compared with conditions in late 2009. Customer satisfaction and retention rates among these organizations range from one percent to six percent over the same time period from late 2009 to the end of 2010.
Average outcomes
Firms operating at the average in the U.S. during 2010 experienced revenue and profit levels that ranged from negative eight percent to positive one percent, when compared with results posted in late 2009. Customer satisfaction and retention levels among these firms ranged from negative six to positive two percent when compared to the end of 2009.
Worst outcomes
Among firms experiencing the worst outcomes, revenue and profit levels ranged from negative 20 percent to negative six percent. These same organizations experienced customer satisfaction and retention levels ranging from negative 10 percent to negative four percent when compared with rates in late 2009 (Figure 4).
Figure 4: Changes in Revenue, Profit and Customer Retention
According to the BEA, 30 percent of corporate profits in the 2009 to
2010 period occurred in the financial sector, while the remaining 70 percent of profits
were spread across all non-financial industry sectors.
Source: IT Policy Compliance Group, 2010
In addition, outcomes during the past year varied considerably by sector of the economy. According to the BEA,
30 percent of all corporate profits in the 2009 to 2010 period occurred in the financial services sector, while the remaining 70 percent of profits were spread across all non-financial industry sectors. Changes in tax policies, markets, credit, consumer behavior, inventory-levels, employment levels, commercial spending, debt-levels and currency exchange rates all influenced corporate profits, and receipts that account for gross domestic product.
In addition, evidence from the benchmarks reveals a direct-linkage between the outcomes being experienced by organizations, and the changes that occurred in spending for IT and audit among firms.
Impact of Revenue and Profits on IT Spend
Spending on IT budgets could be expected to decline in response to slowdowns in revenues and profits occurring in 2008 and 2009. However, there appears to be about a one-year delay with the largest declines in IT budgets being dragged into 2010, primarily among the organizations posting the worst outcomes. Similarly, spending for information security shows a steep decline in 2010 among those experiencing the worst outcomes. However, spending for audit increased in 2009 among the best performers and again in 2010 for all organizations.
Best outcomes
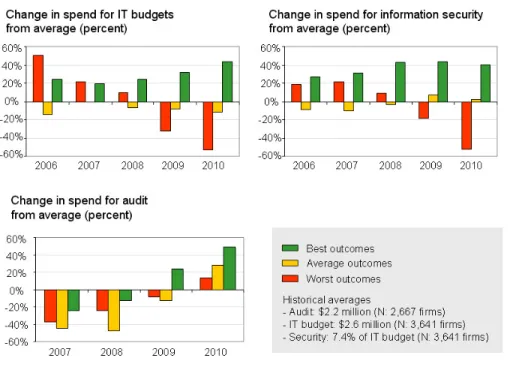
Among organizations with the highest revenue and profits, spend on IT budgets in 2010 was 44 percent higher than historical average spend-levels. Moreover, spending on IT among these organizations is consistently higher than the average spend-level: 24 percent higher in 2006, 20 percent in 2007, 24 percent in 2008 and 31 percent more in 2009. These same firms also spend more for information security above the historical average: by 27 percent, 31 percent, 43 percent, 43 percent and 40 percent for the period from 2006 through 2010. Spend on audit among these firms climbed higher in 2009, and 49 percent higher in 2010. The findings reveal an important point: spending on IT, information security and audit are directly linked to outcomes.
Average outcomes
Firms operating at the average kept spending for IT budgets close to historical averages for the period 2006 through 2010. Only in 2010 did these firms cut-back spending for IT budgets by 12 percent when compared with the historical average.
Spending on information security among these organizations hovered around the historical average, with no large deviation between 2006 and 2008, and with increases from 2009 through 2010. However, spending on audit, which was substantially lower than the average during 2007 and 2008, increased dramatically by 2010 to 24 percent higher than the historical average.
Worst outcomes
In contrast to all others, the firms experiencing the worst outcomes have consistently and substantially reduced spending on IT budgets, moving from 50 percent higher than the average in 2006 to 44 percent lower in 2010. Similarly, spending on information security has declined among these organizations, from 20 percent higher than the average in 2006 and 2007, to 53 percent lower than the average in 2010. However, the pattern in spend for audit among these organizations appears closer to other organizations with increases that reach 14 percent higher than the average in 2010 (Figure 5). Figure 5: Changes in Spending on IT Budgets, Information Security and Audit
As the findings reveal, there is a direct relationship between value
and risk outcomes that are experienced, and spend for IT and
information security.
Source: IT Policy Compliance Group, 2010
As the findings reveal, outcomes — better and worse — are directly linked to spending for IT budgets and information security. The average-spend levels from 2006 through 2010 belie a critical fact: larger organizations spend more money on IT budgets, information security and audit than do small businesses, and some industries spend more than other sectors for these expenditures. Despite the differences, the findings are consistent with the outcomes being experienced by organizations from small to very large: increased spend on these is directly linked to better outcomes. The best performing organizations consistently continue to spend more on IT, information security and audit than all other organizations, even in down years such as 2009 when revenue and profits were leaner.
As the findings reveal, there is a direct relationship between value and risk outcomes that are experienced, and spend for IT and information security.
Business Risk related to the use of IT
Organizations that spend more on IT and information security experience higher revenue and profit, and lower business risks related to the use of IT, while those spending less experience lower revenue and profit and the highest business risks. Beyond the average rates, ranges of outcomes are occurring among organizations for several business risk-metrics, including: the amount of business downtime due to failures or disruptions within IT; the number times customer data has been lost, misplaced or stolen due to any cause; and the number of deficiencies that must be corrected in IT to pass regulatory audits.
Best outcomes
The range of lost business time among the best performers amounts to single-digit hours annually, with almost all of these firms experiencing less than four hours of downtime. Similarly, the number of audit deficiencies to correct for audit is in the single-digits among these organizations. Lastly, the number of times customer data is lost, misplaced or stolen is
Average outcomes
Unlike the small ranges being experienced by the best performers, the firms operating at the average are experiencing between one and more days of business downtime, between 6-and-12 audit deficiencies to correct, and between 4-and-8 events involving the loss, misplacement or theft of customer data.
Worst outcomes
Organizations with the worst outcomes are experiencing a larger range of elevated business risks that include: multiple days to weeks of business downtime, 12-to-26 audit deficiencies to correct, and between 12 and 27 events involving lost, misplaced or stolen customer data (Figure 6).
Figure 6: Business Downtime, Audit and Data-loss or Theft
Spending less on IT, information security and audit is directly related
to more business downtime, more customer data loss or theft, and
more audit problems.
Source: IT Policy Compliance Group, 2010
Evidence from the benchmarks shows quite a diverse range of outcomes, while also confirming that reducing or spending less on IT, information security and audit is directly related to more business downtime, more customer data loss or theft, and more audit problems. Although the findings reveal the direct relationship between spend and the outcomes that are experienced for business risks, it does not shed insight into the differences in outcomes by size of organization and spending reductions that might be related to the outcomes being experienced by organizations.
Outcomes by Size and IT spend
Overall, smaller organizations are experiencing worse outcomes than all other organizations, while larger organizations are experiencing better outcomes than industry-wide results. Moreover, when the changes in spend for IT, information security and audit are examined, the findings confirm that spend for IT, information security and audit is one of the determining factors for the likelihood of elevated business risk related to the use of IT.
Large enterprises: more than $1 billion in annual revenue
More large enterprises (almost 17 percent) experience better results than the industry-wide 12 percent benchmark. On the opposite-end of the spectrum, fewer (4 percent) large enterprises experience worst outcomes than the
industry-wide 19 percent benchmark. However, more (79 percent) large enterprises are experiencing average outcomes when compared with the industry-wide 69 percent benchmark.
The relationships between more large firms posting better results and spend are clear: large enterprises ratcheted-up their spend on IT budgets by 40 percent over the historical average during 2010, increased spend on information security by 12 percent, and increased spend on audits by 39 percent over the historical averages during the same period.
Mid-sized companies: $50 million to $999 million in annual revenue
Mid-sized organizations are experiencing results closer to industry-wide average benchmarks which conforms with the same number of mid-size organizations (12 percent) posting the best outcomes compared with 12 percent benchmark. On the opposite-side of the ledger, fewer mid-size firms (11 percent) are experiencing worst outcomes when compared with the industry-wide benchmark of 19 percent. However, more mid-sized firms (77 percent) are experiencing average outcomes when compared with the industry-wide benchmark of 69 percent.
The relationships between average results being posted by mid-size firms and spend are obvious: spend on IT increased by 12 percent in 2010, increased spend on information security by just two percent, and increased spend on audit by just one percent in 2010 over the historical averages.
Small businesses: Less than $50 million in annual revenue
Fewer small businesses (7 percent) are posting the best outcomes when compared with the industry-wide benchmark of 12 percent. On the opposite-side of the outcome-ledger, many more small businesses are experiencing the worst outcomes (41 percent) compared with the industry-wide result of 19 percent. Far fewer small businesses (52 percent) are posting average outcomes when compared with the industry-wide result of 69 percent.
The direct relationship between more small businesses posting worse results and spend are obvious: the average
reduction in IT spend over historical averages was 34 percent during 2010 among these firms, accompanied by 18 percent lower spending on information security. Spending on audit registered 35 percent lower among small businesses in 2010 compared with the historical average (Figure 7).
Figure 7: Operating Outcomes by Size and Spend
Outcomes Less than $50 million $50 million to $999 million $1 billion and more Worst 4-in-10 ~1-in-10 <1-in-10 Average ~5-in-10 ~8-in-10 8-in-10
Best <1-in-10 ~1-in-10 ~2-in-10 Change in spend relative to historical average Less than $50 million $50 million to $999 million $1 billion and more IT budgets -34% +12% +40% Information security -18% +2% +12% Audit -35% +1% +39%
Source: IT Policy Compliance Group, 2010
The findings reveal that more small businesses are having difficulty with revenue and profit growth while also suffering more business downtime, problems with audit, and data-loss or theft. And, these small businesses are the ones reducing spend for IT, information security and audit the most in response to reduced receipts and profits.
In contrast, larger enterprises are posting much better revenue and profit growth, higher customer retention, and fewer problems with business downtime, audit, and the loss or theft of data. Most have increased spending on IT budgets, information security and audit despite thinner profits in 2009 and more robust profit in 2010.
Aside from obvious capital constraints, additional reasons for the differences in the outcomes being experienced by organizations might include: 1) greater or lesser reliance
on IT as a strategic asset within a firm or an industry, 2) differences in leadership skills within an organization,
3) the relative maturity of IT management skills and procedures within a firm, 4) better or worse understanding of the value delivered by IT for the business, and 5) better or worse understanding of business risks related to the use of IT.
Best performing organizations of all sizes are managing value, risk and compliance for IT very
differently than all other organizations.
All of these factors, in addition to differences in capital constraints could be reasons for the different reactions — and resulting outcomes being experienced — by firms. However, the near universal increase in spend on IT budgets,
information security and audit — especially after 2008 and 2009 — indicates that the masters of IT at the best performing organizations — of all sizes — are managing IT very differently than all others.
Who Manages Value, Risk and Compliance for IT
According to the common theories of IT value management and governance, the board of directors should be involved in managing significant investments related to IT: and for some of the most significant investments at some organizations this occurs. However, the research reveals it is not the board, but a number of different senior leaders and managers in organizations that are tasked with the responsibility of managing value, risk and compliance related to the use of IT.
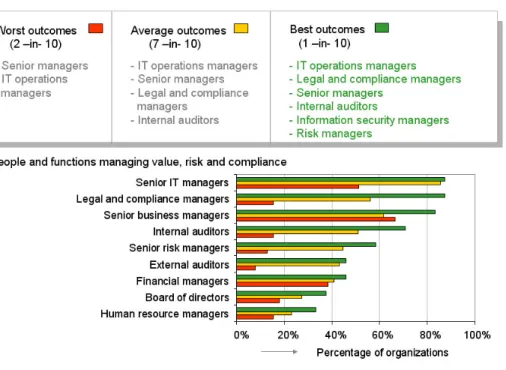
Best outcomes
The most recent benchmarks reveal the best outcomes are being achieved by organizations involving the following people and functions to achieve value while managing risks related to the use of IT: 1) senior IT managers, 2) legal and compliance managers, 3) senior business managers, including business unit or operating line managers, 4) internal auditors, and 5) senior risk managers.
The masters of IT at the best performing organizations — of all
sizes — are managing IT very differently than all others.
Average outcomes
Average performing organizations leave the management of value and risk to senior IT managers with some assistance from senior business managers, internal audit, legal and compliance managers. However, the numbers indicate less engagement and contributions from parts of the organization outside of IT when compared with the best performers.
Worst outcomes
In contrast, worst performing organizations rely first on senior business managers and secondly on senior IT managers, indicating a reversal of roles for who manages value, risk and compliance compared with all other organizations. Almost missing among the worst performers are internal auditors, risk managers, and legal and compliance managers: a clear reflection that value and risk are either not as valued, documented or communicated at these firms.
One of the stark findings from the research is the relative lack of involvement by members of the board. Although
involvement of the board of directors aligns by outcomes, boards of directors account for less than 4-in-10 among the best performers and less than 2-in-10 of the worst performers. When it comes to the governance of value, risk and compliance related to the use of IT, it is being managed by senior managers of the best performing organizations (Figure 8).
Figure 8: Functions and People Managing Value and Risk related to IT
It is not the board, but a number of different senior leaders and managers that are tasked with
managing value, risk and compliance related to the use of IT.
Source: IT Policy Compliance Group, 2010
In addition to who’s involved in managing the delivery of value from IT, the focus for how information is evaluated to manage value, risk and compliance from the use of IT differs by the outcomes organizations experience.
Focus of Evaluation and the IT Portfolio
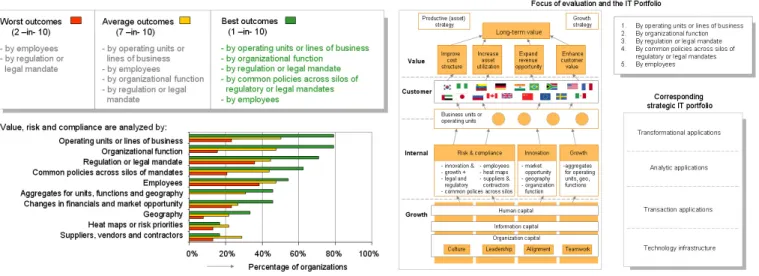
Successful organizations evaluate value and risk by business or operating units, and then by functional parts of the organization (finance, procurement, sales, et cetera). After these two the next level of focus consists of regulatory or legal mandates, and then by common policies across the silos of regulatory mandates, and finally by employees (Figure 9). Figure 9: Focus of Evaluation and the IT Portfolio
Source: IT Policy Compliance Group, 2010
Best outcomes
Among the best performers the dominant focus of evaluation of value, management of assets, risks and compliance involves: 1) by business units and operating lines, and 2) by organizational functions. Nearly 8-in-10 of the best performing organizations continually evaluates value and risk based on these two views of its operations. Three other views of value, risk and compliance dominate among the best performers, including by regulatory and legal mandate, by common policies across silos of regulatory or legal mandates, and by employees.
Successful organizations evaluate value and risk by business or operating unit, functional parts of the
organization, then by regulatory mandates and common policies
across the silos.
Average outcomes
In contrast, the primary focus of evaluation, utilized by almost half of the firms operating at the average, is by business units and operating lines. All other views of value and risk are less likely to be occurring among average performing
organizations.
Worst outcomes
The primary focus for determining value, risk and compliance among worst performers is based on employees, where almost 4-in-10 of these firms tends to focus. Missing the critical view that touches customers through business lines or operations, and nothing overtly linking the use of IT to the value delivered by the organization means investments in IT depend more on personalities: not customers, business operations or objective metrics.
Tools for Managing Value and Risk: Collaboration, Dashboards, Scorecards and Reporting
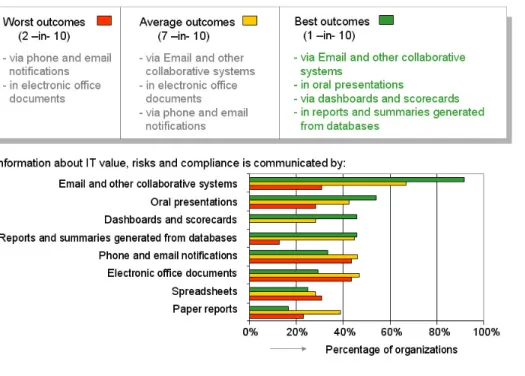
The methods employed to communicate and share information about value, risk, and compliance related to the use of IT are dominated by Email and collaborative systems among the best performers. On the opposite-side of the spectrum, organizations with the worst outcomes are using electronic office documents and then Email and phone for notifications. The evidence suggests best performers proactively communicate value and risk to constituents, whereas worst performers may be shaping the value of IT by focusing on just the bad news.
Best outcomes
The dominant methods and procedures for sharing information about value, risks and compliance related to the use of IT among the best performers include: 1) Email and a wide variety of collaborative systems, 2) oral presentations,
3) dashboards and scorecards, and 4) reports and summaries generated from databases. Of these, the most dominant method employed among these organizations is the combination of Email and collaborative systems. Interviews
conducted with some of the participants reveal a wide variety of collaboration systems are employed, including: Internally deployed Wiki’s, project management and help desk ticket resolution systems, instant messaging, groupware applications for Email systems, and a wide variety of traditional collaboration systems and applications (Figure 10).
Figure 10: Communicating IT Value, Risk and Compliance
The evidence suggests best performers proactively communicate value and risk to
constituents, whereas worst performers may be shaping the
value of IT by focusing on just the bad news.
Source: IT Policy Compliance Group, 2010
Average outcomes
Organizations experiencing average outcomes are also relying on Email and collaborative systems to share information, but at slightly lower rates to communicate the value being delivered by IT, the risks, and compliance status. After the use of Email and collaborative systems, these organizations rely on electronic office documents and phone or Email
notifications.
Worst outcomes
In contrast, the dominant methods employed to communicate information about value and risk consists of electronic office documents, and Email and phone for notification purposes.
Proven Management Tools for Delivering Value from IT
There are five key management tools are being used by the organizations with the best track-records higher revenue, profit and customer retention-levels, and lower business risks from downtime, data-loss or problems with audit.
Best outcomes
The dominant management and best-practices tools employed by the masters of IT include ISO 27001 (and ISO 27002), CIS benchmarks, COBIT, IT Portfolio Management and Balanced Scorecards. While the business-side of Balanced Scorecards is well understood, the use of COBIT, IT Balanced Scorecards and Strategic IT Portfolios that cascade to business Balanced Scorecards are some of the striking differences in how IT is aligned and managed to produce desired outcomes among the best performing organizations. The leading tools used to manage business risk and compliance directly related to the use of IT includes: ISO 27001, the CIS benchmarks and COBIT.
The dominant management and best-practices tools employed by the masters of IT
include: ISO 27001, CIS benchmarks, COBIT, IT Portfolio Management and
Balanced Scorecards.
Average outcomes
In contrast, the dominant approach to deliver more value and reduce risk from IT among average performers is based on the use of SDLC (Systems Development Lifecycle) and combinations of ITIL (IT Infrastructure Library, which is most often used for managing service-levels) and ISO 27001/2. Relying on a systems lifecycle approach accompanied by customer (most often measured as internal customers, not real customers) services delivery and security best-practices methods is most common among average performing organizations. What is missing for most of the average performing
Worst outcomes
In stark contrast, no consensus management or best-practice tools are employed among the firms experiencing the worst outcomes: the lowest revenue growth, lowest profit growth, and highest business risks associated with the use of IT. The closest framework that falls short of a majority involves 2-in-10 of these organizations using ISO 27001 and SDLC to manage value and risk for IT (Figure 11).
Figure 11: Tools used to Manage Value, Risk and Compliance for IT
The use of COBIT, IT Balanced Scorecards and IT Portfolio Management that cascades into business Balanced Scorecards are
some of the striking differences in how IT is aligned and managed to produce desired outcomes by the
masters of IT at the best-performing organizations.
Source: IT Policy Compliance Group, 2010 Balanced Scorecards, IT Portfolio Management and COBIT
Robert Kaplan and David Norton first published the idea of the balanced scorecard (BSC) in 1992 as a tool to measure the performance of organizations. Arguing that 75 percent of the value created by organizations arises from intangible assets, not from fixed assets, the use of Balanced Scorecards for business strategy and operations has become widely adopted. Less widely adopted has been the use of IT Portfolio Management, IT Strategy Maps and IT Balanced Scorecards. Strategic IT Portfolio Management ranks priorities for IT based on business requirements, while IT Balanced Scorecards create the alignment and linkage between business and IT for more efficient asset allocation and growth strategies. The use of COBIT, IT Balanced Scorecards and IT Portfolio Management that cascades into business Balanced Scorecards are some of the striking differences in how IT is aligned and managed to produce desired outcomes among by the masters of IT at the best performing organizations. Firms using these management tools find it easier to update the alignment between business and IT, and find it easier to communicate value and risk. Where used, IT Balanced Scorecards, IT Strategy Maps and Strategic IT Portfolios leave no doubt about alignment of value between business units and IT. In the mid-2000s, leaders in business, education, IT, management consulting, the IT Governance Institute and ISACA cooperated in developing real-world approaches to managing value and risk related to the use of IT. The efforts resulted in several management tools that are available from ISACA and the IT Governance Institute, including:
ValIT: management of investment value for IT
RiskIT: management of risk related to the use of IT
COBIT: IT governance and controls
ITAF: Assurance
The management tools from ISACA and the IT Governance Institute deliver tested road-maps for managing value and risk for IT that are used to guide teams to achieve objectives established from IT Balanced Scorecards, IT Strategy Maps and IT Portfolio Management. Based on improvements incorporated from real-world use, these ISACA tools are
complementary to the more strategic management IT Portfolio Management and IT Balanced Scorecard tools (Figure 12). Figure 12: Balanced Scorecards. IT Portfolio Management and COBIT
Where used, IT balanced scorecards, IT strategy maps and
strategic IT portfolios leave no doubt about alignment and value
between business units and IT.
Source: IT Policy Compliance Group, 2010
For example, the COBIT management tools complement the strategic tools by including: The COBIT management tools go beyond strategic alignment by
including delivery of value, management of risk, measurement
and assessment of performance.
Strategic alignment
Delivery of value
Management of value
Management of risk
Measurement and assessment of performance
In its simplest interpretation, the combination of ValIT and COBIT management tools provide procedures to assist in defining linked strategies between business and IT, the creation and preservation of value delivered by IT, the frameworks for resolving problems, measurements and assessments, and continuous
improvement. What they do not do is help fill in the content of IT Strategy Maps, Strategic IT Portfolios and IT Balanced Scorecards: tasks that can be assisted with tools but which depend more on management skill and experience. ISACA plans to release these currently separate tools in an easier-to-digest integrated COBIT 5 sometime during 2011.
ISACA is planning to release these currently separate tools
in an integrated COBIT 5 for release sometime in 2011.
Corporate Governance and IT Governance: Similar and Different
Governance, risk and compliance (GRC) focuses on the governance of IT. The “G and R” parts of GRC focus on: 1) ensuring investments in IT return business value, and 2) mitigating business risks associated with IT. The “C” part of GRC deals with such regulatory mandates as Sarbanes Oxley, the European Data Privacy Act, privacy laws, PCI, and numerous industry-specific regulations impacting information and IT. GRC is often dismissed as simply “good
management practices” but without any identification of what constitutes “good” management practices and with no direction or guidelines on how to achieve “good.”
Corporate and IT Governance: Similar Objectives, Different Tools
Corporate governance is measured by financial results, using financial analytics, business intelligence, scoreboards, dashboards, data warehouses, data mining, collaboration and knowledge management tools that assist organizations with achieving quarterly performance targets. In contrast, IT governance is about strategic alignment to support and drive business results, deliver value through the use of the IT portfolio, manage corporate costs through the use of the IT portfolio, manage risks associated with the use of IT, and continuously improve results. The research findings reveal the management tools employed to deliver the “governance” part of IT governance is being accomplished with the use of COBIT, IT Balanced Scorecards, IT Portfolio Management and IT Strategy Maps. Corporate governance and IT governance have the same objectives, but each employs different tools (Figure 13).
Figure 13: Corporate and IT Governance
Corporate governance and IT governance have the same objectives, but each employs
different tools.
Source: IT Policy Compliance Group, 2010
Risk, Controls and Compliance
The RC part of GRC (risk, controls and compliance) is a relatively new discipline for many organizations. Involving information, applications and systems that are used to manage productive assets and growth, the RC parts of GRC also involve controls for delivering value, managing risk and sustaining audit results. The dominant management tools being used to assist the RC parts of GRC include ISO 27001/2, the CIS benchmarks and COBIT. As management tools, both ISO 27001 and COBIT define best-practice procedures to accomplish objectives.
The CIS benchmarks complement and fill-in technology controls that are absent from ISO and COBIT. These are used to manage technical control rules, settings and values related to the hardening of IT
networks, systems, devices, middleware and software applications, as well as
benchmark audit tools for technical systems audits. The CIS benchmarks are the most common tools employed to attain and sustain compliance with ISO 27002, GLBA, Sarbanes Oxley, and HIPAA among other compliance and regulatory requirements and audits among the best performing organizations.
ISO and COBIT contain procedures that define best-practices to accomplish objectives. The CIS benchmarks
complement and fill-in the technology controls missing from
ISO and COBIT. GRC for IT spans a large range: from strategic alignment and value delivery at the most
senior levels of organizations; to best practices and detailed technical rules and controls for IT operations and information security.
GRC for IT, like its corporate governance cousin, shares the COBIT management tools that are linked to Balanced Scorecards and IT Portfolio Management, are also linked to procedural and technical controls to ensure effective management of value and risk. The findings also reveal the masters of IT at the best performing organizations — those with the highest revenue, profit customer retention and lowest business risks related to the use of IT — are using the management and technical tools with very specific applications and systems to implement and manage GRC for IT.
Proven GRC Tools for IT
The dominant applications and systems being used to manage GRC for IT among organizations are what have come to be called IT GRC. After IT GRC applications and systems the dominant systems among the best performers include security incident and event management (SIEM) and individual security applications, systems or controls for IT assets.
Best outcomes
The dominant applications and systems employed to manage GRC in IT among the best performers include: 1) IT GRC systems and applications, 2) SIEM systems and applications, 3) individual information security controls, applications and systems for IT assets, 4) home-grown applications, and 5) systems that consolidate log-file information. More than 7-in-10 of the best-performing organizations relies on IT GRC applications and systems. After IT GRC, 6-in-10 use security incident and event management (SIEM) systems. Almost 6-in-10 best performers use individual information security controls for IT assets to manage risk and compliance and about 5-in-10 of the best performers are employing home-grown custom applications (Figure 14).
Figure 14: Proven Governance Tools for IT
The best-performing organizations rely on IT GRC
applications and systems.
Source: IT Policy Compliance Group, 2010
Interviews reveal that three of these systems are being used concurrently, and that many cite IT GRC applications and systems as the primary management tool for GRC within their organization. Some of the of reasons mentioned include: embedded applications for measuring value and controls via COBIT checks, applications for assessing configurations against CIS benchmarks, assessments against ISO procedures, assessments against a wide-range of regulatory requirements, along with Email, workflows, dashboards, collaboration applications and a wide-range of attestation and evidence gathering capabilities that range from policies through remediation.
Average outcomes
IT GRC systems and applications lead the list of the systems employed by those experiencing average outcomes, but the use-rate is lower and the IT GRC systems and applications are not the same, nor are as integrated as those being employed by the masters of IT at the best performing organizations. After IT GRC systems, the primary applications employed by average performing organizations consist of electronic office documents and spreadsheet applications, and Email and other collaborative applications by 5-in-10 of these firms.
Worst outcomes
In stark contrast, the primary applications employed by firms with the worst outcomes are electronic office documents and spreadsheet applications. The closest other application among these firms is Email and other collaborative applications.
E GRC: Betwixt and Between IT GRC and ERM
A change in ratings from the major credit rating agencies to include enterprise-wide approaches to managing risk has led to efforts to demonstrate enterprise risk management. Organizations are meeting objectives of the credit rating agencies with a range of solutions, including the use of reinsurance policies, consulting services,
spreadsheets, business analytics, and at some organizations the use software to aggregate information for ERM (Enterprise Risk Management).The focus of ERM is much broader than just IT: it evaluates controls for many business risk that includes: 1) strategic risks related to markets, M&A, resource allocation and investor relations; 2) financial risks such as liquidity and credit, market, capital structure, tax, accounting and financial reporting; and 3) compliance risk such as governance, legal and
regulatory; and operations risk such as assets, supply-chains, people, IT and hazards among others.
The best performers say their early forays with E GRC systems resulted in higher than
expected costs, less-than-desired results, and the need to augment or replace E GRC with IT GRC systems to address specific requirements in IT.
The best performers say their early forays with E GRC systems resulted in higher
than expected costs, less-than-desired results, and the need to augment or replace
E GRC with IT GRC systems to address specific requirements in IT.
Largest Business Risks related to use of IT
The largest business risks related to the use of IT among the masters of IT include: 1) the loss or theft of sensitive information, 2) Internet security threats and events, 3) business disruptions occurring due to operational failures or disruptions in IT, 4) the preservation of revenue, profit and customers, and 5) outsourced applications and information. By comparison, the majority of average performing organizations view the primary business risks to be Internet security threats and the loss or theft of sensitive information. Far fewer of these firms are concerned about business disruptions, outsourced applications and information, or the impact that IT has on revenue, profit or customer retention.
Perhaps another reason why the worst 2-in-10 organizations are experiencing laggard outcomes is that few of these firms recognize the tacit connection between IT and business risk. Among the worst performers, the primary business risk is seen to be Internet security threats and events (Figure 15).
Figure 15: Largest Business Risks related to the use of IT
IT GRC systems are being used to manage and control the largest
business risks related to the use of IT, including the preservation of
revenue, profit, customers; and the mitigation of customer data loss, business downtime, Internet
security threats, outsourced applications and information.
Source: IT Policy Compliance Group, 2010
It is not a surprise then that IT GRC systems and applications are the dominant GRC tool of choice. IT GRC systems are being used to manage and control the largest business risks related to the use of IT, including the preservation of revenue, profit, customers; and the mitigation of customer data loss, business downtime, Internet security threats, outsourced applications and information.
Assessing the and managing the business risks
Managing business risk starts with assessments, whether these are formal financial audits conducted by external teams or routine audits conducted by internal audit. Similarly, business risks related to the use of IT starts with assessments, with similar and different areas of focus. The similar focus is business operating units, organizational functions, regulatory audits, and employees. What differs between financial audits and IT audits is the type of controls that are being assessed. For more in-depth coverage of information-risk and risk priorities being applied to the IT portfolio, see “What Color is Your Information Risk – Today”
The best performing organizations are laser-focused on using IT GRC
systems to gather relevant information, timely enough, to
effectively manage business risk. Gathering information from different sources to evaluate business risks related to the
use of IT is an activity that differentiates the best performing masters of IT from all other organizations. Simply put, the best performers are laser-focused on using IT GRC systems to gather relevant information, timely enough, to effectively manage business risk.
Sources of Information for Risk and Compliance
The source of information for assessing and then managing business risk related to the use of IT is based on the interaction of people, business procedures, information, applications and IT systems, with a heavy-emphasis on IT systems and information security controls.
Best outcomes
The dominant sources of information used for evaluating risk and compliance among the best performers include: IT network systems, IT security incident reports, Email and Web systems and PCs and laptops. After these, the dominant sources of information include PCs and laptops, IT systems and servers, databases, and IT security controls (Figure 16). Figure 16: Sources of Information
The source of information for assessing and then managing business risk related to the use of IT is based on the interaction of people, business procedures,
information, applications and IT systems, with a heavy-emphasis
on IT systems and information security controls.
Source: IT Policy Compliance Group, 2010
Average outcomes
The primary information sources for evaluating risk and compliance by average performers consist of IT systems and servers, IT security controls, employees and IT network systems. The use of IT security incident reports, Email and Web systems, PCs and laptops, databases, and IT disruption reports are not as commonly employed among these
organizations.
Worst outcomes
The dominant source of information among the worst performing organizations consists of data gathered from PCs and laptops. However, this source account for less than 4-in-10 of these firms. The findings indicate worst performing organizations may either be under-instrumented, or lacks the tools to collect information from existing IT controls and systems in the environment.
Impact of Automated Information Gathering and Reporting
More automation to gather, assess and report on business risks results in better outcomes, while less automation results in worse outcomes. The level of automation that can be achieved is the result of choices that organizations make about the applications and systems used to manage GRC for IT: automated IT GRC systems versus the use of spreadsheets, office applications or paper.
Best outcomes
Among the organizations with the highest most revenue, profits and customer retention, and the lowest business risks and fewest problems with regulatory audit, the automation of the procedures to gather information and then produce reports on value, risk and compliance related to the use of IT averages 81 percent.
Average outcomes
Among those experiencing average revenue, profits, customer retention, business risks
and problems with regulatory audit, the automation of the procedures to gather information and then produce reports on value, risk and compliance related to the use of IT averages 44 percent.
More automation to gather, assess and report on business risks results in better outcomes, while less automation results in worse
outcomes.
Worst outcomes
Among those experiencing the worst track-records for revenue, profits, customer retention, the highest business risks and most problems with regulatory audit, the automation of procedures to gather information and produce reports on value, risk and compliance related to the use of IT averages 12 percent (Figure 17).
Figure 17: Automation of Procedures and Outcomes
Paper, electronic office documents and spreadsheets do not deliver
the automation that is delivered by the applications
and relational databases of IT GRC systems employed
by the masters of IT.
Source: IT Policy Compliance Group, 2010
The choice of applications and systems used to manage GRC determines the level of automation that can be achieved: paper, electronic office documents and spreadsheets do not deliver the automation that is delivered by the applications and relational databases of IT GRC systems employed by the masters of IT.
Timeliness of Assessments and GRC Tools
The research findings reveal that more frequent assessments of value, risk and compliance are directly related to better outcomes. Often termed continuous assessment by the auditing profession, the worst performers using spreadsheets, office applications and paper are assess business value and risk about once every nine months, whereas the best performers maintain weekly and bi-monthly cadences. The choice of tools for managing GRC for IT reveals significant differences that assessment frequency has on business value and risk being delivered by IT.
Best outcomes
Those with the highest revenue, profits, customer retention, and the lowest business risks and fewest problems with regulatory audit, assess and report on business risks related to the use of IT daily, weekly and bi-monthly. Among these organizations, assessment and reporting on the effectiveness of controls related to the use of IT occurs once every two weeks.
Average outcomes
Among those experiencing average results for revenue, profits, customer retention, business risks and problems with regulatory audit, business risks are assessed and reported once every quarter or less frequently. The frequency of assessment and reporting on the effectiveness of controls for IT takes place once per quarter or less frequently among these firms.
Worst outcomes
Among those with the lowest revenue, profits and customer retention, and the highest business risks and problems with regulatory audit, assessment and reporting on business risks related to the use of IT takes place once every nine months. Similarly, assessment and reporting about the effectiveness of controls for IT occurs once every nine months (Figure 18). Figure 18: Frequency of Assessments and Outcomes
The choice of tools for managing GRC for IT reveals significant
differences that assessment frequency has on business value
and risk being delivered by IT.
Source: IT Policy Compliance Group, 2010
The choice of applications and systems being used to manage value, risk and compliance related to the use of IT influences the ability to assess value, risk and controls. Electronic office documents and spreadsheets do not scale nor lend themselves to frequent assessment as do the applications and relational databases that are at the center of some IT GRC applications systems.
Systems of Record for Assessment Findings
Experience and outcomes also reveal the differences in the choices being made by organizations about where to store information that is collected from assessments to preserve value, manage risks, controls and regulatory audit. The best performers keep the systems of record for risks, controls and audit in two specific locations: information security controls on IT assets and the relational databases of IT GRC systems. By comparison the worst performers are storing
assessment information on paper, in spreadsheets and in electronic office documents.
Best outcomes
Organizations experiencing the best outcomes store information that is collected from assessments about risk, controls and compliance with regulation in two primary locations: within information security controls that are implemented for IT assets, and in the relational databases of IT GRC systems.
Average outcomes
In contrast, organizations experiencing average outcomes are relying on directories (Active Directory, LDAP and other directories), spreadsheets, electronic office documents, Email and other collaborative systems to store assessment findings. Although some of these participants are also using relational databases and IT GRC systems, the use of relational databases and local security controls is less common than found among the best performers.
Worst outcomes
In contrast, the primary source of record for assessment information on risks, controls and compliance among the worst performers is paper. The use of paper is followed by spreadsheets and electronic office documents as the systems of record among these organizations (Figure 19).
Figure 19: Where Assessment Information is Stored
The best performers store assessment findings in two specific
locations: information security controls for IT assets and relational
databases. The worst performers use paper, spreadsheets and
electronic office documents.
Source: IT Policy Compliance Group, 2010
The system of record for information collected from assessments about risks, controls and compliance strongly influences outcomes. The findings reinforce the choices made by the best performers to preserve value and manage risk related to the use of IT.
Systems of Record for Policies Governing the use of IT
Policies governing the use of IT range from human-readable management policies to hard-coded machine policies that are implemented in software and firmware on IT systems such as firewall rule-sets, SIEM systems, and in the CIS
benchmarks among others. Augmenting human- and machine- readable policies are best-practice procedures that include ISO and COBIT, and policies dictated regulatory mandates, legal interpretations and audits. Where these policies are stored in systems of records is directly related to the outcomes being experienced by organizations.
Best outcomes
Those with the best outcomes store policies governing the use of IT assets in three primary locations: 1) in IT assets, 2) in directories (Active Directory, LDAP, et cetera), and 3) in relational databases. After these three, Email and collaborative systems are also used to store policies governing the use of IT assets. Interviews reveal that Email and collaborative systems are employed to define and update human-readable policies, while it is relational databases, directories and IT assets that hold policies of record among the best performers.
Average outcomes
In contrast, average performing organizations are using electronic office documents or Email and collaborative systems as containers for human readable policies accompanied by machine-operable controls located in security controls for IT assets. Interviews reveal the systems of record among these organizations are the human-readable policies in electronic documents and the controls for IT assets.
However, there is much lower incident rate for storing policies in directories and even less in relational databases among these organizations, indicating that without the use of embedded relational databases, the IT GRC applications being employed by these organizations are much less effective (Figure 20).
Worst outcomes
Those with the worst outcomes are storing policies of record governing the use of IT assets in spreadsheets, on paper and then in electronic office documents. These organizations are not bothering with software or machine-operable policy equivalents. The approach is somewhat like that of the first little pig in the story about the Three Little Pigs who built his house from straw because it was easier to build.
Figure 20: Where Policies for IT Assets are Stored
The IT portfolio for GRC should be built of brick, involving relational
databases with access to software and machine-operable
policy, directories, Email and collaborative systems, and less on methods that include paper, office documents and spreadsheets.
Source: IT Policy Compliance Group, 2010
However, the first little pig was quickly eaten by the big bad wolf. The evidence clearly shows that if you want to survive and thrive, the IT portfolio for GRC should be built of brick, involving relational databases with access to software and machine-operable policy, directories, Email and collaborative systems, and less on methods that include paper, office documents and spreadsheets.
Systems of Record for IT Assets and Controls
The systems of record for the inventory of IT assets and the controls are directly related to outcomes being experienced by organizations. On one end of the spectrum are the masters of IT using relational databases, directories and local information security controls on IT assets. The worst performers are relying on paper, spreadsheets and electronic office documents. The findings reinforce the level of automation and the use of IT GRC systems that are being used by the best performers to preserve value and manage risk related to the use of IT.
Best outcomes
Those with the highest revenue, profits, customer retention-rates, the lowest business disruptions, data loss or theft, and fewest problems with audit use information security controls for IT assets, electronic directories (Active Directory, LDAP, et cetera) and relational databases as the systems of record for the IT assets and their controls.
Average outcomes
Organizations with average revenue growth, profits, customer retention, business downtime, data loss or theft, and problems with audit appear similar to the best performers by the use information security controls for IT assets and relational databases. The biggest differences between the average and best performers include: 1) lower utilization rates, and 2) lower levels of automation and less frequent assessments.
Worst outcomes
In contrast, those experiencing the lowest revenue growth and profit, the least customer retention, highest rates of business downtime, the highest customer data loss or theft rates and the most difficulty with audit are relying on spreadsheets and paper as the principal repositories for the inventory of IT assets and their related controls. Electronic office documents are also employed but by fewer of these organizations (Figure 21).
Figure 21: Where the Inventory of IT Assets and Controls is Stored
Paper and spreadsheets do not scale. The ability to quickly discern and update assets and controls in the environment is a prerequisite for preserving value
and managing risk.
Source: IT Policy Compliance Group, 2010
The simple fact is that paper and spreadsheets do not scale, are hobbled by human error and are decidedly unaware of daily changes occurring in the environment. The research reveals the ability to quickly discern and update assets and controls in the environment is a prerequisite for preserving value and managing risk.
Systems of Record for Risks and Regulatory Mandates
The systems of record of inventory of risks and regulatory mandates vary directly by the outcomes being experienced by organizations. The best performers are using local information security controls on IT assets, directories and relational databases of IT GRC systems, while the worst performers are relying on spreadsheets and paper as the repositories for the inventory of risks and regulatory mandates.
The findings confirm the importance of the IT GRC systems that use relational databases with applications for policies, controls, risks and regulatory mandates. The findings also reveal the extent and value of the IT GRC systems that are focused on highly-specific value and risk issues that are related to the use of IT throughout the organization.
Best outcomes
Organizations with the highest revenue, profits, customer retention-rates, and the lowest business disruptions, data loss or theft, and fewest problems with audit use information
security controls for local IT assets, directories and the relational databases of IT GRC applications and systems to maintain the inventory of risks and regulatory mandates. These are complemented by the use of Email and collaborative systems, spreadsheets and electronic office document to update the existing systems of record.
The best performers are using local information security controls,
directories and relational databases of IT GRC systems, while the worst performers are relying on spreadsheets and paper as the repositories for the inventory of risks and regulatory mandates.
Average outcomes
Organizations with average revenue growth, profits, customer retention, business downtime, data loss or theft, and problems with audit are using local security controls for IT assets and electronic office documents as the primary repositories for the systems of record for risks and regulatory mandates related to the use of IT.