Introduction
The primary care sector of the United Kingdom National Health Service (NHS) has for many years been committed to computerisation. This is due among other factors to the innovative realisation by the commercial companies VAMP and AAH Meditel of the potential for collating data from general practice computers to form large databases for medical research. Although such schemes have outlived their creators, these initiatives in the late 1980s accelerated the early adoption of computers by general practices through publicising of practice management software and motivating many practices (initially with financial incentives) to take the first shaky steps
towards computerisation.1 Much of the investment VAMP made in its scheme was devoted to improving the completeness of data recording by their pioneer-ing data panel of general practitioners (GPs).1 Gov-ernment initiatives in the 1990s took general practice to a new level of data input by facilitating funding for primary care computers and by assigning financial incentives to targets; these targets were best demon-strated by the production of reports generated from the practice’s computer system.
The databases produced from anonymised patient records culled from UK systems have developed into global medical research resources. Such databases are utilised extensively in the areas of drug safety, epi-demiology and outcomes research.2,3However, there are some restrictions in using the individual data
Conference paper
Feasibility study and methodology to create
a quality-evaluated database of primary
care data
Alison Bourke MSc MRPS
Director
Hassy Dattani BSc MRPS
Director
Michael Robinson MB BS
Medical Advisor
The Health Improvement Network, London, UK
ABSTRACT
Objectives To build and test a model for the col-lection of computerised retrospective primary care data from the UK, and to assess its quality for use in medical and pharmaceutical research.
Design Collection and evaluation of sampled retrospective general practice data recording.
Setting General practices, using the Vision practice management software in the UK.
Main outcome measures Quality indicators of completeness of data recording.
Results Initial audit of 236 practices indicated good recording of prescribing in all practices and a high
level of completeness of recording of clinical infor-mation in many of the practices.
Conclusions In the group of practices studied, levels of recording were generally assessed to be of suf-ficient quality to enable a database of quality-evaluated, anonymised primary care records to be created.
sources available and the authors decided to assess the feasibility of creating a new primary care database that would address some of these limitations and that could be used in a complementary way with existing data resources to increase the statistical power of studies conducted.
The Health Improvement Network (THIN) was set up in May 2002 to investigate the feasibility of establishing a new database. THIN is a partnership between In Practice Systems (INPS) and the Medical Database Research Company (MDRC).
INPS is the general practice software vendor that succeeded VAMP. INPS supplies the Vision practice management software and holds about 17% of the UK market for general practice systems. MDRC, which is known as EPIC, has for many years facilitated access to the general practice research database or GPRD (the database originally created by VAMP).
Qualitative research, in the form of informal inter-view of researchers carried out by THIN, highlighted the following issues that often made existing sources of primary data difficult to use for their studies.
Complex data structure of databases
and complicated access methods
Interviewees expressed a preference for simple data structures similar to those of the original format of the GPRD, which comprised four record types: patient (with demographic information), therapy (all prescrib-able treatment), medical (signs, symptoms and pro-cedures), and additional data (generally preventative medicine, findings and tests). Data in this structure are no longer available for current GPRD data offered by the Medicines and Healthcare Products Regulatory Agency (MHRA).
Some data sources rely on ‘black box’ front-end processing tools to extract data. We found that many researchers preferred to work directly with the raw data since this gave them a greater level of confidence that the information being accessed closely represented that entered by the practice. In addition, any derived variables could be verified, and the extraction and analysis programs employed by individual researchers could be thoroughly tested.
Another potential obstacle to research expressed by our interviewees related to those data providers who specified that access to their information had to be via a web-enabled connection. Although this ensures that the providers have complete control and insight into researchers’ analysis methodology and ex-traction of data, it may result in technological difficulties involving firewalls and telecommuni-cations issues.
Non-availability of additional
information recorded as free text
by practices
General practice computer systems offer the ability for the practice staff to record additional uncoded free text data, sometimes referred to as ‘Comments’. On occasions these Comments have been extremely useful to research, especially where they negate a diagnosis or sign, for example; Code; Death – Comment: Of pet. They often provide quantification and define lateral-ity of the coded information such as ‘severe’ or ‘on left side only’. However, in rare cases the Comments con-tain confidential information such as the name of a newborn baby or the telephone number of a con-sultant. Therefore, unreviewed Comments have not been available to researchers.
Absence of socio-economic data at
individual patient level
Socio-economic indicators are assuming greater importance to medical research both in epidemi-ological terms and when studying health systems to ensure equity of service across populations. Clinical databases do not generally contain socio-economic data since at present it is not a field that GPs are required to collect, and indeed it would be difficult for them to do so consistently. It has always been possible to provide a proxy for socio-economic group by link-ing the practice’s postcode with socio-economic indi-cators collected at census. However, this was deemed to be insufficiently accurate as an indicator of an individual patient’s socio-economic group since practices often have a wide catchment area.
Insufficient demonstrable quality
assurance of data
One concern about studies on healthcare information is that the data might be incomplete or inaccurate, leading to unsafe conclusions and hence undermining the credibility of the research. Many commercially available databases have limited information on the quality and consistency of data, and this is seen as vital to researchers.
Method
An audit utility (a series of searches) was created to run on the Vision system at the practice sites to generate some basic statistics from the practice systems.
In May 2002, a letter of invitation to participate in the THIN scheme was sent to all 1600 practices using the Vision system in the UK. The letter explained THIN’s aims and the potential benefits to both the practices and the research community in general.
Those practices that expressed an interest were sent the audit utility and instructions on how this should be executed.
Assessing how well the Vision system
was utilised
The audit utility comprised queries that were based on ascertaining the numbers of consultations and prescriptions regularly recorded on the system, as well as analyses on the recording of pregnancy and death information. All queries related to the year 2001 (unless otherwise stated). The patient population for all searches, except on ‘death’, was those patients registered with the practice for the whole of 2001.
Consultation rate
The number of consultations noted is obviously a strong marker for the usage of the practice computer for recording data; therefore a rate of recorded con-sultations for the study year was generated. The denom-inator was the number of patients permanently registered with the practice for the whole of the year 2001. The query then searched the histories of these patients and counted up the number of consultations, both GP and non-GP, recorded for each. Using the number of consultations and the total number of active patients, a consultation rate per active patient for each practice for the year 2001 was calculated.
Prescribing rate
Generally, the first function that is computerised in a practice is prescription issuing since this greatly increases efficiency. Therefore it would be expected that most practices would show a realistic rate for prescription recording, so a rate of prescriptions issued for one study year was generated. The denominator was the number of patients permanently registered with the practice for the whole of the year 2001. The query then searched the therapy histories of these patients and counted up the number of acute and
repeat prescriptions issued during the year 2001. Using the number of prescriptions and the total number of active patients, a repeat and acute prescription issue rate per active patient for each practice for the year 2001 was calculated.
Pregnancy rate
Observational data provide an ideal environment for the study of birth defects and drugs taken during pregnancy; this research area could be deemed unethical using alternative study designs. Complete recording of birth outcomes is therefore highly im-portant in a database of primary care records. The report generated from the utility produced the total number of patients with a recording of pregnancy in the year 2000, and the total number of these patients with a birth outcome recorded in 2000 or 2001. The query searched the records of patients registered in 2001 who had a record of pregnancy in 2000. A search was then conducted, from the date of the pregnancy, looking for an outcome (including miscarriages, terminations and stillbirths) in 2000 and 2001.
Death rate
Observational studies often include death as an out-come variable. While the healthcare system is efficient at capturing deaths for registration purposes, it seldom extends to the entry of coded medical information about the death. The final part of the pre-recruitment analysis looked at the number of patients who had been assigned a date of transfer out of the practice for reason of death. The computer records of patients whose registration status indicated they had died dur-ing 2001 were examined by the query for a coded confirmation and/or reason for death. This informa-tion was used to calculate death rate in each practice, where the numerator was the number of people who died in the year of study and the denominator was the total number of patients being studied.
The results were sent to THIN for analysis of the completeness of data recording.
Results
Audit utility
Audit results
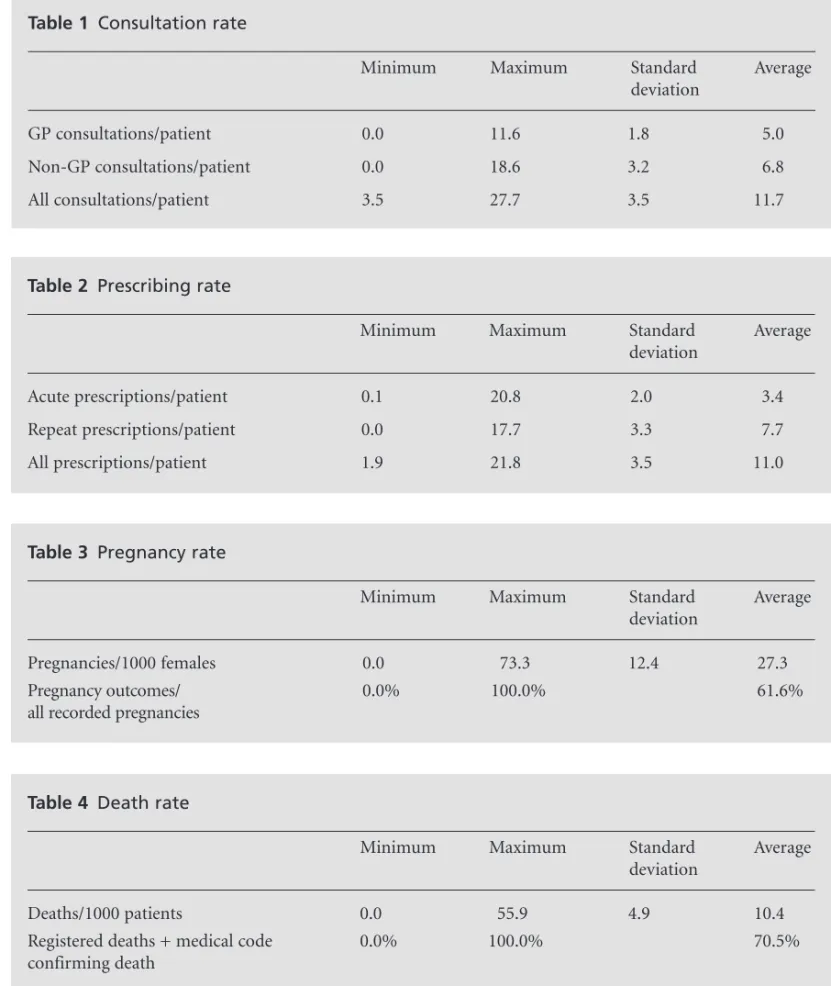
The audits showed an average consultation rate of 11.7 consultations per active patient in 2001 (see Table 1). For GP-only consultations the figure was 5.0. The audit results gave an average prescribing rate of 11.0 prescriptions per active patient in 2001 (see Table 2).
The practices returning audit results had an average rate of pregnancy of 27.3 per 1000 women (see Table 3).
In addition, on average over 60% of the pregnancies had a recorded outcome.
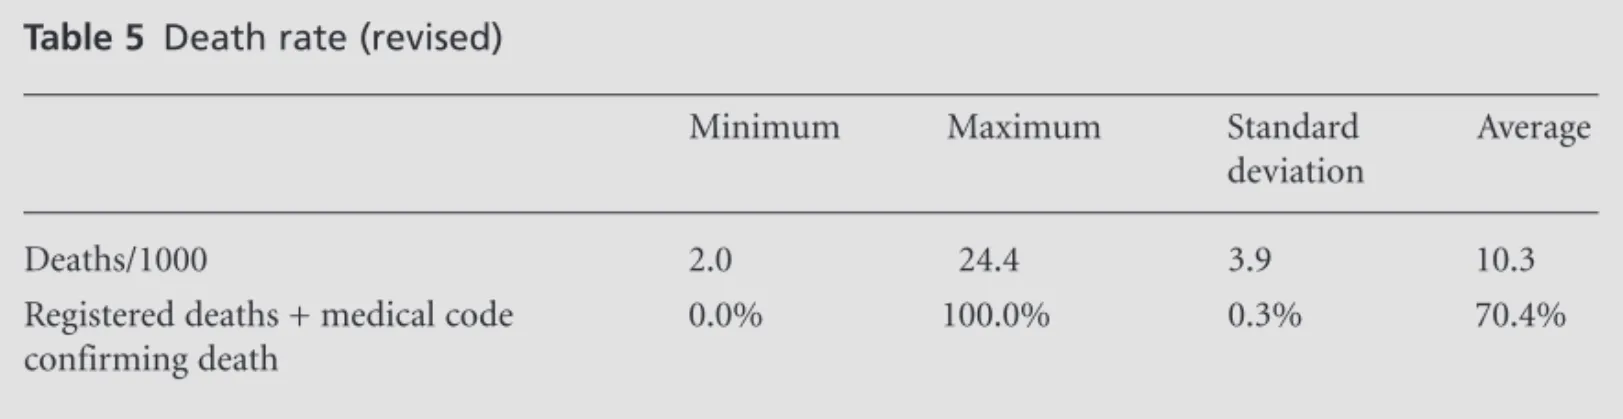
The average death rate per 1000 population from the audits was 10.4 (see Table 4). However, two prac-tices appeared to have no deaths, and one practice had over 5% deaths in a year in a population of over 9000 in a year. Both these results are outliers and may be recording errors. If we exclude these three practices, the results are as shown in Table 5.
Table 1 Consultation rate
Minimum Maximum Standard Average
deviation
GP consultations/patient 0.0 11.6 1.8 5.0
Non-GP consultations/patient 0.0 18.6 3.2 6.8
All consultations/patient 3.5 27.7 3.5 11.7
Table 2 Prescribing rate
Minimum Maximum Standard Average
deviation
Acute prescriptions/patient 0.1 20.8 2.0 3.4
Repeat prescriptions/patient 0.0 17.7 3.3 7.7
All prescriptions/patient 1.9 21.8 3.5 11.0
Table 3 Pregnancy rate
Minimum Maximum Standard Average
deviation
Pregnancies/1000 females 0.0 73.3 12.4 27.3
Pregnancy outcomes/ 0.0% 100.0% 61.6%
all recorded pregnancies
Table 4 Death rate
Minimum Maximum Standard Average
deviation
Deaths/1000 patients 0.0 55.9 4.9 10.4
Registered deaths + medical code 0.0% 100.0% 70.5%
On average, 70% of all deaths were accompanied by additional coded medical information about the death event.
Discussion
Consultation rate
The audits showed an average consultation rate of 11.7 consultations per active patient in 2001. For GP-only consultations the figure was 5.0; this can be compared with a GP consultation rate of 4.0 for the same year quoted by the UK Government.4 These figures are taken from the General Household Survey (GHS). For GP consultations in the GHS, people were asked for the number of NHS GP consultations in the two weeks before the interview; there may be some under-reporting as the GHS figure is extrapolated from a two-week period while the audit counts all consultations for the entire year. In addition, the sample size is far smaller for the GHS, which in 2001 was produced from just under 9000 interviews, com-pared to the combined list size of more than 1.6 million patients for the practices returning audits.
Prescribing rate
The audit results gave an average prescribing rate of 11.0 prescriptions per active patient in 2001; this compares with a national prescribing rate of 11.7 for the same year quoted by the Department of Health.5 One would expect the audit rate to be higher than the Department of Health figure, which represents dis-pensed prescriptions rather than written prescriptions. However, the Department of Health rate includes pre-scriptions from dentists and hospital doctors where they have been dispensed in the community.
Pregnancy rate
Figures for a comparable pregnancy rate were not available for 2001; however, compared with a national
conception rate of 28.8 (Office for National Statistics), the practices returning audit data showed an average pregnancy rate of 27.3.6
Death rate
The average death rate per 1000 population from the audit results after adjustment for outliers was 10.3. These results compare with external statistics from the Office for National Statistics, which quotes a death rate of 10.2 per 1000 population in 2001.7
The initial quantification of data quality indicated that most practices were recording data of an accept-able level of completeness. Each practice was therefore invited to contribute anonymised data to the THIN scheme, which has ethical approval from a Depart-ment of Health Multicentre Research Ethics Committee. In order to create a credible new data source, THIN will need to address the issues highlighted earlier.
Complex data structure of databases
and complicated access methods
THIN has specified that data recorded by the practices should be supplied to researchers in formats that facilitate analysis and allow an audit trail to be main-tained. Although data are collected in a data format that mirrors the complex Vision data model, this can be accessed as fewer data tables with no loss of data content or meaning. This will enable researchers to work directly with raw data at a programming level, or to import them into database or statistical packages.
Non-availability of additional
information recorded as free text
by practices
THIN plans to provide access to some of the free text by a combination of frequency analysis and review by medically qualified assessors.
Table 5 Death rate (revised)
Minimum Maximum Standard Average
deviation
Deaths/1000 2.0 24.4 3.9 10.3
Registered deaths + medical code 0.0% 100.0% 0.3% 70.4%
Absence of socio-economic data at
individual patient level
To enable a greater sensitivity than is generally avail-able, socio-economic indicators should be determined to the lowest possible level (that is, electoral ward). A ward has an average population of 5500 and there are just under 11 000 wards in the UK. Incorporation of socio-economic indicators can only be achieved by linking socio-economic data from census with the postcode of the patient, which is not collected by THIN for reasons of confidentiality.
In order to achieve the linking without compromis-ing anonymity, new software has been specified to link each patient’s postcode with a table of the Townsend socio-economic indicator at the practice site prior to data collection.8In this way the Townsend score can be returned with the anonymous data.
Insufficient demonstrable quality
assurance of data
The audit utility analyses provided simple parameters that elucidated the broad aspects of completeness in the potential dataset: now in-depth, formalised assess-ment of data quality is needed. One area of validation is concerned with erroneous recording where the wrong code is entered for a specific clinical condition. Past personal experience in reviewing thousands of case reports and looking at female-specific conditions in males (such as childbirth and pregnancy) and age-specific diseases (such as senile dementia in children) has showed that this yields very small numbers of data entry errors. Since GPs are using these records in their clinical practice, such errors are generally corrected in the practice during routine consultations. Therefore it has been decided to concentrate on areas of accuracy and completeness that are important to both the practices and the researchers.
Detailed computer analysis programs have been de-veloped to query the retrospective anonymised data that are being collected. These complex Quality Assurance (QA) programs pull together standard requirements for researchers (such as the degree to which smoking status and blood pressure are recorded) and also draw on the Scottish criteria (Scottish Programme For Improving Clinical Effectiveness In Primary Care – SPICE), the English National Service Frameworks (NSFs), the new General Medical Services GP contract and the Prescrib-ing Indicators National Group (PING) quality indicators. These indicators are being used not only to allow researchers to make an informed decision on practice and study period selection, but also as an intervention to prompt awareness and improvement in data record-ing among the practices in the form of regular feedback reports.
In UK primary care, the recording of such infor-mation as ‘Why has the patient or inforinfor-mation about the patient come to the practice?’ and ‘What is the plan to help?’ is generally accepted as good practice. However, the best quality records will contain all the elements necessary to close the quality circle (see Figure 1) by recording ‘Why has the decision been made?’ and ‘What has been the result of the action?’ At present, the procedures involved in general practice and the computer systems that exist to support them do not always encourage such information gathering. However, in order to enhance clinical effectiveness in primary care it will be necessary to capture the clin-ician’s decision-making process, as well as recording and monitoring outcomes in order to measure effect-iveness. In addition, the present recording of primary care data leaves very little room for the patients’ views. If we are to promote the definition of ‘effective treat-ment’ as ‘right treatment, right patient, right dose, right route, right time with the right information and at the right cost with regard to patient preference’, then primary care, and more specifically practice soft-ware, will have to evolve to allow room for the explan-ation of clinical treatment decision making, intervention monitoring and the patient’s involvement in the process.9
Conclusion
This study has shown that it is possible to assess completeness of data recorded in general practices by GPs and their staff, and that this information can be used to create a primary care database of sufficient quality for use in medical research.
ACKNOWLEDGEMENTS
We are indebted to Max Brighton and Anne Costello for their unflinching support and humour; Gillian Figure 1 The quality circle
What
has been the result of the action?
What
is the plan to help?
Why
has that decision been made?
Why
has the patient or information about the patient
Hall for her sound advice; Louise Pinder, Tom Gebsattel, Fiona Pinder, Mustufa Dungawalla, Adrian Glenister, Jean Paul, Jac Kinsey, Michelle Page and Debbie Cuthbert for their enthusiastic help. Contributors: AB took the strategic lead in the project; HD was a major contributor of ideas and made the plans into reality; MR provided primary care expertise, knowledge of the GP computing market and invaluable editorial assistance.
REFERENCES
1 Hall GC, Luscombe D and Walker SR. Post-marketing surveillance using a computerised general practice database.Pharmaceutical Medicine1988;2:345–55. 2 Garcia Rodriguez LA, Perez-Gutthann S and Jick S. The
UK General Practice Research Database. In: Strom BL (ed).Pharmacoepidemiology(3e), pp. 375–82. Chichester: Wiley, 2000.
3 Netting an important database [editorial].Lancet2001; 357:649.
4 National statistics. Living in Britain 2001: Table 7.19, Average number of NHS GP consultations per person per year: 1972 to 2001. www.statistics.gov.uk/lib2001/viewer Chart4797.html
5 National statistics/Department of Health statistics.
Prescriptions Dispensed in the Community: statistics for 1991 to 2001 – England. www.publications.doh.gov.uk/ public/sb0214.htm
6 National statistics. Table 12.1, Conceptions 1990–2000. www.statistics.gov.uk/downloads/theme_population/FM 1_30_2001_Revised/FM1no30_2001_Revised.pdf
7 National statistics.Vital Statistics Summary, 1976 Onwards: Population Trends 116.www.statistics.gov.uk/STATBASE/ ssdataset.asp?vlnk=8377
8 Townsend P, Phillimore P and Beattie A. Health and Deprivation: inequality in the North. London: Routledge, 1988.
9 Quick J, Rankin J, Laing R et al. Managing Drug Supply: the selection, procurement, distribution and use of pharmaceuticals. Bloomfield: Kumarian Press, 1997.
CONFLICTS OF INTEREST
None.
FUNDING
This project was supported by seed funding of the joint venture, The Health Improvement Network.
ADDRESS FOR CORRESPONDENCE
A Bourke
Regeneration House York Way
Kings Cross London N1 0UZ UK
Tel: +44 (0)20 7713 1118 Fax: +44 (0)20 7713 1119
Email: [email protected]