Class Ratemaking for Workers
Compensation: New Developments
in Loss Development
by Thomas V. Daley
AbSTRACT
For loss cost filings beginning in October 2009, NCCI
imple-mented the largest set of changes in 40 years to the methodology
used to determine class pure premiums in workers compensation.
This paper describes the new loss development methodology
NCCI has implemented, the applied research approach, and
some analyses of actual results achieved after making the
modi-fications. It illustrates how specific areas of class ratemaking
were modified, namely, loss development, limiting large claims,
and applying expected excess provisions.
KEYwORdS
Workers compensation, NCCI ratemaking, NCCI loss cost filings, class ratemaking, loss development by part of body, expected excess by hazard group
Class Ratemaking for Workers Compensation: New Developments in Loss Development
2.1. Availability of new URE
data elements
The source data used for class ratemaking is the Workers Compensation Statistical Plan (WCSP) data (a.k.a Unit Statistical Plan). Most NCCI states approved the collection of the URE data elements in 1996. The first complete policy period available in most states is policy year 1997. Some states did not approve the col-lection of URE data in their state for a few more years (the last state was approved in 2002). Thus, in a few states, the database is less complete historically, adding further to the challenges of our research agenda.
Data historically collected in the WCSP includes the employer’s payroll and indemnity and medical case incurred losses by claim by injury type (e.g., fatal, permanent total, permanent partial, temporary total, and medical only). Some, but not all, of the URE data elements reported to NCCI by carriers are:
• Paid ALAE (case reserves were optional) • Paid losses separate from “paid + case” losses • Injured Part of Body
• Nature of Injury • Cause of Injury
• Deductible Reimbursement Amounts • Lump Sum Indicator
Effective with policy period 1999 and subsequent, carriers began mandatory reporting to NCCI all URE data elements and WCSP data elements beyond a fifth report, up to and including a tenth report.
2.2. Overview of the methodology
changes
Significant changes to the NCCI class ratemaking were implemented in the following six areas:
1. Loss development factors (LDF) are derived using claim characteristics such as injured part of body, the open and closed claim status at first report, and the injury type category.
2. The loss development triangles are being expanded from five reports out to, eventually, ten reports. 3. Large claims will be capped at $500,000 and
ex-pected excess factors (derived from the new seven
1. Introduction
In the late 2000s, NCCI modified the method-ology used to determine class pure premiums for workers compensation insurance. The new meth-odology was filed in NCCI states’ loss cost filings beginning October 1, 2009. Key changes made that are covered in this paper are (1) a new method for developing losses to ultimate value and (2) a new method for handling large claims. The class rate-making methodology was last modified with some minor changes in 1993, which were: (a) the number of policy periods used in determining pure premi-ums for each class was increased from three to five, (b) the underlying class credibility formulae were modified, and (c) the number of industry groups used for targeting class loss cost changes was increased from three to five.
The following topics are referenced in this paper, but not covered in detail:
• The methodology to determine the change in a state’s overall indicated loss cost level
• The new methodology for mapping class codes to the seven hazard groups
• The methodology underlying excess loss factors • The derivation of a loss cost for a class code.
Many of my colleagues at NCCI made significant contributions to the success of this huge undertaking, and are duly mentioned in the acknowledgement. This could not have been possible without their valu-able insights, hard work, and support.
2. background and Methods
The motivation underlying the applied research approach is:
• To improve the equity of loss costs across class codes
• To improve year-to-year stability of loss cost changes by class code
Variance Advancing the Science of Risk
mapped and the typical indemnity loss development pattern:
The losses were evaluated at first through fifth report (@18, @30, @42, @54, and @66 months, respectively). A tail factor was applied to the serious loss development triangles only, and was derived from NCCI financial call data used in the overall aggregate loss cost indication for the state. It was assumed that all loss development beyond fifth report was gener-ated by serious claims only. Balancing to the financial data tail, a large tail factor was applied to the serious losses to generate a fifth-to-ultimate LDF, while a tail factor of unity was applied to the non-serious losses. An illustration of the prior tail factor derivation is shown in Figure 2.
The prior loss development approach had five shortcomings:
1. Claim severity was not a good indicator of the propensity of a claim to develop in the future. 2. As claims matured, many would “crossover” the
critical value at subsequent reports, and be re-assigned into the serious grouping, or vice versa. 3. Critical value crossover distorts the predictive
abil-ity of the loss development factors in the serious and non-serious triangles.
4. The medical dollar amount was ignored in deter-mining whether or not a claim was categorized as serious or non-serious.
5. No distinction between serious and non-serious loss dollars was made within the medical loss triangles from first through fifth report (i.e., total medical was used). However, a fifth-to-ultimate medical tail factor was applied to the total medi-cal loss dollars associated with the serious lost-time claims.
2.4. The problem of critical
value crossover
The critical value methodology was used in class ratemaking at NCCI beginning in 1966. Figure 3 demonstrates the distorting impact that critical value “crossover” inflicts on a dataset of permanent par-tial claims countrywide. Claims below the critical hazard group mapping by class code) will be used
to calculate ultimate losses.
4. Serious and non-serious partial pure premium com-ponents were eliminated, and replaced by one indemnity pure premium component.
5. The computation of the indicated losses within the industry group differential calculation was modi-fied to include the new loss development approach 6. The full credibility standards for indicated and
national pure premiums were modified.
This paper does not cover the credibility standards.
2.3. background: The prior loss
development approach
Understanding the nuances of the former approach will help the reader gain a better appreciation for the reasoning behind the newly implemented changes to loss development. The previous approach to deter-mine loss development factors (LDF) for class rate-making was to segregate the dollars of loss generated from claims into two loss development categories. They were (a) the serious grouping and (b) the non-serious grouping. An arbitrary dollar value, referred to as the critical value, which varied significantly by state, was determined for each state’s loss cost filing. All permanent partial claims whose indemnity dollar amount exceeded the critical value, as measured on a “paid + case” basis, were categorized into the serious grouping, and referred to as major permanent partial claims. This was done to provide a greater volume of serious losses to derive LDFs.
In workers compensation, different levels of indem-nity benefits are paid based upon the injury types: fatal (Fa), permanent total (PT), permanent partial (PP), temporary total (TT), and medical only (MO).
Class Ratemaking for Workers Compensation: New Developments in Loss Development
Serious Losses
Fatal, Permanent Total, and Major Permanent Partial Combined
1st Report Start: 1/1/2003
1st Report End: 12/31/2003
PY Data 1st Report 2nd Report 3rd Report 4th Report 5th Report
1/98-12/98 460,401,442 535,321,008 574,106,684
1/99-12/99 340,191,451 489,175,745 560,465,442 592,806,690
1/00-12/00 141,410,721 312,882,740 450,176,823 526,656,041
1/1-12/1 128,481,157 295,773,844 438,063,233
1/2-12/2 108,611,922 260,153,546
1/3-12/3 105,915,019
Link Ratios 1:2 2:3 3:4 4:5
1/98-12/98 1.163 1.072
1/99-12/99 1.438 1.146 1.058
1/00-12/00 2.213 1.439 1.170
1/1-12/1 2.302 1.481
1/2-12/2 2.395
AVERAGE DEV. 1:2 2:3 3:4 4:5
2 Year Averages 2.349 1.460 1.158 1.065
2 YR. DEV. TO ULT. 1:U 2:U 3:U 4:U 5:U
Unadjusted 5.082 2.164 1.482 1.280 1.202
Figure 1a. Serious indemnity losses for NCCI State—unlimited loss amounts
Non-Serious Losses:
Temporary Total and Minor Permanent Partial Combined
1st Report Start: 1/1/2003
1st Report End: 12/31/2003
PY Data 1st Report 2nd Report 3rd Report 4th Report 5th Report
1/98-12/98 437,508,261 432,646,920 431,589,463
1/99-12/99 507,462,094 503,838,453 499,819,176 498,146,055
1/00-12/00 513,724,388 580,792,681 577,827,036 573,577,900
1/1-12/1 491,994,692 545,990,644 542,748,392
1/2-12/2 484,992,408 535,107,606
1/3-12/3 454,969,833
Link Ratios 1:2 2:3 3:4 4:5
1/98-12/98 0.989 0.998
1/99-12/99 0.993 0.992 0.997
1/00-12/00 1.131 0.995 0.993
1/1-12/1 1.110 0.994
1/2-12/2 1.103
AVERAGE DEV. 1:2 2:3 3:4 4:5
2 Year Averages 1.107 0.995 0.993 0.998
2 YR. DEV. TO ULT. 1:U 2:U 3:U 4:U 5:U
Unadjusted 1.092 0.986 0.991 0.998 1.000
Source: NCCI WCSP Data
Variance Advancing the Science of Risk
oped upward at later reports. The initial approach proceeded as follows:
1. Extract a large volume of claims containing claim specific information such as injury type, report level, injured body part, open/closed claim indi-cator, and associated dollars of “paid + case” loss. 2. Assess the impact that critical value “crossover”
(illustrated earlier) and injury type “crossover” may have upon loss development factors. (A common example of injury type “crossover” is a temporary total claim eventually becoming a permanent par-tial claim at a later age.)
value are deemed minor while those that exceed it are deemed major. Various link ratios were computed for comparison from first to fourth report.
2.5. How we solved the crossover problem
A fresh approach was initiated by investigating a new field, the injured part of body, which NCCI began collecting on its Unit Report Expansion start-ing with policies effective in 1996. NCCI’s actuar-ies researched to determine whether the injured body part provided any causal relationship in predicting whether or not a claim’s loss dollar amountdevel-Unlimited Indemnity
(using 2-year average development)
(1) (2) (3) (4)
Modified
FIRST REPORT Incurred Development Amendment Losses
o t c a F 5
: 1 s
e s s o L 3
/ 2 1 -3 /
1 r (1)x((2)x(3))
Fatal 13,262,549 4.228 1.098 61,564,752
Permanent Total 22,327,493 4.228 0.752 70,979,100
Major PPD 70,324,977 4.228 0.907 269,696,287
Minor PPD 135,337,672 1.092 0.907 133,984,295
Temporary Total 319,632,161 1.092 0.983 342,965,309
Medical Only Contract Medical
(5) (6) (7) (8)
Modified
SECOND REPORT Incurred Development Amendment Losses
o t c a F 5
: 2 s
e s s o L 2
/ 2 1 -2 /
1 r (5)x((6)x(7))
Fatal 11,800,628 1.800 1.258 26,716,622
Permanent Total 57,888,155 1.800 0.569 59,277,471
Major PPD 190,464,763 1.800 0.807 276,745,301
Minor PPD 182,412,684 0.986 0.807 145,200,496
Temporary Total 352,694,922 0.986 0.960 334,002,091
Medical Only Contract Medical
CALCULATION OF SERIOUS FIFTH-TO-ULTIMATE
(9) Combined Serious Losses 764,979,533
(10) Combined Non-Serious Losses 956,152,191
(11) Combined Total Losses 1,721,131,724
(12) Financial Data Fifth-to-Ultimate Development Factors 1.090
(13) Fifth-to-Ultimate Loss Development 154,901,855
(13) = ((12)-1)x(11)
(14) Fifth-to-Ultimate Serious Loss Development Factors 1.202
(14) = ((9)+(13))/(9) Source: NCCI WCSP Data
Class Ratemaking for Workers Compensation: New Developments in Loss Development
whether or not the injured body part was a determining characteristic of loss development. The solution was to “lock down” the entire dataset of claims being studied at each link ratio. Thus, the exact same claims were observed at adjacent reports, such as first to second, and the loss development measured accordingly. Note, the set of claims used to observe the loss development from second to third report could be a different set of claims than those observed at first to second report.
This “lock down” approach helped NCCI deter-mine which injured body parts developed more or less than others.
2.5.1. How was the injured body part approach determined?
Two new loss development triangles were created. The first was a grouping of claims whose injured body parts, and associated loss dollars, were likely to 3. Determine if claim severity is an indicator of the
propensity of a claim to develop.
4. Analyze the injured body part to determine if it is a predictor of a claim’s propensity to develop (or not develop).
5. Group the body part and injury type combinations into those more likely-to-develop (L) and those not-likely-to-develop (N) so that the groupings are more predictive than the serious and non-serious groupings.
True loss development can best be measured if claims are not allowed to migrate across different development groups. Figure 3, which illustrated the distortion to link ratios that “crossover” causes pro-vided valuable insight supporting this. Because claims were moving across the critical value and also across the injury types, a solution was needed to assess
Dollars in 000's
(1) (2) (3) (4) (5)
(2)/(1) Link Ratio
Status of Claim Status of Claim Indemnity $ Indemnity $ Indemnity Based on Status Link Ratio @ 1st @ 4th @ 1st @ 4th Link Ratio @ 1st Incl. Crossover
* 3 3 0 . 2 7
3 3 . 1 0 8 9 , 0 2 8 2
8 9 , 3 1 6 r
o j a M r
o j a M
Major minor 149,180 60,947 0.409
minor Major 207,820 730,279 3.514
minor minor 1,186,650 1,137,543 0.959 0.859 **
(1) (2) (3) (4) (5)
(2)/(1) Link Ratio
Status of Claim Status of Claim Medical $ Medical $ Medical Based on Status Link Ratio @ 1st @ 4th @ 1st @ 4th Link Ratio @ 1st Incl. Crossover
3 4 7 . 1 0
9 1 . 1 6 3 4 , 0 0 5 9
5 3 , 0 2 4 r
o j a M r
o j a M
Major minor 92,458 63,417 0.686
minor Major 211,613 393,183 1.858
3 3 8 . 0 1
3 9 . 0 2 4 7 , 4 7 0 , 1 1 6 4 , 4 5 1 , 1 r
o n i m r
o n i m
* 2.033=(820,980+730,279)/(613,981+149,179) ** 0.859=(60,947+1,137,543)/(207,820+1,186,650)
Range of Critical Values across NCCI states = [$20K, $90K]
Policy Year 1997 Countrywide - NCCI States
1.100
} 1.075 }
}
1.156
1.339
}
Source: NCCI WCSP Data
Variance Advancing the Science of Risk
to-develop categories. The second metric determined what percentage of claims remained open at fifth report, sorted by part of body. Figure 5 shows an illus-tration for permanent partial claims.
Staff calculated the same two metrics for tempo-rary total claims, which yielded similar results as permanent partial claims.
Actuarial judgment also played a role in the final decisions to determine into which groupings the vari-ous body parts were ultimately placed. Consideration was given to the fact that certain parts of body are considered scheduled injuries in many states hav-ing scheduled permanent partial injuries. Body parts like toes, fingers, hands, feet, arms, and legs are often mandated a pre-determined dollar amount in statu-tory benefit schedules. Therefore, they are not likely to develop upward. A listing of all body part codes and the grouping to which they were mapped is pro-vided in the Appendix.
2.5.2. How was the injury type considered? Once the body parts were mapped to the likely-to-develop (L) and not-likely-to-likely-to-develop (N) groupings, a few different tests were performed. The first char-acteristic considered was the claim’s injury type.
Two injury types initially examined in depth were temporary total (TT) and permanent partial (PP), where the majority of claims and loss dollars reside. The first test was whether or not claim severity was a good indicator of the likelihood of a claim develop-ing and the second test was to observe if the group-ings of body parts produced link ratios that were larger for the L grouping than the N grouping. The second test would substantiate the mapping of body parts to the L and N groupings.
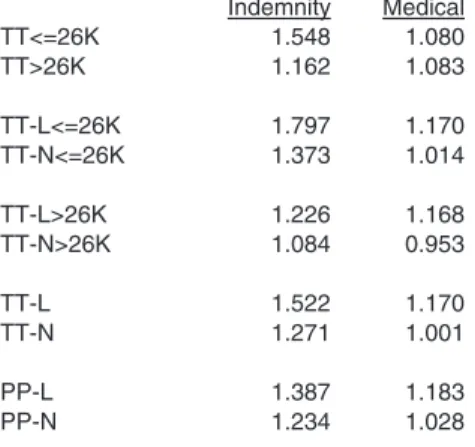
Figure 6 provides three key observations:
1. Claim severity is not predictive of higher loss de-velopment (claims below $26,000 produced much higher LDFs for TT than those which began at a value greater than $26,000), suggesting the criti-cal value approach is conceptually flawed 2. The medical pattern behaves differently than
in-demnity, in that the LDF from first to fifth is about the same whether above or below the $26,000, and develop upwards significantly over time. The second
grouping would consist of claims whose injured body parts, and associated loss dollars, were not likely to develop over time. The creation of body part group-ings made sense, as there were 55 body part codes, and generating a credible volume of losses at a state level for each injured part of body was a concern. Within a state, loss development between the two groups was compared relative to one another, as the losses in some states develop significantly more than others. For example, a back claim filed within a state having significant attorney involvement and longer benefit durations would be expected to develop more than a similar back claim in a state with little attorney involvement and shorter durations. (Some states have time limits for collecting benefits (i.e., duration), such as 425 weeks for permanent partial claims)
Determining which of the 55 body part codes would be mapped into the likely-to-develop and not-likely-to-develop was the next step.
Two different analyses were completed for body part grouping. The result of the first analysis is shown in Figure 4. It measured loss development dollars by the “lock down” approach from first through fourth report (initially, fifth report was unavailable). The metric quantifying the observed average loss devel-opment per claim was
Reported Losses @ 4th Reported Losses @ 1st−
((
)
Number of claims
This approach provided insight into which body parts developed more than others.
In Figure 4, the body part codes contributing to the largest amount of upward loss development per case were the back, head, neck, multiple body, and internal organs. The downside of using this metric as the only measure for making decisions is that much loss development in workers compensation happens beyond fifth report. NCCI later began collecting sixth reports of open claims for policy year 1999 and beyond, eventually collecting up to tenth report.
not-likely-Class Ratemaking for Workers Compensation: New Developments in Loss Development
s (19) ans (48)
and (39) (33) 32) (26)
3) Body (65)
44) 46) 55) 6) en (61)
hysic al In jury (66)
(12) so ft tiss ue (18)
er Arm (31)
er Leg (52)
er Back (41) k so ft tiss ue (25)
th (17) iple Low extrem ity (50)
tiple Upper extremity (30)
e (15) eat Toe (58) wer Leg (54)
ultiple Body (90) pine (63) houlder (38)
Multiple Trunk (40)
ip (51) Multiple Head (10)
Skull (11) Multiple Body (91) Spine (45) Lower Back (42) Spine (22) Spine (43) Multiple Neck (20)
Buttocks (62) Spine (23) Spine (21) Lungs (60) Spine (47) Larynx
(24)
$10,000
$20,000
$30,00
0
$40,000
$50,000
$60,000 Source: NCCI
WC
SP Data
(##) - Part of Body code Av
g. Loss Dev
elopment = (Reported loss @ 4th - Reported loss @1st) / # claim
s
Artificial applian ce ( 64)
Heart (49) Ear (13) Finger (36)
Thumb (37)
Toes ( 57)
Teeth (16) Facial Bones
Internal org
Hand (35) Eye (14) Wris t & Ha
Wris t (34)
Low Arm Elbow (3 Trachea Knee (5 3
Multiple Chest (4 Pelvis (4
Ankle (5 Foot (5 6
Abdome No ph Brain Head Uppe Uppe Uppe Neck Mout Mult Mult Nose Gre Low Mu Sp Sh M H M
-$20,000
-$10,000
$0
Figur
e 4.
The obser
ved average dollars of loss development per case is sor
ted by injur
ed par
t of body for permanent
par
Variance Advancing the Science of Risk
Finger (36) Thumb (37) Teeth (16) Toes (57) Trachea (26)
Great Toe (58)
Abdomen (61)
Hand (35) Mouth (17)
Low Ar m (33)
Upper Arm (31) Wrist (34)
Head soft tissue (18)
Foot (56) Knee (53) Ankl e (55)
Spine (45) Nose (15) Upper Leg (52)
Facial Bones (19)
Pelvis (46) Elbow (32)
Multiple Upper ex
tremity (30)
Lowe r Leg (54)
Chest (44) Ear (13) Wrist & Hand (39)
Neck soft tissue (25)
Shoulder (38) Eye (14)
Lowe r Back (42)
Skull (11)
Multiple Low extrem ity (50)
Spine (63) Internal organs (48)
Buttocks (62) Multiple Head (10)
Multiple Body (90)
Hip (51) Multiple Trun k (40)
Multiple Neck (20)
Spine (21) Multiple Body (65)
Larynx (24)
No phys ical In jury (66)
Spine (47) Brain (12) Upper Back (41)
Spine (22) Spine (23) Spine (43) Heart (49) Multiple Body (91)
Lungs (60)
5%
10
%
15%
20%
25%
30%
35%
40% Source: NCCI WCSP Data (##) - Part of Body code
Artificial appliance (64) Finger Thum Teet To
0%
5%
Figur
e 5.
Par
ts of body having a higher per
centage of open claims at fifth r
epor
t wer
e categorized likely-to-develop. NCCI
obser
ved that the back, head, neck, multiple body
, and internal or
gans had the highest per
centage of permanent par
tial claims
open at fifth r
epor
Class Ratemaking for Workers Compensation: New Developments in Loss Development
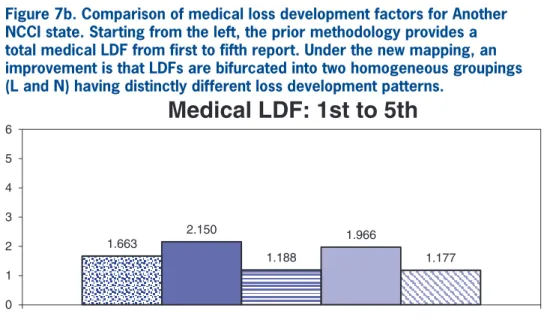
Figures 7a and 7b illustrate LDF patterns using the following groupings of claims based upon injured part of body and injury type combinations:
Likely L
(
)
=Fatal PT PP-L TT-L.+ + + ( . )2 1Not Likely N
(
)
=PP-N TT-N MO.+ + ( . )2 2Serious Fatal PT Major PP.= + + ( . )2 3
Non-serious Minor PP TT MO.= + + ( . )2 4
Because many fatal and permanent total claims are open at fifth report, each is originally placed into the L grouping. Medical-only claims are assigned to the N grouping because most open and close out quickly, unlikely to develop upward.
The injury types providing the biggest challenges are the permanent partial and temporary total claims because:
• Many temporary total claims evolve into perma-nent partial claims at the end of the healing period, when injured workers reach maximum medical improvement.
• Both critical value crossover and injury type cross-over are common for temporary total and perma-nent partial claims.
• These two injury types comprise between 70% and 80% of all loss dollars incurred.
The team of NCCI actuaries started investigat-ing injury type loss development patterns by state, exploring if other URE data elements could be used to further refine the L and N groupings.
2.5.3. The search for the optimal loss development groupings
Some of the data elements explored were claims including allocated loss adjustment expense (ALAE), the nature of injury, and the cause of injury. None of these provided any clear solutions.
However, there was one data element that was clearly correlated with the propensity of a claim to develop (or not), the open/closed claim status indi-cator. The majority of loss development observed was coming from claims which were open at first 3. The L group develops more than the N group for
both PP and TT, as evidenced by the higher link ratios.
Next, the new groupings and their loss development patterns were compared by state to the prior serious and non-serious LDFs. Figures 7a (indemnity) and 7b (medical) provide LDF comparisons for two states, identified only as NCCI state (based on the same dol-lars as Figure 1a) and Another NCCI state.
Figures 7a and 7b show LDFs on an unlimited basis and on a limited (@ $500K) basis. Unlimited factors were used in the prior methodology. The new class ratemaking enhancements include limit-ing individual claims at $500K. Thus, a portion of the difference in the magnitude of LDF from prior to new methodology is due to a loss limitation being applied within the new methodology.
Cumulative 1st to 5th report *
Indemnity Medical
TT<=26K 1.548 1.080
TT>26K 1.162 1.083
TT-L<=26K 1.797 1.170
TT-N<=26K 1.373 1.014
TT-L>26K 1.226 1.168
TT-N>26K 1.084 0.953
TT-L 1.522 1.170
TT-N 1.271 1.001
PP-L 1.387 1.183
PP-N 1.234 1.028
TT- Temporary total disability claims PP- Permanent partial disability claims
L - Includes claims having likely-to-develop body parts. N - Includes claims having NOT likely-to-develop body parts. > 26K - Includes claims whose initial report was greater than 26K.
* Loss development factors exclude all crossover. Source: NCCI WCSP Data
Figure 6. Using a critical value of $26,000,1the
claims are locked down at each adjacent link ratio to eliminate both critical value and injury type “crossover.” This allowed NCCI to observe the true loss development patterns to validate the body part mapping.
1$26,000 was an indemnity dollar amount determined arbitrarily
Variance Advancing the Science of Risk
1.663
2.150 1.966
2 3 4 5
6
Medical LDF: 1st to 5th
1.188 1.177
0 1
Total Likely Not Likely Likely Limited 500k Not Likely Limited 500k
Likely (L) = Fatal + PT + PP-L + TT-L Not Likely (N)= PP-N + TT-N + MO
Total = Fatal + PT + Major PP + Minor PP + TT + MO
Figure 7b. Comparison of medical loss development factors for Another NCCI state. Starting from the left, the prior methodology provides a total medical LdF from first to fifth report. Under the new mapping, an improvement is that LdFs are bifurcated into two homogeneous groupings (L and N) having distinctly different loss development patterns.
4.228
3 4 5 6
Indemnity LDF: 1st to 5th
1.092
1.914
1.447
1.862
1.436
0 1 2
Serious Non-ser Likely Not Likely Likely Limited 500k Not Likely Limited 500k
Likely (L) = Fatal + PT + PP-L + TT-L Not Likely (N)= PP-N + TT-N Serious = Fatal + PT + Major PP
Non-Serious = Minor PP + TT
Class Ratemaking for Workers Compensation: New Developments in Loss Development
• LC—“likely” body part and claim closed at first report
• NO—“not-likely” body part and claim open at first report
• NC—“not-likely” body part and claim closed at first report.
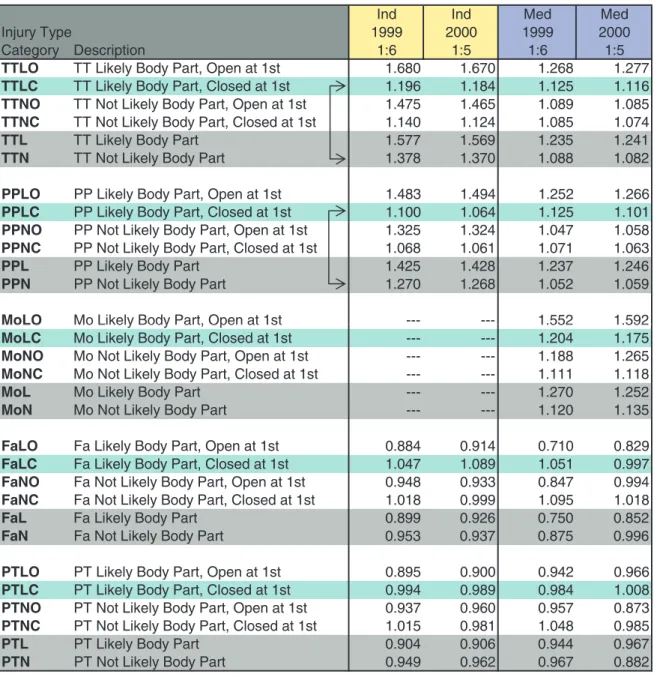
Three important observations for permanent par-tial (PP) and temporary total (TT) claims follow from Figure 8a:
1. Losses from claims in the L body part catego-ries consistently develop upward more than its N counterpart, confirming that the body part as-signments are sound.
2. Claims open (O) at first report develop much more than the closed (C) claims do. Thus, the combination of L and O at first report better differentiates the LDF.
3. Focus on the arrows on Figure 8a for TTLC and PPLC. Claims assigned to L for a particular body part, but which were closed (C) at first report, align more closely with the TT-N and PP-N LDF grouping. Thus, by moving claims having the combination of L and C at first report into the N grouping further refines the LDF patterns.
NCCI constructed various alternatives based upon the observations from Figure 8a. The combinations of injury type/part of body grouping (L or N)/claim status (O and C) were organized into new options in Figure 8b to compare with the “original” research proposal (refer to Equations 2.1 and 2.2).
2.5.4. How are the fatal and permanent total injury types treated?
Observe in Figure 8a that claims from the perma-nent total (PT) and fatal (Fa) injury types demon-strate unique loss development characteristics. That is, the L and N body part categories do not discern loss development patterns as it does in other injury types. The LDF behaves in the opposite manner (i.e., L < N and C > O).
Research was conducted on the development pat-terns of fatal and PT claims. Because injury type report, which is logical. Closed claims are not likely
to develop (however, a few claims do close and reopen in workers compensation).
A new countrywide (i.e., all NCCI states) data extract was created. Dollars of loss were compiled for each policy year and state as follows:
• By injury type at each report level, for policy years 1999–2002 (1999 had 6 annual reports available at the time)
• By the claim status open (O) or closed (C) at first report and each subsequent report level
• By the injured part of body assignment to category L or N
• Large claims were limited at $500,000
• Indemnity and medical losses were aggregated separately, but combined across all states
• Only states and years in URE format.
Claims having an injured body part mapped to the L grouping are referred to as “likely” body parts. Simi-larly, claims having an injured body part mapped to the N grouping are referred to as “not-likely” body parts.2 All claims are “locked down” at every
report level to examine true loss development, not allowing any to move across subcategories. This variation of the “lock down” is different than that used earlier in the initial research of injured part of body, where the set of claims is fixed only at adjacent reports for determining each link ratio.
Once “locked down” at the initial report, no claims are allowed to enter or leave the group throughout the entire observed development time frame (i.e., first through sixth report). The loss dollars for each injury type are segregated into four new subcatego-ries and LDFs are computed:
• LO—“likely” body part and claim open at first report
2NCCI later references the “likely” body parts as Part of Body Group A
Variance Advancing the Science of Risk
Development 1st to x report (1:x) -- Limited Incurred Losses Claims Locked at 1st
Ind Ind Med Med
0 0 0 2 9
9 9 1 0
0 0 2 9
9 9 1 e
p y T y r u j n I
5 : 1 6
: 1 5
: 1 6
: 1 n
o it p ir c s e D y r o g e t a C
TTLO TT Likely Body Part, Open at 1st 1.680 1.670 1.268 1.277
TTLC TT Likely Body Part, Closed at 1st 1.196 1.184 1.125 1.116
TTNO TT Not Likely Body Part, Open at 1st 1.475 1.465 1.089 1.085
TTNC TT Not Likely Body Part, Closed at 1st 1.140 1.124 1.085 1.074
TTL TTLikelyBodyPart 1.577 1.569 1.235 1.241
TTN TTNo tLikelyBodyPart 1.378 1.370 1.088 1.082
PPLO PP Likely Body Part, Open at 1st 1.483 1.494 1.252 1.266
PPLC PP Likely Body Part, Closed at 1st 1.100 1.064 1.125 1.101
PPNO PP Not Likely Body Part, Open at 1st 1.325 1.324 1.047 1.058
PPNC PP Not Likely Body Part, Closed at 1st 1.068 1.061 1.071 1.063
PPL PPLikelyBodyPart 1.425 1.428 1.237 1.246
PPN PPNo tLikelyBodyPart 1.270 1.268 1.052 1.059
MoLO Mo Likely Body Part, Open at 1st --- --- 1.552 1.592
MoLO Mo Likely Body Part, Open at 1st 1.552 1.592
MoLC Mo Likely Body Part, Closed at 1st --- --- 1.204 1.175
MoNO Mo Not Likely Body Part, Open at 1st --- --- 1.188 1.265
MoNC Mo Not Likely Body Part, Closed at 1st --- --- 1.111 1.118
MoL MoLikelyBodyPart --- --- 1.270 1.252
MoN MoNo tLikelyBodyPart --- --- 1.120 1.135
FaLO Fa Likely Body Part, Open at 1st 0.884 0.914 0.710 0.829
FaLC Fa Likely Body Part, Closed at 1st 1.047 1.089 1.051 0.997
FaNO Fa Not Likely Body Part, Open at 1st 0.948 0.933 0.847 0.994
FaNC Fa Not Likely Body Part, Closed at 1st 1.018 0.999 1.095 1.018
FaL FaLikelyBodyPart 0.899 0.926 0.750 0.852
FaN FaNo tLikelyBodyPart 0.953 0.937 0.875 0.996
PTLO PT Likely Body Part, Open at 1st 0.895 0.900 0.942 0.966
PTLC PT Likely Body Part, Closed at 1st 0.994 0.989 0.984 1.008
PTNO PT Not Likely Body Part, Open at 1st 0.937 0.960 0.957 0.873
PTNC PT Not Likely Body Part, Closed at 1st 1.015 0.981 1.048 0.985
PTL PTLikelyBodyPart 0.904 0.906 0.944 0.967
PTN PTNo tLikelyBodyPart 0.949 0.962 0.967 0.882
Data: Applies the single claim loss limitation at $500K
Notes: Injury Type Category = Injury Type + Body Part category + Claim Status at 1st : s e i r o g e t a C t r a P y d o B :
s e p y T y r u j n I
t r a p y d o b y l e k il t o N = N l
a t a F = a F
PT = Permanent Total L = Likely body part PP = Permanent Partial
TT = Temporary Total Claim Status: Mo = Medical Only C = Closed at 1st
O = Open at 1st O = Open at 1st
Class Ratemaking for Workers Compensation: New Developments in Loss Development
• Those claims which moved into the fatal and PT injury types after initially being reported as another injury type at first report
• Those claims which migrated out of the injury type at later reports after initially being reported as fatal and PT at first report.
“crossover” complicates the analysis, three subgroups of fatal and PT claims were created and the LDF observed (Figures 8c and 8d):
• Those claims which remained within the injury type across all report levels
Analysis of Development Grouping Combinations:
Loss Development 1st to x report (1:x) -- Limited Incurred Losses Claims Locked at 1st
Ind Ind Med Med
Devel. 1999 2000 1999 2000
Proposals Category Injury Type Categories Included 1:6 1:5 1:6 1:5
9 2 2 . 1 1 2 2 . 1 4 4 4 . 1 3 4 4 . 1 L T T + L P P + T P + a F y l e k i L l a n i g ir O 6 0 1 . 1 5 0 1 . 1 4 5 4 . 1 9 5 4 . 1 r e h t O l l A y l e k i L t o N 3 5 2 . 1 2 4 2 . 1 4 0 5 . 1 0 0 5 . 1 O L T T + O L P P + T P + a F y l e k i L 1 t p O 6 0 1 . 1 7 0 1 . 1 2 0 4 . 1 9 0 4 . 1 r e h t O l l A y l e k i L t o N
Opt 2 Likely Fa -Fa1 + PT + PPLO + TTLO 1.556 1.561 1.247 1.258
5 0 1 . 1 5 0 1 . 1 9 6 3 . 1 5 7 3 . 1 r e h t O l l A y l e k i L t o N
Claims Not Locked
-- Includes Injury Type Crossover and Arisings on Subs
Ind Ind Med Med
Devel. 1999 2000 1999 2000
Proposals Category Injury Type Categories Included 1:6 1:5 1:6 1:5
4 8 3 . 1 4 9 3 . 1 8 7 6 . 1 4 9 6 . 1 L T T + L P P + T P + a F y l e k i L l a n i g ir O 6 0 1 . 1 6 9 0 . 1 6 2 4 . 1 1 1 4 . 1 r e h t O l l A y l e k i L t o N 9 1 4 . 1 6 2 4 . 1 7 5 7 . 1 1 7 7 . 1 O L T T + O L P P + T P + a F y l e k i L 1 t p O 8 1 1 . 1 3 1 1 . 1 2 0 4 . 1 4 9 3 . 1 r e h t O l l A y l e k i L t o N
Opt 2 Likely Fa -Fa1 + PT + PPLO + TTLO 1.832 1.826 1.426 1.421
9 1 1 . 1 4 1 1 . 1 7 7 3 . 1 5 7 3 . 1 r e h t O l l A y l e k i L t o N
Notes: Injury Type Category = Injury Type + Body Part category + Claim Status at 1st
: s e ir o g e t a C t r a P y d o B : s e p y T y r u j n I t r a p y d o b y l e k il t o N = N l a t a F = a F
PT = Permanent Total L = Likely body part PP = Permanent Partial
TT = Temporary Total Claim Status: t s 1 t a d e s o l C = C y l n O l a c i d e M = o M
O = Open at 1st Fa1 = Fatal at 1st
LO = Likely body part, open at 1st
Data: Applies the single claim loss limitation at $500K Arising means claims emerging after first report.
FATAL PY 1999
Category
at 1st Category at 6th
Ind+Med Losses at 1st
Ind+Med Losses at 6th
Loss Development
$$
Injury Type Development
Claims that stay within Injury Type
FaLO FaL 172,831,898 149,614,886 -23,217,012 -23,217,012 FaLC FaL 18,522,409 19,393,256 870,847 870,847 FaNO FaN 11,940,325 11,054,696 -885,629 -885,629 FaNC FaN 1,101,646 1,140,701 39,055 39,055
Total: Fa to Fa 204,396,278 181,203,539 -23,192,739 -23,192,739
Claims which move into Injury Type
PTLO FaL 5,948,628 5,110,187 -838,441 5,110,187 TTLO FaL 12,678,675 16,950,679 4,272,004 16,950,679 MoLO FaL 213,376 1,369,657 1,156,281 1,369,657 PPLO FaL 13,519,287 15,965,816 2,446,529 15,965,816 1 2 4 , 3 8 5 , 2 1 1 2 4 , 3 8 5 , 2 1 1 2 4 , 3 8 5 , 2 1 0 L a F -4 9 0 , 6 6 3 , 1 4 9 0 , 6 6 3 , 1 4 9 0 , 6 6 3 , 1 0 N a F
-TTLC FaL 339,998 520,788 180,790 520,788 1 8 8 , 9 7 9 9 2 9 , 5 5 9 1 8 8 , 9 7 9 2 5 9 , 3 2 L a F C L o M
PPLC FaL 265,121 226,770 -38,351 226,770 TTNO FaN 1,265,655 1,498,696 233,041 1,498,696 MoNO FaN 30,028 938,698 908,670 938,698 PPNO FaN 1,321,388 2,025,430 704,042 2,025,430 TTNC FaN 37,411 55,284 17,873 55,284 2 8 5 , 8 3 0 6 8 , 1 3 2 8 5 , 8 3 2 2 7 , 6 N a F C N o M
PPNC FaN 53,961 71,656 17,695 71,656
Total: Other Types to Fa 35,704,202 59,701,639 23,997,437 59,701,639
Other LO to Fa 32,359,966 39,396,339 7,036,373 39,396,339 5 1 5 , 9 4 9 , 3 1 5 1 5 , 9 4 9 , 3 1 5 1 5 , 9 4 9 , 3 1 0 a F o t g n i s ir A
All other to Fa 3,344,236 6,355,785 3,011,549 6,355,785
Claims which move out of Injury Type
FaLO PTL 597,761 954,391 356,630 -597,761 FaLO TTL 3,373,971 3,034,733 -339,238 -3,373,971 FaLO MoL 254,232 32,821 -221,411 -254,232 FaLO PPL 208,664 205,713 -2,951 -208,664 8 8 8 , 2 -0 8 8 8 , 2 8 8 8 , 2 L T P C L a F 8 6 1 , 3 3 -7 9 3 , 5 2 5 6 5 , 8 5 8 6 1 , 3 3 L T T C L a F
FaLC MoL 21,257 1,255 -20,002 -21,257 FaNO TTN 383,884 403,289 19,405 -383,884 0 0 5 , 6 -0 0 5 , 6 -0 0 0 5 , 6 N o M O N a F
FaNO PPN 183,853 155,381 -28,472 -183,853 FaNC TTN 18,617 22,089 3,472 -18,617 0 5 6 , 5 -4 1 7 , 2 4 6 3 , 8 0 5 6 , 5 N P P C N a F
Total: Fa to Other Types 5,090,445 4,879,489 -210,956 -5,090,445
Injury Type Development: Claims "Locked Down"
204,396,278 181,203,539
5,090,445 4,879,489 Difference LDF Total 209,486,723 186,083,028 -23,403,695 0.888
Injury Type Development: Allow Cross Over
204,396,278 181,203,539
5,090,445 59,701,639 Difference LDF Total 209,486,723 240,905,178 31,418,454 1.150
Notes: Injury Type Category = Injury Type + Body Part category + Claim Status at 1st
Injury Types: Body Part Categories: t r a p y d o b y l e k il t o N = N l a t a F = a F
PT = Permanent Total L = Likely body part PP = Permanent Partial
TT = Temporary Total Claim Status: Mo = Medical Only C = Closed at 1st
O = Open at 1st LO = Likely body part, open at 1st
Data: Applies the single claim loss limitation at $500K
Arising means claims emerging for the first time beyond first report.
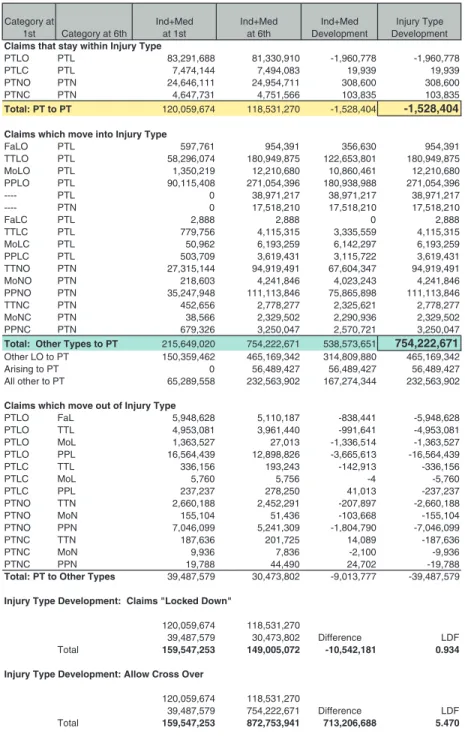
PERMANENT TOTAL PY 1999
Category at
1st Category at 6th
Ind+Med at 1st Ind+Med at 6th Ind+Med Development Injury Type Development
Claims that stay within Injury Type
PTLO PTL 83,291,688 81,330,910 -1,960,778 -1,960,778 9 3 9 , 9 1 9 3 9 , 9 1 3 8 0 , 4 9 4 , 7 4 4 1 , 4 7 4 , 7 L T P C L T P
PTNO PTN 24,646,111 24,954,711 308,600 308,600 5 3 8 , 3 0 1 5 3 8 , 3 0 1 6 6 5 , 1 5 7 , 4 1 3 7 , 7 4 6 , 4 N T P C N T P
Total: PT to PT 120,059,674 118,531,270 -1,528,404 -1,528,404
Claims which move into Injury Type
1 9 3 , 4 5 9 0 3 6 , 6 5 3 1 9 3 , 4 5 9 1 6 7 , 7 9 5 L T P O L a F
TTLO PTL 58,296,074 180,949,875 122,653,801 180,949,875 0 8 6 , 0 1 2 , 2 1 1 6 4 , 0 6 8 , 0 1 0 8 6 , 0 1 2 , 2 1 9 1 2 , 0 5 3 , 1 L T P O L o M
PPLO PTL 90,115,408 271,054,396 180,938,988 271,054,396 7 1 2 , 1 7 9 , 8 3 7 1 2 , 1 7 9 , 8 3 7 1 2 , 1 7 9 , 8 3 0 L T P -0 1 2 , 8 1 5 , 7 1 0 1 2 , 8 1 5 , 7 1 0 1 2 , 8 1 5 , 7 1 0 N T P -8 8 8 , 2 0 8 8 8 , 2 8 8 8 , 2 L T P C L a F 5 1 3 , 5 1 1 , 4 9 5 5 , 5 3 3 , 3 5 1 3 , 5 1 1 , 4 6 5 7 , 9 7 7 L T P C L T T 9 5 2 , 3 9 1 , 6 7 9 2 , 2 4 1 , 6 9 5 2 , 3 9 1 , 6 2 6 9 , 0 5 L T P C L o M 1 3 4 , 9 1 6 , 3 2 2 7 , 5 1 1 , 3 1 3 4 , 9 1 6 , 3 9 0 7 , 3 0 5 L T P C L P P
TTNO PTN 27,315,144 94,919,491 67,604,347 94,919,491 6 4 8 , 1 4 2 , 4 3 4 2 , 3 2 0 , 4 6 4 8 , 1 4 2 , 4 3 0 6 , 8 1 2 N T P O N o M
PPNO PTN 35,247,948 111,113,846 75,865,898 111,113,846 7 7 2 , 8 7 7 , 2 1 2 6 , 5 2 3 , 2 7 7 2 , 8 7 7 , 2 6 5 6 , 2 5 4 N T P C N T T 2 0 5 , 9 2 3 , 2 6 3 9 , 0 9 2 , 2 2 0 5 , 9 2 3 , 2 6 6 5 , 8 3 N T P C N o M 7 4 0 , 0 5 2 , 3 1 2 7 , 0 7 5 , 2 7 4 0 , 0 5 2 , 3 6 2 3 , 9 7 6 N T P C N P P
Total: Other Types to PT 215,649,020 754,222,671 538,573,651 754,222,671
Other LO to PT 150,359,462 465,169,342 314,809,880 465,169,342 7 2 4 , 9 8 4 , 6 5 7 2 4 , 9 8 4 , 6 5 7 2 4 , 9 8 4 , 6 5 0 T P o t g n i s ir A 2 0 9 , 3 6 5 , 2 3 2 4 4 3 , 4 7 2 , 7 6 1 2 0 9 , 3 6 5 , 2 3 2 8 5 5 , 9 8 2 , 5 6 T P o t r e h t o l l A
Claims which move out of Injury Type
8 2 6 , 8 4 9 , 5 -1 4 4 , 8 3 8 -7 8 1 , 0 1 1 , 5 8 2 6 , 8 4 9 , 5 L a F O L T P 1 8 0 , 3 5 9 , 4 -1 4 6 , 1 9 9 -0 4 4 , 1 6 9 , 3 1 8 0 , 3 5 9 , 4 L T T O L T P 7 2 5 , 3 6 3 , 1 -4 1 5 , 6 3 3 , 1 -3 1 0 , 7 2 7 2 5 , 3 6 3 , 1 L o M O L T P
PTLO PPL 16,564,439 12,898,826 -3,665,613 -16,564,439 6 5 1 , 6 3 3 -3 1 9 , 2 4 1 -3 4 2 , 3 9 1 6 5 1 , 6 3 3 L T T C L T P 0 6 7 , 5 -4 -6 5 7 , 5 0 6 7 , 5 L o M C L T P 7 3 2 , 7 3 2 -3 1 0 , 1 4 0 5 2 , 8 7 2 7 3 2 , 7 3 2 L P P C L T P 8 8 1 , 0 6 6 , 2 -7 9 8 , 7 0 2 -1 9 2 , 2 5 4 , 2 8 8 1 , 0 6 6 , 2 N T T O N T P 4 0 1 , 5 5 1 -8 6 6 , 3 0 1 -6 3 4 , 1 5 4 0 1 , 5 5 1 N o M O N T P
PTNO PPN 7,046,099 5,241,309 -1,804,790 -7,046,099 6 3 6 , 7 8 1 -9 8 0 , 4 1 5 2 7 , 1 0 2 6 3 6 , 7 8 1 N T T C N T P 6 3 9 , 9 -0 0 1 , 2 -6 3 8 , 7 6 3 9 , 9 N o M C N T P 8 8 7 , 9 1 -2 0 7 , 4 2 0 9 4 , 4 4 8 8 7 , 9 1 N P P C N T P
Total: PT to Other Types 39,487,579 30,473,802 -9,013,777 -39,487,579
Injury Type Development: Claims "Locked Down"
120,059,674 118,531,270
39,487,579 30,473,802 Difference LDF Total 159,547,253 149,005,072 -10,542,181 0.934
Injury Type Development: Allow Cross Over
120,059,674 118,531,270
39,487,579 754,222,671 Difference LDF Total 159,547,253 872,753,941 713,206,688 5.470
Notes: Injury Type Category = Injury Type + Body Part category + Claim Status at 1st
: s e ir o g e t a C t r a P y d o B : s e p y T y r u j n I t r a p y d o b y l e k il t o N = N l a t a F = a F
PT = Permanent Total L = Likely body part PP = Permanent Partial
TT = Temporary Total Claim Status: Mo = Medical Only C = Closed at 1st
O = Open at 1st LO = Likely body part, open at 1st
Data: Applies the single claim loss limitation at $500K
Arising means claims emerging for the first time beyond first report.
Variance Advancing the Science of Risk
only likely-to-develop, open claims for PP and TT. The equation is:
L Fatal Fatal= − @1st PT PPLO TTLO.+ + + ( . )2 5
Finally, NCCI decided to keep all medical-only (MO) claims in the N grouping for two reasons: (a) less than 1% of all MO losses would shift to likely, and (b) some carriers report their entire inven-tory of MO claims as closed claims when reporting WCSP data to NCCI, which would be problematic.
2.5.5. The class ratemaking tail factor: Prior methodology
The tail factor in workers compensation presents a formidable challenge to NCCI actuaries. In aggre-gate ratemaking, in order to determine a state’s over-all indicated loss cost/rate level change, a tail factor is estimated separately for indemnity and medical, and then attached currently at a 19th report. NCCI financial call data is used as the source data to a 19th report. However, only five reports of the WCSP data, the source data for class ratemaking, were required to be reported to NCCI by its affiliated carriers.
In the prior NCCI class ratemaking methodology, the financial tail factor was the starting point for the class ratemaking tail factor. NCCI assumed that 100% of loss development beyond the fifth report was due to development on serious claims, and 0% due to development on non-serious claims. Figure 2 shows how a class fifth—ultimate LDF was com-puted from the state financial data fifth—ultimate LDF, referred to below as Fin5U. The following formula was used for indemnity losses to determine the class ratemaking fifth—ultimate LDF, referred to as Class 5UI. It was applied to serious losses at fifth report.
Class 5U
SER$ SER$ NS$
Fin5U
I
I I I
I =
+
(
+)
∗
(
−1 000.)
SER$I
( . )2 6
where
Class 5UI= Unlimited fifth–ultimate indemnity (I) tail factor applied to serious losses at Three observations follow from these injury type
“crossover” analyses.
First observation: Fatal claims at sixth report, which were reported initially as a fatality at first report, distinctly developed downward from first through sixth report (see top section of Figure 8c).
Conclusion #1: Move fatal claims at first report into the N grouping, and no longer assign them as likely-to-develop.
Reasoning: There is no need for carriers to esti-mate medical case reserves since the injured worker has died. The dependents receive indemnity benefits, defined as streams of payments over time in most states, and in a few states they also receive a pre-determined burial allowance.
Second observation: Claims which become fatali-ties at subsequent reports (second through sixth) developed significantly upward by about $60M after first report (see middle section of Figure 8c).
Conclusion #2: Claims which become fatalities at second and subsequent reports will be catego-rized in the L grouping.
Reasoning: A claimant’s condition deteriorates to the point where the injured worker dies, and fatal benefits are paid out. Large amounts of upward loss development dollars are observed, and it is often in the medical component.
Figure 8b, Option 2 demonstrates that a greater differentiation in LDF magnitude occurs, particularly for indemnity, when the fatal claims at first report were removed from the L grouping and placed in the N grouping. This is seen by comparing Option 2 to the groupings labeled ‘Original’ and ‘Option 1’ in the rows above it.
Conclusion #3: Categorize all PT claims into the L grouping for all reports.
Reasoning: Many PT claims were initially reported as another injury type, and conditions deteriorated to the point where the injured worker became perma-nently totally disabled. On Figure 8d, large amounts of upward loss development are observed.
Class Ratemaking for Workers Compensation: New Developments in Loss Development
applied to the L grouping dollars of loss. This allows a portion of tail development to be applied to the not-likely-to-develop losses. Thus, two new class rate-making tail factors are applied at the tth report, one for L and one for N.
The new methodology tail factor formulas may be written in a general form to account for the various tail attachment points and the new assumptions as follows:
Class tU
L$ y L$ N$
Fin tU 1.0
L,I
I I I
I =
+ −
(
)
∗(
+)
∗ −
1
000 L$I
(
)
, ( . )2 8
and
Class tU
N$ y L$ N$
Fin tU 1.000
N,I
I I I
I =
+ ∗
(
+)
∗
(
−)
N$I
( . )2 9
where,
t = time t representing the report level of WCSP data at which the attachment point for the class ratemaking tail is applied, t = 5, . . . . , 10;
L$I= two latest years of limited (at $500K) likely-to-develop “paid+case” indem-nity loss dollars on-leveled and devel-oped to tth report for the state;
N$I= two latest years of limited (at $500K) not-likely-to-develop “paid+case” indemnity loss dollars on-leveled and developed to tth report for the state;
Class tUL,I=a likely-to-develop tth–ultimate in demnity (I) tail factor applied to likely-to-develop losses at tth report for each class code. It is limited at aggregate state threshold T;
Class tUN,I= a not-likely-to-develop tth–ultimate indemnity (I) tail factor applied to not-likely-to-develop losses at tth report for each class code. It is limited at aggregate state threshold T.
Fin tUI= limited (at T) aggregate statewide financial data tth–ultimate LDF for indemnity (I); and
fifth report. No tail is applied to non-serious losses;
Fin 5UI= Unlimited statewide financial data fifth– ultimate LDF for indemnity (I); and
SER$I= two years of unlimited “paid+case” serious indemnity loss dollars on- leveled and developed to fifth report for the state.
NS$I= two years of unlimited “paid+case” nserious indemnity loss dollars on-leveled and developed to fifth report for the state
The same approach was also used to determine a fifth—ultimate tail factor for medical losses, but is not shown here. Only the subscript would change from (I) to (M).
By rearranging the formula, the following is derived:
Class 5U Fin 5U NS$ SER$
Fin 5U
I I
I I
I
= +
(
)
∗
((
−1 000.)
. ( . )2 7
Formula (2.7) illustrates that the prior class tail fac-tor was highly leveraged to the relative share of non-serious to non-serious loss dollars as determined by the critical value. The lower the statewide share of serious losses, the higher the prior class rate making tail fac-tor became. By eliminating the critical value, and thus the serious and non-serious distinction, the new class ratemaking loss development method ology reduces this highly leveraged tail factor phenomenon.
2.5.6. The class ratemaking tail factor: New methodology
Variance Advancing the Science of Risk
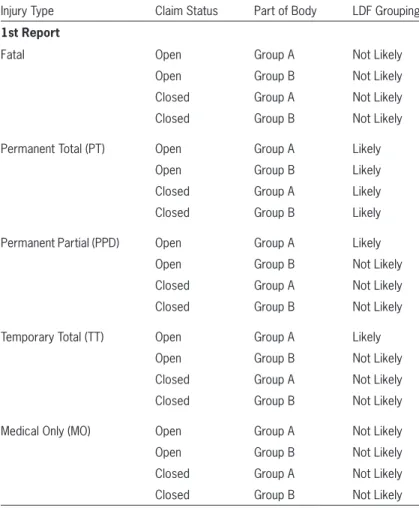
This assignment is a function of three claim charac-teristics: (1) injury type, (2) part of body, and (3) claim status (open vs. closed). NCCI also modified the loss development methodology from fifth-ultimate. Table 1 summarizes the combinations of claim characteristics used to assign claims to their appropriate groups. It introduces the terminology Part of Body (POB) Group A and Group B to refer to the mapping of body parts to the likely-to-develop (L) and the not-likely- to-develop groupings (N), respectively. Group A con-sists of claims having a greater potential to develop upward over time such as injuries to the back, head, lungs, heart, shoulders, trunk, and multiple body parts. Group B consists of the others.
Table 1 illustrates the claim status (open vs. closed) and body part, each evaluated at first report, which is used for the purpose of determining the development category. Not all claims are “locked in” their devel-opment grouping, however. At subsequent reports (second through tenth), changes in injury type are monitored for the purpose of potentially reassigning a few claims to a different development grouping.
For claims in which there is no first report, but that are reported at second report or subsequent, they will be assumed to be open at first report for the pur-pose of development category assignment. The body part and claim status are based upon the initial report submitted to NCCI, while the injury type is monitored at all reports for appropriate grouping determination.
The new loss development methodology will signif-icantly reduce, but not completely eliminate, instances of crossover from one development grouping to the other. The following list provides common examples of how crossover may occur under the new methodol-ogy in certain injury types:
• Medical Only (MO)—MO claims in POB Group A, open at first report, which migrate to another injury type at a later report, will move from N to L. • Temporary Total (TT) or Permanent Partial (PP)—
Crossover can occur on TT or PP claims, originally categorized in the N grouping, which evolve into a PT or fatality at a later report.
y = percentage between 0% and 100% used to allocate a portion of tail devel-opment dollars to the not-likely-to-develop grouping.
Note all claims are limited at $500K at all report levels up to the tail attachment point under the new methodology. The Fin 5Ui LDF were unlimited under the prior methodology, but are capped at the state aggregate threshold T under the new methodology. The same approach is used to determine a tth— ultimate tail factor for medical losses, but is not shown here. Only the subscript would change from (I) to (M) within the formulas above.
Based on research observing actual WCSP loss development patterns through seventh report, NCCI is initially using a value of 20% for y for both indem-nity and medical for all tail attachment points out to tenth report. Thus, 80% of the total dollars of tail development will be assigned to the likely-to-develop loss triangle, and 20% of the dollars assigned to the not-likely triangle.
From an analysis of several states, the pro-rata loss share for L and N is much closer to 50% each than was the share of losses for serious and non-serious. This reduces the leverage on the class tail factor and produces more tail stability from year to year.
The tail factor is an area that warrants continued research. Possible future enhancements are that y could vary between indemnity and medical or y could vary as the tail attachment moves out toward tenth report. For example, at fifth report, y may be a higher percentage than what y would be at tenth report.
2.5.7. Summary of the new loss development proposal
Under NCCI’s new loss development methodol-ogy, claim dollars are assigned to one of the follow-ing four development categories for each state:
Class Ratemaking for Workers Compensation: New Developments in Loss Development
The use of injured body part in conjunction with the open and closed claim status is a logical combina-tion that most regulators, actuaries, and non-actuaries should readily understand.
The only disadvantage the new methodology has is that as claims evolve over time and change injury types, a small amount of dollar crossover from one grouping to another occurs. Certain changes in the reported injury type for a given claim are a natural progression in workers compensation that NCCI chooses to reflect within the new loss development structure.
2.6. Loss limits, expected excess, and
the new hazard group mapping
The prior class ratemaking methodology limited large claims for a class code at a loss limit equal to five times the state’s serious average cost per case. For NCCI states, these limits ranged from $300,000 Exhibits 2–4 in the Appendix illustrate loss
tri-angles and the class tail calculation using the new loss development methodology.
2.5.8. Advantages and disadvantages of the new loss development groupings
The most important advantage the new loss devel-opment methodology provides is more predictive and stable loss development factors. Expanding the triangles out to tenth report also improves the predic-tive ability. Most crossover has been mitigated due to the elimination of the critical value, and the new data element combination of body part, injury type, and claim status has improved the LDF groupings. Most importantly, class equity improves as the class codes with more head, back, trunk, multiple body, etc. inju-ries will have higher loss costs than class codes with less complex injuries, all else equal. Class loss costs become more equitable.
Table 1. Claim characteristics underlying loss development groupings
Injury Type Claim Status Part of Body LDF Grouping
1st Report
Fatal Open Group A Not Likely Open Group B Not Likely Closed Group A Not Likely Closed Group B Not Likely
Permanent Total (PT) Open Group A Likely Open Group B Likely Closed Group A Likely Closed Group B Likely
Permanent Partial (PPD) Open Group A Likely Open Group B Not Likely Closed Group A Not Likely Closed Group B Not Likely
Temporary Total (TT) Open Group A Likely Open Group B Not Likely Closed Group A Not Likely Closed Group B Not Likely
Variance Advancing the Science of Risk
to exclude the cost of events $50M or greater, the new catastrophic event threshold. For a detailed dis-cussion of the methodology underlying NCCI excess ratios, see Engl and Corro (2006).
The excess ratio, XST, for a given threshold T, T < $50M, is defined as
XS
Expected Excess Losses Between Threshol
T =
dd and $50M Expected Total Losses Below $50
T
M
M ( . )2 10
The ratio of excess losses to total losses is at an ultimate value. In class ratemaking, excess ratios are applied to calculate full value ultimate losses from limited ultimate losses. The threshold T for capping claims in every class code is currently $500,000, uni-form in all states. The actual excess dollars greater than $500,000 are removed from class ratemaking.
The excess ratio applied is on a per-claim basis and varies by state and hazard group. This differs from an excess loss factor as excess loss factors are on a per-occurrence basis, and also may include a provision for expenses.
The adjusted, per-claim excess ratio is applied as a factor, 1/(1 - XS500K), to a class code’s limited (@500K) ultimate losses that have been developed, on-leveled, and trended to the midpoint of the pro-posed filing effective period. Similarly, the excess ratio applied has also been trended to the midpoint of the proposed filing effective period.
NCCI uses five policy periods as the experience period for each class code. For each policy period, the same factor 1/(1 - XS500K) is applied to both indemnity and medical losses, since the size-of-loss distributions for excess ratios are on a combined indemnity and medical basis.
In 2006, NCCI completed an analysis of country-wide excess ratios by class code, and a new mapping of class codes to seven hazard groups was imple-mented (previously there were four). The seven haz-ard groups range from A to G. Class codes having the highest excess ratios were mapped to G, considered the most hazardous classes. Class codes having the lowest excess ratios were mapped to A, considered to about $1.1M during the 2006 filing season. A
multi-claim occurrence was capped at twice the single multi-claim limit. The excess dollars removed from the indi-vidual class codes were distributed to the industry group to which the class code belonged. This was done by deriving an unlimited-to-limited ratio for each industry group within the industry group dif-ferential calculations. Summarizing, the prior class ratemaking methodology limited large claims on a class code level, but unlimited loss dollars were used in deriving loss development factors and industry group differentials.
The most noteworthy changes in the new class ratemaking methodology are:
1. Standardizing the single claim loss limit for class codes to be $500,000 in each state (and the multi-claim occurrence limit is now three times the single claim limit).
2. Basing loss development factors on claims lim-ited at $500,000.
3. Applying a multiplicative factor to estimate the expected losses in excess of $500,000 using ex-cess ratios from the new seven hazard group map-ping (Corro and Engl 2006 and Robertson 2009). 4. Removing the unlimited-to-limited ratio from the
class code conversion factors and from the indus-try group differential calculations, and replacing it with expected excess dollars summed across all class codes within each industry group.
5. Computing the indicated losses within each indus-try group is the sum of the limited ultimate losses and the excess dollars referenced in step (4).
Limited loss amounts for claims above the thresh-old are allocated to indemnity and medical in the proportion that their values contribute to the total unlimited value of the claim.
2.6.1. Application of the excess ratios
Class Ratemaking for Workers Compensation: New Developments in Loss Development
ratio approach, which was based upon five years of actual large loss amounts.
• Excess losses are distributed to class code more equitably via hazard group than industry group.
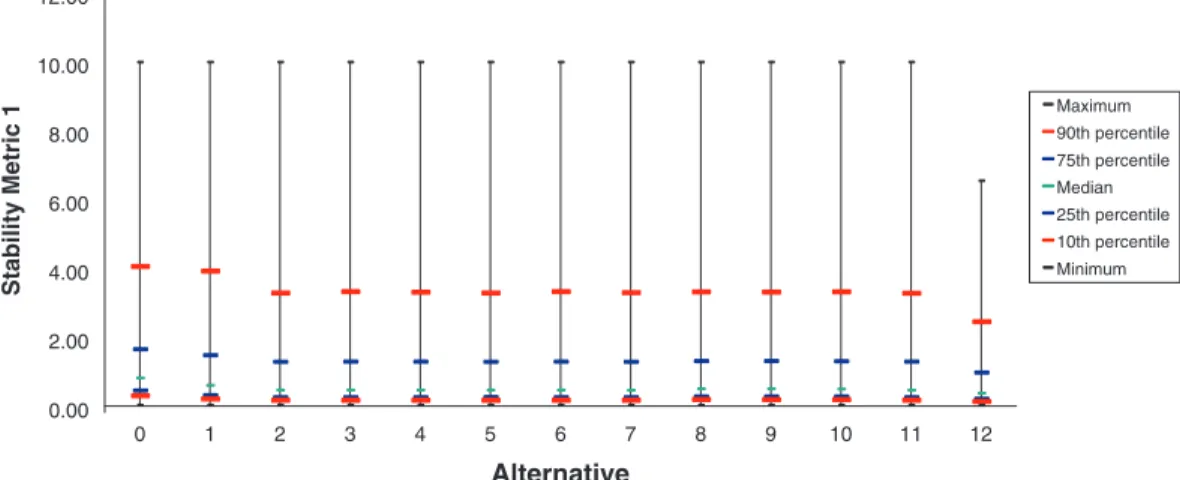
2.6.2. Simulation and expected excess Results from 16 different potential capping and excess-spreading alternatives were explored using a Monte Carlo simulation technique. Figure 9 illus-trates all of the options considered and analyzed. the least hazardous classes. See Robertson (2009) for
more detail.
Excess ratios for all seven hazard groups are updated annually for every state. The allocation of expected excess dollars to class codes by hazard group is an excellent refinement in the new class ratemaking because
• Expected excess provisions are more stable from year to year than the prior unlimited-to-limited
Alt k = Class Loss Limit Using Actual Excess 0 Unlimited
1 $1M Allocates Actual IG Excess Uniformly by Class Within the IG
2 $300k Allocates Actual IG Excess Uniformly by Class Within the IG
3 $300k Allocates Actual HG Excess Uniformly by Class Within the HG
4 $300k Same as k=3 with factor to balance to IG Unlimited Losses
5 $300k Allocates Actual IG Excess by Class Within IG Using Limited Losses x [XS / (1-XS)]
6 $300k Allocates HG Actual Excess by Class Within HG Using Limited Losses x [XS / (1-XS)]
7 $300k Allocates Actual State Excess by Class Using Limited Losses x [XS / (1-XS)]
Alt k = Limit Using Actual Excess
8 $300k Allocates Actual IG Excess by Class Within IG Using Unlimited Losses x XS
9 $300k Allocates Actual HG Excess by Class Within HG Using Unlimited Losses x XS
10 $300k Allocates Actual State Excess by Class Using Unlimited Losses x XS
13
Vary by Class* $100k, $300k,
$1M Allocates Actual State Excess by Class Using Unlimited Losses x XS
Alt k = Limit Using Expected Excess
11 $300k Limited Actual Losses x 1 / (1- XS)
12 $300k Limited Losses + [XS x Unlimited Expected Losses (i.e. Mu)]
14
Vary by Class* $100k, $300k,
$1M Limited Actual Losses x 1 / (1- XS)
15
Vary by Class* $100k, $300k,
$1M Limited Losses + [XS x Unlimited Expected Losses (i.e. Mu)] Legend: IG - Industry Group
HG - Hazard Group
* Alts 13 - 15 proposed three loss limits: $100K for small classes, $300K for medium classes & $1M for large classes.
XS - per claim adjusted excess ratio at class loss limit; 0 <= XS <= 1.0; XS varies by HG and limit
Note: Alt 3 and Alt 6 are equivalent
Figure 9. Alternatives for limiting losses and allocating excess. Certain
Variance Advancing the Science of Risk
µ = hypothetical mean mu, the expected losses for a class code based on simulated frequency and actual severity times actual class pay-roll for that state, and
L–(k) = the average losses for a specific class code
over N simulations for alternative k.
Mathematically, it equals:
Lk L N
n k
n N
( ) ( )
=
=
( )
∑
1
2 12 ( . )
Adequacy Metric 2: Desired range [0, +0.50]
= ( )−
=
∑
Ln u uk
n N
100 2 13
1
( . )
This metric differs from the first in that the high and low values cannot cancel out due to the absolute value.
Stability Metric 1: Desired range [0, +0.10]
CV
L
c k
n c k ()
() =
=
standard deviation
mean ( . )
,
2 14
−−
(
())
=()
∑
LN L
c k
n N
c k
2
1
where
CVc(k) = the coefficient of variation for class code c
under alternative k,
L(k)
n,c = 5 years of simulated losses for the nth trial
for class c whereby the losses were capped as in alternative k, and
L–(k)
c = average of simulated losses for alternative
k over all simulations.
Stability metric 1 is the coefficient of variation for a specific class under the conditions of alternative k.
Stability Metric 2: Desired range [0, +0.50]
L L u N N
n c k
m c k
c n m
, ,
,
( . )
() − ()
−
(
)
∑
1 2 15
The simulation approach of testing the alternatives was completed as follows:
1. Five years of simulated losses were produced for every class code in two large states and two small states.
2. The claim counts were based on actual national incidence rates for the class code. A Poisson dis-tribution was assumed with lambda equal to the national incidence rate by injury type multiplied by the actual payroll for the class in each state. 3. The excess loss distributions by injury type by
state (Corro and Engl 2006) were used for deter-mining the average cost per case. In deterdeter-mining the state distributions, each class was scaled to the state’s average cost per case adjusted for hazard group.
4. One hundred different simulation trials by class code were produced. Each simulation generates five years of unlimited loss data for the given class. 5. The simulated claims’ loss data was then modi-fied by the specific capping and excess spread-ing alternative in Figure 9 to provide modified expected unlimited losses.
6. The performance of each alternative was assessed using four metrics. Two of the metrics measured loss cost adequacy and two measured loss cost stability across the 100 simulation trials.
The following four metrics were used to assess the success of the various alternatives for limiting claims and allocating the excess loss.
Adequacy Metric 1: Desired range [-0.25, +0.25]
L( )k − µ
µ ( . )2 11
where
Ln = 5 years of simulated losses for the nth trial whereby n = [1, 2, . . . . , 100],
Ln(k) = 5 years of simulated losses for the nth trial