Payments in Lieu of Taxes by Nonprofits:
Which Nonprofits Make PILOTs and Which Localities Receive Them
Adam H. Langley, Daphne A. Kenyon, and Patricia C. Bailin
© 2012 Lincoln Institute of Land Policy
Lincoln Institute of Land Policy Working Paper
The findings and conclusions of this Working Paper reflect the views of the author(s) and have not been subject to a detailed review by the staff of the
Lincoln Institute of Land Policy.
Contact the Lincoln Institute with questions or requests for permission to reprint this paper. help@lincolninst.edu
Abstract
This report provides more information than was previously available in any single source on the individual nonprofits that make payments in lieu of taxes (PILOTs) and the localities which receive them. PILOTs are voluntary payments made by tax-exempt private nonprofits as a substitute for property taxes.
While the term PILOT can refer to many different types of payments, this report imposes a consistent definition that excludes any payments from for-profit companies or public entities (e.g., housing authorities) and any payments from nonprofits that are not voluntary, such as fees. Data came from a 2011 survey of local government officials in 599 jurisdictions with the largest nonprofit sectors and a three-year data collection project. Key findings from the study are:
• PILOTs have been received by at least 218 localities in at least 28 states since 2000; these
payments are collectively worth more than $92 million per year. This is a much greater number of PILOTs than identified in previous studies, with the increase due to a more expansive methodology.
• Although more than 90 percent of all PILOT revenue comes from “eds and meds”—
college payments are far more important than hospital payments with colleges contributing about two-thirds of PILOT payments and hospitals another quarter.
• Many other types of nonprofits also make PILOTs even if their contributions are
generally small. This report identifies nonprofits that make PILOTs of these types: housing (47), religious organizations including churches (36), social services (15), and arts/culture (11).
• The Northeast accounts for roughly 75 to 80 percent of PILOT activity, with the largest
share in Massachusetts and Pennsylvania.
• Most nonprofits make fairly small PILOTs while most revenue generated comes from a
small number of multi-million dollar PILOTs. As a result, the average PILOT for all nonprofits ($292,952) is nearly 10 times larger than the median ($30,000).
• While at least 420 nonprofits make PILOTs, the majority of revenue comes from just 10
organizations: Harvard University, Yale University, Stanford University, Brown University, Boston University, Massachusetts General Hospital, Dartmouth College, Brigham & Women’s Center, Massachusetts Institute of Technology, and Princeton University (in order of payments, beginning with the highest).
• PILOTs generate little revenue in most localities—accounting for less than 1 percent of
total general revenue in 165 out of 181 localities that have information available.
• Localities use a variety of methods to receive PILOTs; the most common are long-term
contracts (used by 58 percent of localities) and routine annual payments (34 percent).
• Most PILOTs go to cities and towns, but at least seven school districts and four counties
About the Authors
Adam H. Langley is a research analyst in the Department of Valuation and Taxation at the Lincoln Institute of Land Policy, where his research has covered nonprofit payments in lieu of taxes, property tax relief programs, property tax incentives for business, and other issues in state and local public finance. He earned a B.A. in political studies from Bard College and an M.A. in economics from Boston University. He previously worked in the New York State Assembly. ALangley@lincolninst.edu
617-503-2117 (phone); 617-661-7235 (fax) Lincoln Institute of Land Policy
113 Brattle Street Cambridge, MA 02138
Daphne A. Kenyon is a visiting fellow in the Lincoln Institute’s Department of Valuation and Taxation and principal of D. A. Kenyon & Associates, Windham, New Hampshire. She has worked on a wide range of public finance issues as professor of economics at Dartmouth College and Simmons College, as a policy analyst for the U.S. Department of Treasury and the Urban Institute, and as a consultant. She earned her B.A. in Economics from Michigan State University and her M.A. and Ph.D. in Economics from the University of Michigan.
DKenyon@lincolininst.edu 617-503-2125
Patricia C. Bailin worked as a program and research assistant in the Department of Valuation and Taxation at the Lincoln Institute of Land Policy. She earned her B.A. in International
Relations from Wellesley College and is now pursuing an M.A. in Law and Diplomacy from the Fletcher School at Tufts University. She previously worked at the U.S. Department of the Treasury.
Acknowledgements
Special thanks go to Bethany Paquin who helped collect information on PILOTs and provided valuable feedback on this report. We greatly appreciate the information provided by 171 local government officials who responded to our survey on PILOTs, as well as assistance from local government officials and public finance experts in cities with the largest nonprofit sectors noted
Table of Contents
Introduction ...1
An Overview of PILOTs ...2
PILOTs by Region ...2
PILOTs by Type of Nonprofit and the Range of PILOT Contributions ...3
The Largest PILOTs ...5
Revenue Productivity of PILOTs ...6
Methods Used for PILOTs ...7
Types of Governments that Receive PILOTs ...8
PILOTs in Cities with the Largest Nonprofit Sectors ...9
Data Collection ...9
Survey of Jurisdictions with Large Nonprofit Sectors ...9
Other Sources for Information on PILOTs ...11
Estimating the Use of PILOTs Nationally ...12
Years for Data on PILOTs in this Report ...12
A Consistent Definition of PILOTs ...13
Conclusion ...15
References ...16
Appendix ...18
Survey Questionnaire on Payments in Lieu of Taxes Made by Nonprofits ...18
Table 1: Notes for PILOTs Identified in Sources Other than the Survey ...20
Table 2: Notes for Cities with Largest Nonprofit Sectors that do not Receive PILOTs ...30
Table 3: PILOT Activity by State ...33
Table 4: PILOTs for Individual Localities ...34
Payments in Lieu of Taxes by Nonprofits
Introduction
In recent years, local government fiscal pressures and other factors have led many localities to consider ways to raise revenue from tax-exempt nonprofits, including payments in lieu of taxes (PILOTs). This report defines PILOTs as voluntary payments made by tax-exempt private nonprofits as a substitute for property taxes. While this new research identifies a much greater number of PILOTs than previous sources and anecdotal evidence suggests that these payments may be growing in popularity, it is not possible to definitively confirm an increasing trend because there is no source that tracks the use of PILOTs over time.
This report builds on several previous studies that attempted to measure the use of PILOTs across the United States. The first of these studies was based on a 1998 survey of municipal finance directors and key community leaders in 73 large cities across the United States, which identified PILOTs in seven cities in six states (Leland 2002). Salamon, Geller, and Sokolowksi (2011) surveyed four types of nonprofits (children and family services, elderly housing and services, community and economic development, and arts and culture), and found that 9 percent of their 358 respondents made PILOTs.
In a previous work, we concluded that since 2000 at least 117 municipalities in at least 18 states have employed PILOTs (Kenyon and Langley 2010). This new report identifies a far greater number of PILOTs over a similar time period, with PILOTs received by 218 localities in 28 states. It is important to note that the large increase in documented PILOT activity is mainly due to using a more expansive methodology; it should not be taken as evidence that the use of PILOTs approximately doubled between 2010 and 2012.
Both of these studies use comprehensive data collection efforts, including literature reviews and Google alerts for search terms related to PILOTs to compile information on these payments in place since 2000. However, this report augmented these ad hoc data collection efforts with a survey of 599 cities and towns with the largest nonprofit sectors that received 171 responses. In addition, this study started with the same list of municipalities used in our earlier study and so extending the data collection project for another 18 months inevitably increased the number of PILOTs identified. It is difficult to collect complete information on PILOTs for a variety of reasons, as described in the section on estimating the use of PILOTs nationally, which is why the previous report concluded that at least 117 municipalities received PILOTs. Finally, it is likely that the level of PILOT activity truly has increased over the past two years, although it is very unlikely that it doubled.
The next section of this report provides statistics on the use of nonprofit payments in lieu of taxes in the United States. The following section provides details on the data collection process and uses examples to illustrate the difficulty of using a consistent definition of PILOTs given that the term refers to many different types of payments. The appendix includes tables that list information on PILOTs for all localities that have received these payments and all nonprofits that make them.
An Overview of PILOTs PILOTs by Region
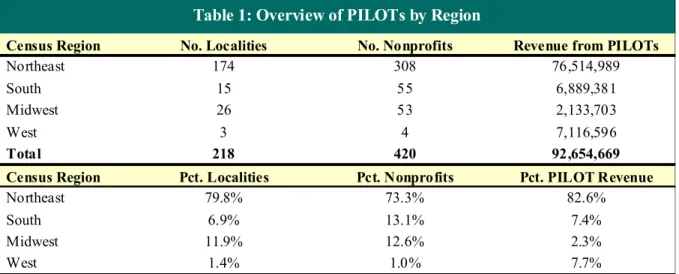
Table 1 provides an overview of PILOTs by region. The great majority of PILOT activity is in the Northeast, with this region accounting for 80 percent of the localities that receive PILOTs, 73 percent of the nonprofits that make payments, and 83 percent of the revenue generated from PILOTs. Appendix Table 3 shows more than half of all reported PILOT activity occurs in Massachusetts and Pennsylvania. It is also worth noting that Baltimore accounts for nearly 80 percent of PILOT revenue in the South, and Palo Alto accounts for nearly all PILOT revenue in the West.1 If not for those two cities, more than 95 percent of the revenue generated from PILOTs would accrue to localities in the Northeast.
Census Region No. Localities No. Nonprofits Revenue from PILOTs
Northeast 174 308 76,514,989
South 15 55 6,889,381
Midwest 26 53 2,133,703
West 3 4 7,116,596
Total 218 420 92,654,669
Census Region Pct. Localities Pct. Nonprofits Pct. PILOT Revenue
Northeast 79.8% 73.3% 82.6%
South 6.9% 13.1% 7.4%
Midwest 11.9% 12.6% 2.3%
West 1.4% 1.0% 7.7%
Table 1: Overview of PILOTs by Region
Note: Data for all tables in this report are drawn from multiple years. See section on data collection for details.
There are several reasons for the higher level of PILOT activity in this region. Figure 1 shows that the Northeast is substantially more reliant on the property tax as a revenue source for funding local governments than other parts of the country. Every state exempts charitable nonprofits from property taxes, but nonprofits typically have to pay user fees and are often subject to sales tax as well (Kenyon and Langley 2010, 19). Thus, greater reliance on property taxes increases the impact of the nonprofit sector on a local government’s ability to raise revenue. Figure 1 also shows that the Northeast has a larger nonprofit sector than other regions, so the revenue impact of the charitable exemption for all types of taxes will be larger. Finally, since localities tend to copy successful practices from surrounding jurisdictions, the greater prominence of PILOTs in the Northeast could lead even more localities to pursue these payments.
Property Tax as Percent of Own Source Revenue for Local Government (2009)
38.8% 50.9% 40.2% 59.0% 0% 20% 40% 60%
Northeast South Midwest West Census Region
Nonprofit Expenses per Capita (2005)
$3,800 $2,690 $3,125 $5,462 $0 $2,000 $4,000 $6,000
Northeast South Midwest West
Census Region Source: U.S. Census Bureau (2009); Wing, Pollak, and Blackwood (2008, 198–200). PILOTs by Type of Nonprofit and the Range of PILOT Contributions
Figure 2 shows that the overwhelming majority of PILOT revenue comes from higher education institutions and hospitals, often referred to as “eds and meds.” Combined, these two sectors account for 92 percent of PILOT revenue, with colleges and universities alone contributing 68 percent. Eds and meds also account for 46 percent of nonprofit organizations that make PILOTs.
Fig 2: Distribution of PILOTs Across Different Types of Nonprofits
7.6% 5.2% 12.5% 16.3% 4.5% 3.8% 3.8% 2.3% 0.2% 0.6% 2.4% 1.1% 24.8% 1.0% 67.5% 0.2% 21.9% 24.3%
0% 20% 40% 60% 80%
Other Social Services Religious Housing Health (Other) Health (Hospitals) Education (Other) Education (Higher Ed.) Arts/Culture
Percent of Total PILOT Revenue
Percent of All Nonprofits Making PILOTs Fig 1: Property Tax Reliance and Size of Nonprofit Sector by Region
Many other types of nonprofits make PILOTs, albeit typically with significantly smaller contributions. For example, this report identifies 47 housing nonprofits and 36 religious
nonprofits (including 23 churches) that make PILOTs, although their contributions only account for 2.4 percent and 0.6 percent of total PILOT revenues respectively.
Table 2 provides more detail about PILOT contributions from different types of nonprofits and also illustrates the wide range in the dollar value of PILOTs. This report has information on PILOTs from specific nonprofits worth $84.4 million with the exclusion of PILOTs in localities where information on payments from individual nonprofits is unavailable, such as in Pittsburgh where the Public Service Fund receives contributions from 46 nonprofits without revealing their individual payments. The size of PILOT payments varies widely, from $100 contributions made by small religious and cultural institutions, up to more than $10 million in PILOTs that Harvard University makes to Boston, Cambridge, and Watertown, Massachusetts.
Type of Nonprofit PILOT Revenue No. Nonprofits Average Median Minimum Maximum
Arts/Culture 145,669 11 13,243 1,033 100 78,983
Education (Higher Ed.) 56,918,672 70 813,124 158,426 1,425 10,088,273
Education (Other) 843,558 11 76,687 13,798 1,889 440,190
Health (Hospitals) 20,886,307 63 331,529 161,952 3,000 3,508,707
Health (Other) 905,481 13 69,652 7,500 500 407,619
Housing 2,046,102 47 43,534 21,925 154 272,250
Religious 544,647 36 15,129 600 100 502,791
Social Services 129,924 15 8,662 2,408 180 80,000
Other 1,949,687 22 88,622 6,898 184 1,250,000
All Nonprofits 84,370,047 288 292,952 30,000 100 10,088,273
Note: Total PILOT revenue and the number of nonprofits making PILOTs shown in Table 2 is less than the total reported in Table 1, because some localities reported aggregate PILOT revenue and the total number of nonprofits making PILOTs, but did not break-out contributions made by individual nonprofits.
Table 2: Overview of PILOTs for Different Types of Nonprofit Organizations
Totals by Type of Nonprofit Range of PILOTs for Different Types of Nonprofits
The influence of a small number of multi-million dollar PILOTs is reflected by the fact that the average PILOT for all nonprofits ($292,952) is nearly 10 times larger than the median ($30,000). Thus, looking at the median PILOT for each type of nonprofit provides a better understanding of the size of PILOTs made by the typical organization in each sub-sector. Once again eds and meds are outliers: the median PILOT from hospitals is $161,952 and the median from colleges and universities is $158,426. Housing nonprofits make median PILOTs of $21,925, followed by other types of education organizations ($13,798) and other types of health organizations
($7,500). Median PILOTs from arts/culture, religious, and social service nonprofits are all less than $2,500.
The predominance of colleges and hospitals in figure 2 and table 2 reflects the fact that these two types of nonprofits have much greater financial capacity than most other nonprofits. Despite accounting for only 1 percent of charitable nonprofits registered with the IRS, hospitals and higher education institutions controlled 51 percent of total revenues and 42 percent of all assets among nonprofits in 2010 (Kenyon and Langley 2010, 5). Similarly, because of their large size
and greater propensity to own property rather than rent, hospitals and colleges receive much larger tax savings from the charitable property tax exemption than other types of nonprofits. For example, using 2008 data Cordes (2012, 378) estimated that median tax savings were $21,276 among all nonprofits that own real property, but he found much greater median savings for hospitals ($1,371,685) and higher education institutions ($430,402).
The Largest PILOTs
Table 3 shows the 10 localities that have received the most revenue from PILOTs. Collectively these governments received $68 million in PILOTs, which is nearly three-quarters of the total PILOT revenue reported for all localities. In addition, at least 139 nonprofits made PILOTs in these 10 jurisdictions, which is a third of all the nonprofits making PILOTs identified in this report. The top ten localities are generally large cities with PILOTs from many nonprofits or college towns with a well-endowed university, and many jurisdictions fall into both groups. The first group includes Boston, Providence, Baltimore, Cambridge, Erie, and Pittsburgh. The second group includes New Haven, Palo Alto, Watertown, and Princeton.
Total
Pct. General Revenue
Pct. Property Taxes
Boston MA 2012 19,402,506 0.58% 1.45% 33
New Haven CT 2012 9,108,766 1.16% 4.57% 2+
Providence RI 2012 8,948,046 1.08% 2.88% 7
Palo Alto CA 2009 7,100,000 3.44% 25.43% 1
Baltimore MD 2011 5,400,000 0.16% 0.83% 15
Watertown MA 2012 5,260,089 4.85% 7.34% 1
Cambridge MA 2008/2012 4,978,954 0.40% 1.81% 15
Erie** PA 2011 2,804,842 0.48% 2.10% 13
Pittsburgh PA 2011 2,600,000 0.39% 1.84% 46
Princeton** NJ 2010/2012 2,492,922 4.09% 7.44% 6
Top 10 Localities 68,096,126 139
Percent of all Localities 73.5% 33.1%
No. Nonprofits Making PILOTs
Table 3: Ten Localities Receiving the Most PILOT Revenue
* Some localities have multiple years because data for different nonprofits come from different years. However, no nonprofits are double counted.
** Multiple localities receive PILOTs. In Erie, the city, county, and school district receive PILOTs. In Princeton, the borough and township receive PILOTs, although these two governments will merge on January 1, 2013.
City State Year*
PILOT Revenue
Despite the fact that these localities receive significantly more PILOT revenue than most other local governments, PILOTs still account for a relatively small share of their budgets: less than 1 percent of general revenues for five of the top 10 localities. PILOTs contribute the largest share of revenues in smaller college towns like Palo Alto, Watertown, and Princeton, but never account for even 5 percent of general revenues.
Table 4 shows the ten nonprofits that have made the largest PILOTs. These ten organizations have made PILOTs worth $48 million, or 52 percent of total PILOT revenue identified in this
report. Eight of the organizations are universities, and the other two are large hospitals participating in Boston’s recently expanded PILOT program.
Nonprofit Year Amount Nonprofit Type Localities State
Harvard University 2012 10,088,273 Higher Educ. Boston, Cambridge, Watertown MA Yale University 2012 8,100,000 Higher Educ. New Haven CT Stanford University 2009 7,100,000 Higher Educ. Palo Alto CA Brown University 2012 6,400,000 Higher Educ. Providence RI Boston University 2012 5,718,122 Higher Educ. Boston, Brookline MA Mass General Hospital 2012 3,508,707 Hospital Boston MA Dartmouth College 2009 1,900,000 Higher Educ. Dresden School District NH Brigham & Women's Center 2012 1,823,270 Hospital Boston MA Mass. Institute of Technology 2012 1,787,780 Higher Educ. Cambridge MA Princeton University* 2009/2012 1,751,000 Higher Educ. Princeton Borough/Township, W. Windsor NJ Top 10 Nonprofits 48,177,152
Percent of all Nonprofits 52.0%
* Princeton University's PILOT to Princeton Borough and Township is for 2012; PILOT to West Windsor is for 2009.
Table 4: Ten Nonprofits Making the Largest PILOTs
Revenue Productivity of PILOTs
As figure 3 shows, PILOTs account for a nominal share of total general revenue in the majority of localities receiving these voluntary payments. Of 186 localities with information on revenue from PILOTs, 131 generate less than 0.25 percent of their total revenue from PILOTs. These payments account for more than 1 percent of total revenue in only 21 localities.
Fig. 3: PILOTs as a Percent of Local Government Revenues 131
16 18
11 8
2 93
28
18 19 19
9 0
20 40 60 80 100 120 140
0% - .25% .25% - .5% .5% - 1% 1% - 2% 2% - 5% 5% + Percent of Revenues
N
o.
Lo
ca
li
ti
es
Pct. General Revenues Pct. Property Taxes
Note: Figure 3 is for 186 localities where the total amount of revenue generated by PILOTs is known.
Another way to look at revenue productivity is to compare PILOT revenue to the total amount of property taxes collected in each locality. This measure may be more meaningful since the
effect on other important local revenue sources, such as state aid, user fees, and sales taxes. PILOT revenue exceeds 1 percent of total property taxes in 47 of the 186 localities, but is less than 0.25 percent of total property taxes in 93 of the 186 localities.
Data on general revenues and property taxes used for figure 3 are from the most recent Census of Governments (U.S. Census Bureau 2007). A relevant comparison must account for inflation, so PILOT revenue for each locality is measured in 2007 dollars using the consumer price index for all urban consumers. Revenues are only for the locality receiving the PILOT and exclude revenues collected by overlying counties, school districts, and other local governments.2 Appendix table 4 shows that PILOTs accounted for 0.13 percent of general revenue in the median locality. That matches what the average local government raises from charges for parking meters and parking lots (0.13 percent of general revenues) and is about one-sixth of the library budget in the average locality (0.80 percent) (U.S. Census Bureau 2007).
Bowman, Cordes, and Metcalf (2009) estimate that the percentage of potential property tax collections forgone due to the charitable tax exemption is about 5 percent of total property taxes nationally, assuming that tax rates are constant. For local governments, the property tax
accounted for 27 percent of total general revenue in 2007 (U.S. Census Bureau 2007). Some jurisdictions have tried to replicate Boston’s goal of having nonprofits contribute a quarter of what they would owe in property taxes if fully taxable. Thus, even if all localities achieved that ambitious goal, a back-of-the-envelope calculation suggests that PILOTs would only account for 0.34 percent of local government general revenue nationally. However, because nonprofit properties are highly concentrated in a small number of localities, the percentage could be much higher in some places, such as central cities and college towns.
Methods Used for PILOTs
Localities take a variety of approaches to collect PILOTs. This report considered four different methods:
• Long-term contracts: These are formal contracts signed by nonprofits stipulating annual
payments for a specific number of years, often with an inflator clause that increases the base payment by a specific percentage each year.
2 This will make the share of revenue generated from PILOTs smaller in cities where there are no independent school districts or overlying counties providing public services, such as Boston, and larger in cities where the municipal government provides services in conjunction with separate school districts and counties, such as Pittsburgh. For example, the 2007 Census of Governments reports total general revenue for the City of Boston as $3.02 billion and for the City of Pittsburgh as $619 million. However, with the appropriate share of county and school district revenues included, general revenue for Pittsburgh would have been more than 2.4 times greater ($1.64 billion). Thus, for the City of Pittsburgh alone, PILOTs were 0.39 percent of total general revenues accounting for inflation (slightly less than Boston), but would have been only 0.16 percent of general revenue if a share of county and school district revenues were included (much less than Boston). For more information on this “constructed cities” methodology, see Chernick, Langley, and Reschovsky (2012).
• Routine annual payments: Without having long-term contracts signed by local nonprofits,
a locality may have a process to receive regular PILOTs from nonprofits where the dollar amounts are reasonably stable from year to year. Often this is done by sending annual letters to nonprofits requesting PILOTs.
• Voluntary property tax payments: These are property taxes that a nonprofit pays on
properties that are eligible for tax exemption under state law, but which the nonprofit has voluntarily kept on the tax rolls.
• Irregular one-time payments: Nonprofits sometimes make one-time cash payments to
jurisdictions as gifts or to support certain priorities. The payments may go to the general fund or be earmarked for a specific project or program.
Method Used for PILOT Number of Localities Percent of Localities
Long-Term Contracts 53 57.6%
Routine Annual Payments 31 33.7%
Voluntary Property Tax Payments 11 12.0%
Irregular One-Time Payments 10 10.9%
Localities Where Method Used for
PILOTs is Known 92
Table 5: Method Used for PILOTs
Note: The sum of the percent of localities using each method for PILOTs exceeds 100 percent, because 12 localities reported using more than one method.
Table 5 shows that long-term contracts are the most common method used for PILOTs, with 57.6 percent of localities using this approach. Routine annual payment is the next most popular
approach; used by about one-third of localities.
Types of Governments that Receive PILOTs
The great majority of local governments identified in this report as receiving PILOTs are municipalities and townships (the term “jurisdiction” is shorthand for these two types of governments in this report). Appendix Table 4 lists 207 municipalities and townships that have received PILOTs, plus 7 independent school districts and 4 county governments. The survey used for this report solely contacted government officials for municipalities and towns, because existing information indicated that these types of local governments were much more likely to receive PILOTs than counties or independent school districts.
The most systematic effort to obtain PILOT revenue for the county and school district is in Erie, Pennsylvania. Ten nonprofits that make PILOTs each divide their contributions between Erie School District (which receives 50.4 percent of the revenue), Erie City (32.4 percent), and Erie County (17.1 percent). A similar approach is used in Ithaca, New York, where Cornell
University and Ithaca College make PILOTs to the City and Town of Ithaca, Ithaca School District, and Tompkins County.
PILOTs in Cities with the Largest Nonprofit Sectors
In addition to the survey of local government officials in roughly 600 jurisdictions, a special effort was made to determine the use of PILOTs in cities with especially large nonprofit sectors. This group consisted of all cities ranked in the top 25 for nonprofit revenues, plus three more cities in the top 25 for nonprofit assets and the top 50 for nonprofit revenues.3 Of these 28 cities with the largest nonprofit sectors, 10 are identified in this report as receiving PILOTs.
In addition to the 10 cities receiving PILOTs, information for five other cities in this group was collected through the regular data collection process described below. For the remaining 13 cities, two extra steps were taken to obtain information on PILOTs. First, a Google search and a look at city financial documents were used to discern whether the city received PILOTs. Second, public finance professors in each city were asked if they knew of PILOTs in their city or whether they had contacts in local government who could authoritatively answer questions on these payments. These extra efforts did not turn up additional instances of PILOTs, but sources and documentation for the largest cities that do not currently receive PILOTs are shown in appendix table 2.
The information collected through these extra efforts for Portland, Oregon illustrates some of the difficulties of collecting information on PILOTs. Portland is part of Multnomah County and the annual financial report indicated that the county did derive revenue from PILOTs. However, a phone call with the finance department clarified that the PILOT revenue was not from
nonprofits, but instead from the federal government and tax incentives for businesses.
Data Collection
This report combines information on PILOTs from two sources. First, we surveyed assessors and chief financial officers in 599 cities and towns with the largest nonprofit sectors in the United States on whether their communities receive PILOTs from nonprofits. Second, we collected information from newspaper articles, state government documents, and other publicly available sources. One critical part of the data collection process was confirming whenever possible
whether payments reported as PILOTs by survey respondents or in other sources actually met the definition used in this report. The term “PILOT” refers to many different types of payments, but we strove to exclude any payments from for-profit companies or public entities (i.e., housing authorities) and any legally required payments from nonprofits.
Survey of Jurisdictions with Large Nonprofit Sectors
The information in this report is based in part on a survey of local government officials in cities and towns with the largest nonprofit sectors, defined as those with total nonprofit revenues or nonprofit assets in the top 500 for all jurisdictions. There is a large degree of overlap between these two lists, with 401 jurisdictions in the top 500 for both nonprofit revenues and assets. There are 99 jurisdictions in the top 500 for revenues but not assets, and another 99 in the top 500 for assets but not revenues. Thus, in total 599 cities and towns were included in the survey. While
these jurisdictions are only 1.7 percent of all municipalities and townships in the United States, 79 percent of nonprofit revenues, 83 percent of nonprofit assets, and 43 percent of all nonprofit organizations are within their boundaries.4
Estimates of nonprofit revenues and assets for each jurisdiction were derived from the June 2011 Business Master File for all 501(c)(3) nonprofits in the United States from the National Center for Charitable Statistics (NCCS), which is a dataset with basic information for all active
nonprofits that have filed for tax-exempt status with the IRS. While using the NCCS dataset will result in somewhat imprecise estimates of nonprofit revenues and assets at the municipal-level, this is only a minor problem for creating a list of jurisdictions with the largest nonprofit sectors since the ranking of cities is unimportant as long as they are in the top 500.5
Local government officials in the 599 jurisdictions with the largest nonprofit sectors were initially contacted to complete the survey on PILOTs in July and August 2011, with a second request sent in August and September 2011 for those who did not respond to the initial contact. In 11 states where real property is assessed at the municipal or township level, the survey was sent to Chief Assessors or the equivalent position.6 In states where real property is assessed at the county or state level, the survey was sent to jurisdictions’ Chief Financial Officers or the
equivalent position. Based on the available type of contact information, officials were contacted via postal mail (57 percent of those surveyed) or email (43 percent). The first group had the option to complete a hard copy of the survey or submit it online at SurveyMonkey.com.7 A copy of the survey questionnaire is provided in the appendix.
In total, 171 officials responded to the survey request, a 28.5 percent response rate. Of those respondents, 42 percent reported that their jurisdictions received PILOTs from nonprofits, while 56 percent said they did not receive PILOTs and 2 percent were unsure. However, as described below, survey responses were screened to ensure that the reported PILOTs met the definition used for this report. This screening process identified 11 jurisdictions where respondents
reported PILOTs that did not meet this definition, largely PILOTs made by housing authorities.8
4 The 2007 U.S. Census of Governments reported 36,011 subcounty general purpose local governments, which includes municipalities and townships. The June 2011 Business Master File from the NCCS reported a U.S. total of $1.45 trillion in nonprofit revenues, $3.23 trillion in nonprofit assets, and 1.04 million nonprofit organizations. 5
One problem is that large national nonprofits with operations in multiple cities will have all of their revenues and assets allocated to the single city identified on their IRS Form 990. Another problem is dealing with a variety of issues with the cities listed on nonprofits’ Form 990s: neighborhoods listed instead of jurisdictions (i.e., Bronx instead of New York City); unincorporated places listed instead of legally designated governments (i.e., Bethesda, MD instead of Montgomery County, MD); and errors and informal spellings (i.e., NYC instead of New York City). The initial list of jurisdictions with the largest nonprofit sectors included 49 places with one of these issues. For 31 places, nonprofit revenues and assets were added to the appropriate jurisdiction or were re-named with the official government name. In 18 places, villages or unincorporated places without taxing authority were listed in the NCCS dataset; these places were dropped from the sample because the survey did not contact officials from county governments. After dealing with these places, a final list was generated of jurisdictions with nonprofit revenues or assets in the top 500.
6 The 11 states are Connecticut, Maine, Massachusetts, Michigan, New Hampshire, New Jersey, New York, North Dakota, Rhode Island, Vermont, and Wisconsin. These states were identified based on responses to surveys conducted by the International Association of Assessing Officers (2000, 2010).
7 www.surveymonkey.com/s/SURVEY_PILOTS
8 Federal law requires that low-income housing projects provided by public housing authorities that receive federal funding must be exempt from property taxes and that the housing authorities must make PILOTs equal to 10 percent
After altering these responses, 36 percent of responding jurisdictions were identified as receiving PILOTs from nonprofits, 62 percent did not receive PILOTs, and 2 percent were unsure.
It is important to note that this was not a statistically based survey. There are no confidence intervals provided and the percentage of respondents reporting PILOTs should not be extrapolated to reach conclusions about the proportion of all U.S. jurisdictions receiving PILOTs. Instead of drawing a random sample of municipalities and towns, this survey targeted jurisdictions with the largest nonprofit sectors, which are presumably more likely to receive PILOTs than jurisdictions with few nonprofits. In addition, it is possible that jurisdictions receiving PILOTs were more likely to respond to the survey request that those that do not. Thus, the overall percentage of U.S. jurisdictions receiving PILOTs is likely to be substantially lower than 36 percent.
Other Sources for Information on PILOTs
To compile a comprehensive list of localities receiving PILOTs, this report uses information on PILOTs from three other sources: (1) survey responses from property tax assessors for localities with smaller nonprofit sectors that were not part of our sample; (2) newspaper articles and other publicly available information; and (3) state government sources.
The first source for additional information came from a message posted on Assessor.net in July 2011 that directed people to the online survey. Assessor.net is an online message board for members of the International Association of Assessing Officers, a professional association for property tax assessors that has more than 7,300 members worldwide. There were 28 responses to this request, including 9 from assessors for jurisdictions with the largest nonprofit sectors
targeted for the survey (7 reported PILOTs), 12 from assessors for jurisdictions with smaller nonprofit sectors (8 reported PILOTs), and 7 from county assessors (0 reported PILOTs). Information collected from newspaper articles and other sources provided data on PILOTs in another 76 localities. Appendix table 1 has brief notes describing these PILOTs and complete citations for each source. These sources were collected over the course of nearly three years from a comprehensive and ongoing data collection effort and Google alerts for search terms related to PILOTs. Because the term “PILOT” is widely used to describe payments from public authorities, for-profit businesses, and state or federal government, aggregate data on PILOTs from city budgets was generally not used for this report unless the information could be corroborated by other sources.
Three state sources provided information on PILOTs in 82 localities. The most important state source was a report by Massachusetts Department of Revenue (2003), which surveyed all 351 of the state’s municipalities and provided data on the amount of revenue generated by PILOTs in 80 municipalities receiving these payments. The New Hampshire Department of Revenue provided a spreadsheet with information on PILOTs made by 11 nonprofit hospitals to 14 jurisdictions in
of net shelter rents or a lesser amount set by state statute or agreed to by the local governing body (42 U.S.C. §1437d). These payments do not meet the definition of PILOT used in this report because they are made by public authorities and they are legally required under federal law instead of being voluntary.
New Hampshire. Finally, a report by the Pennsylvania General Assembly (2009, 30) provides information on PILOTs made by six nonprofit affiliates of state universities.
Estimating the Use of PILOTs Nationally
The comprehensive report by the Massachusetts Department of Revenue (DOR) is a good baseline for comparison to this report. This comparison suggests that the number of localities identified in this study as receiving PILOTs (218) is likely to be a significant undercount of the true number of localities receiving these payments nationally, but the $92.7 million in PILOT revenue reported here is likely to be much closer to the true dollar value received nationally. Essentially, this study is likely to have identified most of the largest PILOTs, but to have missed many small PILOTs.
Using the survey and other sources, we were able to update information on PILOTs for 17 of the 80 municipalities identified in the DOR report.9 These 17 municipalities accounted for 83.5 percent of total reported PILOT revenue in the 2003 DOR report. Thus, compared to the information that would have been provided without reference to the DOR report, adding data from this truly comprehensive source increased the number of municipalities receiving PILOTs by 370 percent and the amount of PILOT revenue by 20 percent. If the same margin of error existed nationally between the data included in this study and the actual use of PILOTs, then there would be approximately 800 localities receiving PILOTs worth a combined $110 million. Unfortunately, we are unaware of comparable reports on PILOTs in other states. An undercount of the number of localities receiving PILOTs is inevitable for many reasons: the ad hoc nature of collecting information from newspaper articles and other sources; the difficulty of identifying nonprofit payments that meet the definition of PILOT used for this report but go by different names; the limited number of jurisdictions that responded to the survey; and the fact that information on PILOTs, especially very small payments, is sometimes not publicly available.
Years for Data on PILOTs in this Report
It is important to note that the data presented in this report are for different years, which is an inevitable problem given the large number of sources used for this study. However, there is no double counting of PILOTs. In other words, when there is information on the amount a nonprofit has contributed in PILOTs for multiple years, only the most recent year is used. With the
exception of data for 63 municipalities drawn from the report by the Massachusetts Department of Revenue (2003), nearly all examples of PILOTs in this report have occurred since 2008 (See table 6 on next page).
9 We did not attempt to update information on PILOTs for the 63 other municipalities. Information for the 17 municipalities that were updated was collected in the same manner as used for the rest of the country—through the survey and other data collection efforts. In total, PILOT revenues increased 121 percent in these 17 municipalities between 2003 and the most recent year of data. In addition, through newspaper articles and other sources, we identified 12 municipalities that currently receive PILOTs but did not in 2003.
Table 6: Years for Data Used in this Report
Localities Nonprofits Revenue
Number Percent Number Percent Total Percent
2001 2 0.9% 1 0.2% 12,500 0.0%
2002 1 0.5% 2 0.5% 0 0.0%
2003 64 29.4% 1 0.2% 2,958,591 3.2%
2004 1 0.5% 1 0.2% 300,000 0.3%
2005 1 0.5% 0 0.0% 0 0.0%
2006 0 0.0% 0 0.0% 0 0.0%
2007 5 2.3% 3 0.7% 193,683 0.2%
2008 1 0.5% 1 0.2% 571,085 0.6%
2009 27 12.4% 16 3.8% 13,210,354 14.3%
2010 24 11.0% 98 23.3% 3,245,899 3.5%
2011 64 29.4% 179 42.6% 19,981,067 21.6%
2012 21 9.6% 75 17.9% 52,181,489 56.3%
Multiple Years 7 3.2% 43 10.2%
Total 218 100.0% 420 100.0% 92,654,669 100.0% A Consistent Definition of PILOTs
One important part of the data collection process was striving to use a consistent definition of PILOTs. This report defines PILOTs as voluntary payments made by tax-exempt private nonprofits as a substitute for property taxes. The term “PILOT” frequently refers to payments from public authorities and for-profit companies, both of which are excluded from this report. To eliminate PILOTs from organizations that are not nonprofits, we confirmed that all organizations were registered as 501(c)(3) nonprofits by using a database of all nonprofits maintained by the National Center for Charitable Statistics. We also tried to eliminate all payments that were not voluntary, including formulaic PILOTs required by state statute or city ordinance and other types of mandatory fees imposed on nonprofits, such as municipal service fees. To the best of our knowledge, no previous report on PILOTs has taken these steps.
To utilize a consistent definition of PILOTs, the questionnaire for the survey of jurisdictions with large nonprofit sectors included a box with a detailed explanation of the types of payments that would meet our definition of PILOTs. In addition, checking the nonprofit status of organizations identified by the respondents as making PILOTs resulted in the elimination of 21 PILOTs worth $1.2 million from public entities and 14 PILOTs worth $5.0 million from for-profit businesses. Several examples below help illustrate the challenge of using a consistent definition of PILOTs. Milwaukee provides a good example of the range of organizations that make PILOTs and the difficulty of classifying these organizations as non-profit, for-profit, or public. A survey
respondent provided information on PILOTs from 13 organizations worth $382,855, but once we excluded organizations that are not nonprofits, the number of PILOTs fell to 8 and they were worth $135,678. Some of the PILOTs were clearly from nonprofits, but several came from housing organizations whose character as non-profit, for-profit, or public was not clear. The list
of PILOTs included several properties owned by the Milwaukee Housing Preservation Corp. and the Milwaukee Housing Assistance Corporation. The former organization is registered as a 501(c)(3) nonprofit, while the latter is not. The list also included properties used for student housing, including a PILOT from Cambridge Commons Student Housing that was excluded because it is owned by a public entity (University of Wisconsin–Milwaukee) and a PILOT from Riverwest Student Housing that was excluded because it is owned by a for-profit developer. In addition, the list had a $175,000 PILOT from the Bradley Center, a sports arena for the
Milwaukee Bucks and several other teams, which is excluded from this report because it seems to blur the line between being for-profit, public, and non-profit.
Grand Rapids provides an example of payments similar to PILOTs that are not counted for this report because they are not voluntary contributions. A survey respondent provided information on 59 PILOTs worth a combined $1,366,974. However, these payments are legally required under state statute and city ordinance. Michigan law grants property tax exemptions for housing projects that meet certain requirements,10 but requires that they pay service charges in lieu of taxes equal to 10 percent of annual shelter rent (i.e., rent excluding utilities), with municipalities having the option to adopt different service charges through an ordinance. For example, in Grand Rapids, housing projects approved after January 1, 1991 pay a service charge equal to 4 percent of annual shelter rent (See Article 5, Chapter 9 of the City Code).
Yale University’s PILOT to New Haven illustrates another challenge when collecting information on PILOTs: payments meeting the definition used in this report are often not referred to as “PILOTs.” Yale’s payments are set under two separate agreements: a 1990 agreement establishing an annual “fire service fee” based on the number of phone calls for fire services made by the University and a 2005 agreement establishing an annual “voluntary payment” based on the number of beds and employees on campus. A 2009 agreement added a multiplier based on the total PILOT value (Zapana 2009).
Similar terms for PILOTs are very common. The term “service fee” is often used because
localities estimate the cost of providing specific services to a nonprofit, such as fire protection or street maintenance, as a way to justify a certain level of contributions. In some cases, long-term agreements may explicitly link ongoing payments to future service demands, such as Yale’s arrangement. Despite being called a “fee,” these payments are not legally required payments like typical user fees. Instead, they are voluntary payments negotiated with individual nonprofits, which are simply linked to estimated service demands. The terms “voluntary payment” and “voluntary contribution” are often widely used, because some nonprofits worry that the term “payment in lieu of taxes” implies that they should be paying some taxes and could undermine their tax-exempt status in future court cases.
10
Section 15(a) of the Michigan Housing Development Authority Act of 1966 (Section 125.1415(a)) grants property tax exemptions for housing projects meeting all of the following requirements:
1) Projects owned by “consumer housing cooperatives,” qualified nonprofit housing corporations,” or “limited dividend housing associations.”
2) Projects financed with a Federally-aided or State Housing Development Authority-aided mortgage or with an advance or grant from such Authority.
Harrisburg demonstrates one more problem with trying to use a consistent definition when collecting information on PILOTs: aggregate PILOT amounts reported in city budgets and newspaper articles are often inflated by the inclusion of PILOTs from public agencies or for-profit businesses. For example, one newspaper article reported $410,000 in PILOTs from nonprofits, but some of the largest contributions cited were from public agencies (Frantz 2011). The Recovery Plan for the City of Harrisburg (2012) shows that $107,000 came from the Pennsylvania Higher Education Assistance Agency and $88,000 came from the Pennsylvania Housing Finance Agency.
Conclusion
The findings in this report confirm several assumptions about PILOTs that had previously been supported largely by anecdotal evidence. First, large universities and hospitals contribute much more in PILOTs than other types of nonprofits, which reflects the fact that these two sub-sectors control much greater financial assets and receive much larger property tax savings from the charitable tax exemption than other types of nonprofits. Second, the great majority of PILOT activity occurs in the Northeast, a region with a larger nonprofit sector, greater reliance on the property tax, and a longer history of PILOTs than other parts of the country. Finally, despite increased attention paid to PILOTs, these voluntary payments generate little revenue in most localities—accounting for less than 1 percent of total general revenue in 165 out of 181 localities that have information available on PILOT revenue.
It is likely that more localities will pursue nonprofit PILOTs in the coming years as local governments continue to face serious fiscal pressures. This report has focused on providing descriptive statistics on PILOTs since previous research has already covered broader issues, such as the pros and cons of using PILOTs and recommendations for their use (Kenyon and Langley 2010, 2011a, 2011b). The most important guideline for localities considering PILOTs is that collaboration is better than conflict—local government officials should work with nonprofits to reach mutually beneficial PILOT agreements instead of relying on heavy-handed pressure tactics to compel nonprofits to make payments.
Pursuing a collaborative approach to PILOTs can help avoid the contentiousness that sometimes surrounds the debate around PILOTs. This report shows that PILOTs will never be a panacea for cash-strapped governments—they simply do not generate enough revenue. It also shows that concerns that PILOTs will seriously undermine nonprofits’ financial health are exaggerated— these payments are voluntary, typically are much less than what nonprofits would pay if taxable, and the majority of revenues come from a few wealthy universities and hospitals. While the debate around PILOTs can be disproportionate to the dollars involved, these payments can still provide useful funding to help localities offset the cost of providing services to nonprofits and can benefit nonprofits by strengthening their communities and their relationships with local government.
References
Bowman, Woods, Joseph Cordes, and Lori Metcalf. 2009. Preferential tax treatment of property used for social purposes: Fiscal impacts and public policy implications. In Erosion of the
property tax base: Trends, causes, and consequences, ed. Nancy Y. Augustine, Michael E. Bell, David Brunori, and Joan M. Youngman, 269–294. Cambridge, MA: Lincoln Institute of Land Policy.
Chernick, Howard, Adam Langley, and Andrew Reschovsky. 2012. Central city revenues after the Great Recession. Land Lines. Cambridge, MA: Lincoln Institute of Land Policy.
City of Boston. 2010. Mayor’s PILOT task force: Final report and recommendations. December. http://www.cityofboston.gov/assessing/pilot.asp
Cordes, Joseph J. 2012. Assessing the nonprofit property tax exemption: should nonprofit entities by taxed for using local public goods? In Value capture and land policies, ed. Gregory K. Ingram and Yu-Hung Hong, 353–401. Cambridge, MA: Lincoln Institute of Land Policy. Frantz, Jeff. 2011. Harrisburg needs donations from tax-exempt properties. The Patriot-News. July 5.
Glancey, David B. 2002. PILOTs: Philadelphia and Pennsylvania. In Property-tax exemption for charities, ed. Evelyn Brody, 211–232. Washington, DC: Urban Institute Press.
International Association of Assessing Officers. 2000. Property Tax Polices and Administrative Practices in Canada and the United States, 28–29.
International Association of Assessing Officers. 2010. Journal of Property Tax Assessment and Administration 7(4): 41–42.
Kenyon, Daphne A. and Adam H. Langley. 2010. Payments in lieu of taxes: Balancing municipal and nonprofit interests. Cambridge, MA: Lincoln Institute of Land Policy.
Kenyon, Daphne A. and Adam H. Langley. 2011a. The municipal fiscal crisis and payments in lieu of taxes by nonprofits. Land Lines. April.
Kenyon, Daphne A. and Adam H. Langley. 2011b. Payments in lieu of taxes by nonprofits: Case studies. State Tax Notes 61(3): 171–181.
Leland, Pamela. 2002. PILOTs: The large city experience. In Property-tax exemption for charities, ed. Evelyn Brody, 193–210. Washington, DC: Urban Institute Press.
Massachusetts Department of Revenue. 2003. A study of charitable and educational property tax exemptions: FY2003 impact of MGL 59 5 cl3. Division of Local Services. December.
Pennsylvania General Assembly. 2009. Tax-exempt property and municipal fiscal status. Legislative Budget and Finance Committee. March.
Recovery Plan for the City of Harrisburg. 2012. February 6. Pg. 154. http://www.newpa.com/webfm_send/2071
Salamon, Lester M., Stephanie L. Geller, and S. Wojciech Sokolowski. 2011. Taxing the tax-exempt sector – A growing danger for nonprofit organizations. Center for Civil Society Studies at Johns Hopkins University.
Wing, Kennard T., Thomas H. Pollak, and Amy Blackwood. 2008. Nonprofit almanac: 2008. Washington, DC: Urban Institute Press.
U.S. Census Bureau. 2007. Census of Governments: Finance.
U.S. Census Bureau. 2009. Annual Survey of State and Local Government Finances. Zapana, Victor. 2009. Yale to up payment to city. Yale Daily News. February 27.
Survey on Payments in Lieu of Taxes Made by Nonprofits
1. What local government are you providing information for in this survey? ________________________________
2. Does your jurisdiction currently receive any payments in lieu of taxes (PILOTs) from tax-exempt nonprofits that meet the definition below?
Yes (Please answer questions on the other side and provide contact information below) No (Please provide your contact information below)
Unsure (Please provide your contact information below)
Contact Information
Name:
______________________________
Title:_______________________________
Department:___________________________
Address:_____________________________
City and State:_________________________
Email:______________________________
Phone:______________________________
Definition of PILOTs: We define PILOTs as voluntary payments made by tax-exempt private nonprofits as a substitute for property taxes.
Our definition excludes:
Ø Mandatory fees or taxes: We exclude user fees, service fees, and other charges nonprofits are legally required to pay, as well as property taxes paid on individual properties owned by nonprofits that are not eligible for a tax exemption based on their current use under state law (i.e. ancillary properties like parking lots).
Ø Payments from public authorities or public universities: We exclude payments from public housing authorities, public utilities, and other entities that sometimes make payments to municipalities referred to as payments in lieu of taxes.
Ø Payments from businesses: We exclude agreements where local governments offer businesses the opportunity to make a PILOT instead of full payment of property taxes as an economic incentive to locate in their jurisdiction.
Our definition includes property taxes that a nonprofit pays on properties that are eligible for tax exemption under state law, but which the nonprofit has voluntarily kept on the tax rolls. More about PILOTs: PILOTs typically result from negotiations between local government officials and individual nonprofits, but the exact arrangements vary widely. PILOTs are sometimes formalized into long-term contracts, sometimes routine annual payments, and sometimes irregular one-time payments. The payments can go into a jurisdiction’s general fund, or be directed to a specific project or program. PILOTs are most frequently made by hospitals, colleges, and universities, but are also made by nonprofit retirement homes, low-income housing facilities, cultural institutions, fitness centers, churches, and more. Some such payments are not even called PILOTs, but are known as “voluntary contributions” or “service fees,” even if they are voluntary payments meeting the definition above.
Questions for Jurisdictions that Currently Receive PILOTs
3. In the most recent year, how many tax-exempt private nonprofits made payments in lieu of taxes in your jurisdiction? _______________
4. In the most recent year, how much revenue did your jurisdiction receive from PILOTs made by tax-exempt private nonprofits? _______________
5. In the most recent year, which types of nonprofits made PILOTs in your jurisdiction? (Check all that apply)
Arts/Culture
Education (Colleges and universities) Education (Other)
Health (Hospitals) Health (Other)
Housing (Nursing homes, retirement homes, low income housing, etc.) Religious (Excluding religious schools)
Social Services
Other ___________________
6. In answering the previous questions, what was the most recent year for information on PILOTs in your jurisdiction? __________ ( Fiscal Year Calendar Year)
7. The nature of PILOT agreements varies considerably across jurisdictions. How would you describe PILOTs in your jurisdiction? (Check the most common approach in your jurisdiction)
Long-term contracts: These are formal contracts signed by nonprofits stipulating annual payments for a specific number of years, often with an inflator clause that increases the base payment by a specific percentage each year. The contracts often explicitly state that these are voluntary payments that a nonprofit has agreed to pay, which is done to avoid undercutting the charitable property tax exemption.
Routine annual payments: Without having long-term contracts signed by local nonprofits, a municipality may have a process to receive regular PILOTs from nonprofits where the dollar amounts are reasonably stable from year-to-year. Often this is done by sending annual letters to nonprofits requesting a PILOT.
Voluntary property tax payments: These are property taxes that a nonprofit pays on properties that are eligible for tax exemption under state law, but which the nonprofit has voluntarily kept on the tax rolls.
Irregular one-time payments: Nonprofits sometimes make one-time cash payments to jurisdictions as gifts or to support certain priorities. The payments may go to the general fund or be earmarked for a specific project or program.
Thank you for completing the main part of the survey. Having this information on PILOTs at the municipal level is very valuable. We would also really like to include in our table more detailed information on PILOTs made by individual nonprofits, and would greatly appreciate it if you could take a few minutes to fill-in the attached table with information on each PILOT in your jurisdiction. Alternatively, you can email existing documents with that information to Adam Langley, ALangley@lincolninst.edu, or fax them to (617) 661-7235. Any additional resources you could send us on PILOTs in your jurisdiction would also be very useful, including links to newspaper articles, contracts formalizing PILOT agreements, letters to nonprofits, etc. Thanks!
Appendix Table 1: Notes for PILOTs Identified in Sources Other than the Survey City State Sources and Notes
Palo Alto CA Stanford paid the Palo Alto Fire Department $7.1 million in 2009. The Fire Department and Stanford University have a contract, which provides for a fire station on the Stanford campus and at the Stanford Linear Accelerator.
Palo Alto Fire Fighters, Local 1319. 2009. Fire Department Revenue, Fiscal Year 2009.
While this contract is not called a “PILOT,” it is counted as a PILOT in this report because taxpayers do not sign contracts for services and presumably Stanford would receive fire services from Palo Alto even if it did not make this payment. Thus, the contract is viewed as a voluntary payment as a substitute for property taxes, which is consistent with the definition of PILOTs used in this report. New Haven CT For FY12, the New Haven City Budget separately reports both a Yale Fire Service Fee ($2,704,872) and Non-Profit Voluntary
Payments ($6,403,894). Thus, the total voluntary contributions from nonprofits were $9,108,766. If Yale paid $8.1 million to New Haven (Kiley 2012), this means other nonprofits collectively contributed $1,008,766.
City of New Haven. 2011. FY12 Adopted Budget. Pg. 2–28.
Kiley, Kevin. 2012. Brown dispute questions what's a fair payment in lieu of taxes. Inside Higher Ed. February 10.
Washington DC There are currently no PILOTs in DC, but AARP and the National Education Association made contributions in 2002.Councilmember Mary Cheh has proposed PILOTs for large nonprofits and has also suggested a $100 fee per student per semester for local universities. Brint, Juliana. 2010. City on a hill: budgeting on auto-PILOT. The Georgetown Voice. December 9.
DeKalb County Schools
GA “Emory U. University officials give monetary and other support to the local community, including providing charity health care, infrastructure improvements, and donations to the DeKalb County Schools.”
Nelson, Libby. 2010. How Other Universities Contribute to Their Communities. Chronicle of Higher Education. January 31. Emory University (including Emory Healthcare) made approximately $2.5 million in voluntary payments in FY2010.
Emory University. Community Impact Study, The Impact of Spending. http://impact.emory.edu/enterprise/impact_of_spending.html Evanston IL “Northwestern does not make regular payments in lieu of taxes to the city of Evanston nor its schools, but the university does make
cash gifts and other gifts regularly on a case-by-case basis. The university, for instance, promised $120,000 over three years, beginning in 2008, as seed money to help set up a foundation for the local school district.” The University donated $550,000 in Evanston in fall 2009 for the purchase of a fire truck.
Nelson, Libby. 2010. How Other Universities Contribute to Their Communities. Chronicle of Higher Education. January 31. Mishawaka IN See notes for South Bend, IN.
Roseland IN See notes for South Bend, IN.
South Bend IN In June 2009, Notre Dame reached an agreement with four jurisdictions. In total, Notre Dame will contribute $5.5 million over ten years: $500,000 for the first five years, and $600,000 for years 6–10. For years 1–5, the revenue will be split as follows: South Bend ($275,000/year), St. Joseph County ($170,000/year), Mishawaka ($50,000/year), and Roseland ($50,000/year).
University of Notre Dame, Office of Public Relations. $5.5 M Economic Initiative. http://publicaffairs.nd.edu/civic-leadership/5-5m-economic-initiative/
Chronicle of Higher Education. 2010. What some universities agree to pay local governments in lieu of taxes. January 31. St. Joseph
County
City State Sources and Notes
Vincennes IN The Knox County Association for Retarded Citizens (KCARC) voluntarily pays $80,000 in property taxes on almost all of its properties in Vincennes. The Mayor has also asked for PILOTs from the community’s two largest nonprofits: Vincennes University and Good Samaritan Hospital.
Grant, Mike. 2011. City hopes PILOT project will help funding. WTHI-TV. January 26. Multiple
Municipalities
MA A report by the Massachusetts Department of Revenue (2003) identified 80 municipalities that received PILOTs in FY2003,
collectively worth $17,894,347, with Boston accounting for 58 percent of the total ($10,383,022). The PILOT revenue was split evenly between two categories of nonprofits: $9,450,872 from Class 904 tax-exempt properties (Educational institutions, schools, and
colleges) and $8,443,475 from Class 905 tax-exempt-properties (Other charitable organizations, such as non-profit hospitals,
conservation and preservation organizations, and human services groups). PILOT revenue in these 80 communities was estimated to be 5.86 percent of what the nonprofits would owe if these properties were fully taxable.
Massachusetts Department of Revenue. 2003. A study of charitable and educational property tax exemptions: FY2003 impact of MGL 59 5 cl3. Division of Local Services. December.
McArdle, Regina, and Donna Demirai. 2004. A study of charitable and educational property tax exemptions. City and Town, January. Massachusetts Department of Revenue, Division of Local Services. http://www.mass.gov/Ador/docs/dls/publ/ct/2004/january.pdf Belmont MA As of March 2012, seven nonprofits contributed a combined $37,000 in PILOTs. That month the Town sent letters to all 38 tax-exempt
nonprofits in the community asking for PILOTs. Combined the letters ask for a little more than $530,000 in PILOTs, including
$213,000 from McLean Hospital, $165,000 from the Massachusetts Audubon Society, $56,000 from Belmont Hill School, and $22,000 from Belmont Day School.
Allen, Evan. 2012. Town asks nonprofits to pitch in with cash. Boston Globe. March 8. W1, W7.
Boston MA FY2012 was the first year of Boston’s new PILOT program. The City identified 45 private nonprofits that owed tax-exempt property in excess of a $15 million threshold established under the PILOT program. Collectively, 33 organizations contributed $19.4 million—a 28 percent increase from FY2011 and 90.4 percent of the requested $21.5 million.
City of Boston. 2012. PILOT Requests for FY2012, Second Half Update. http://www.cityofboston.gov/assessing/pilotprogram.asp PILOTs for FY2007 to FY2010 are available on the website for the Mayor’s PILOT Task Force, which also includes the Task Force’s report, meeting notes, and other materials.
http://www.cityofboston.gov/assessing/pilot.asp
Boston’s old PILOT program used long-term contracts, but the new program is completely voluntary with the expectation that relevant nonprofits will make routine annual payments. Some nonprofits have chosen to voluntarily keep some properties on the tax rolls that based on their use would ordinarily qualify for a tax exemption.
Eric Lustig has written articles about the process involved in negotiating the provisions of the new PILOT program. Eric A. Lustig. 2010. The Boston PILOTs Task Force: an emerging best practice? 44 New England Law Review 601.
Eric A. Lustig. 2011. The Boston PILOT Task Force one year later: proposed change and its aftermath. 46 New England Law Review
City State Sources and Notes
Cambridge MA For FY12, the City of Cambridge budgeted $5,120,000 in PILOTs, including $2,706,290 from Harvard and $1,787,780 from MIT. The FY12 total includes a PILOT from the Cambridge Housing Authority.
City of Cambridge. 2011. FY12 Adopted Budget. Page III-27.
FY08 PILOTs from individual nonprofits are provided from Fennimore (2009).
Fennimore, Jillian. 2009. Cambridge collected $4.8 million from nonprofits in 2008. Wicked Local Cambridge. April 22. Concord MA “In 2010, Concord sent letters to 34 nonprofits asking for payments in lieu of taxes, but only the Concord Art Association agreed,
offering $1,000, and local officials dropped the issue.”
Allen, Evan. 2012. Town asks nonprofits to pitch in with cash. Boston Globe. March 8. W7.
In FY2003, the Massachusetts Department of Revenue (2003) reported that nonprofits contributed $23,600 in PILOTs.
Easton MA Town Administrator contacted officials of Stonehill College about making a $70,000 PILOT based on the cost of providing fire services to the college. The College sent a $20,000 gift in 2009. Easton fined Stonehill $55,000 in fall 2009 “for starting a major construction projection without a building permit.” The College paid by the fine, but has sued the Town to get the money back, and has stopped making annual payments.
Legere, Christine. 2011. Towns asking more of colleges. Boston Globe. April 10. Fairhaven MA In 2010, Fairhaven received $21,925 from Alden Court (A nursing home).
Fraga, Brian. 2011. Prime property, no taxes. South Coast Today. April 17. Groton MA The Town of Groton’s FY12 Budget includes $208,178 in PILOTs.
Town of Groton. 2012. FY12 Budget.
Nelson (2010) notes that the Massachusetts Institute of Technology makes payments to Groton, MA.
Nelson, Libby. 2010. How Other Universities Contribute to Their Communities. Chronicle of Higher Education. January 31. In FY2003, Groton received $119,521 in PILOTs from nonprofits: $56,000 from Class 904 tax-exempt properties (Educational institutions, schools, and colleges) and $63,521 from Class 905 tax-exempt-properties (Other charitable organizations, such as non-profit hospitals, conservation and preservation organizations, and human services groups).
Massachusetts Department of Revenue. 2003. A study of charitable and educational property tax exemptions: FY2003 impact of MGL 59 5 cl3. Division of Local Services. December.
Lowell MA On March 1, 2011 the City Manager sent letters to all 111 property-owning, tax-exempt nonprofits seeking $2.4 million in PILOTs. By June 6, the City had received $5,588.02 in PILOTs from six organizations. In 2010, the city requested PILOTs worth $2.38 million and received $21,018.76. “The monetary request is calculated by dividing the city’s total property-tax levy, which this year is $104.5 million, by the total square footage of land in the city, which is 352.5 million, resulting in a rate of 30 cents per square foot.” Myers, Jennifer. 2011. PILOT plan isn’t flying in Lowell. Lowell Sun. June 6.
The survey respondent reported PILOTs worth $18,729 from nine nonprofits. The Lowell Sun article reports PILOTs worth $5,588 from six nonprofits, which suggests that another three nonprofits contributed a total of $13,141.