i
until otherwise indicated in new editions.
Adobe product screenshot(s) reprinted with permission from Adobe Systems Incorporated. Microsoft product screenshot(s) reprinted with permission from Microsoft Corporation. Licensed Materials - Property of IBM
© Copyright IBM Corporation 1994, 2012.
U.S. Government Users Restricted Rights - Use, duplication or disclosure restricted by GSA ADP Schedule Contract with IBM Corp.
Preface
IBM® SPSS® Modeler is the IBM Corp. enterprise-strength data mining workbench. SPSS Modeler helps organizations to improve customer and citizen relationships through an in-depth understanding of data. Organizations use the insight gained from SPSS Modeler to retain profitable customers, identify cross-selling opportunities, attract new customers, detect fraud, reduce risk, and improve government service delivery.SPSS Modeler’s visual interface invites users to apply their specific business expertise, which leads to more powerful predictive models and shortens time-to-solution. SPSS Modeler offers many modeling techniques, such as prediction, classification, segmentation, and association detection algorithms. Once models are created, IBM® SPSS® Modeler Solution Publisher enables their delivery enterprise-wide to decision makers or to a database.
About IBM Business Analytics
IBM Business Analytics software delivers complete, consistent and accurate information that decision-makers trust to improve business performance. A comprehensive portfolio ofbusiness intelligence,predictive analytics,financial performance and strategy management, andanalytic applicationsprovides clear, immediate and actionable insights into current performance and the ability to predict future outcomes. Combined with rich industry solutions, proven practices and professional services, organizations of every size can drive the highest productivity, confidently automate decisions and deliver better results.
As part of this portfolio, IBM SPSS Predictive Analytics software helps organizations predict future events and proactively act upon that insight to drive better business outcomes. Commercial, government and academic customers worldwide rely on IBM SPSS technology as a competitive advantage in attracting, retaining and growing customers, while reducing fraud and mitigating risk. By incorporating IBM SPSS software into their daily operations, organizations become predictive enterprises – able to direct and automate decisions to meet business goals and achieve measurable competitive advantage. For further information or to reach a representative visit http://www.ibm.com/spss.
Technical support
Technical support is available to maintenance customers. Customers may contact Technical Support for assistance in using IBM Corp. products or for installation help for one of the supported hardware environments. To reach Technical Support, see the IBM Corp. web site athttp://www.ibm.com/support. Be prepared to identify yourself, your organization, and your support agreement when requesting assistance.
1
About IBM SPSS Modeler
1
IBM SPSS Modeler Products . . . 1
IBM SPSS Modeler . . . 1
IBM SPSS Modeler Server . . . 2
IBM SPSS Modeler Administration Console . . . 2
IBM SPSS Modeler Batch . . . 2
IBM SPSS Modeler Solution Publisher. . . 2
IBM SPSS Modeler Server Adapters for IBM SPSS Collaboration and Deployment Services . 2 IBM SPSS Modeler Editions . . . 3
IBM SPSS Modeler Documentation . . . 4
SPSS Modeler Professional Documentation. . . 4
SPSS Modeler Premium Documentation . . . 5
Application Examples . . . 5
Demos Folder . . . 6
2
New Features
7
New and Changed Features in IBM SPSS Modeler 15 . . . 7New features in IBM SPSS Modeler Professional . . . 7
New features in IBM SPSS Modeler Premium . . . .10
New Nodes in This Release . . . .10
3
IBM SPSS Modeler Overview
12
Getting Started . . . .12Starting IBM SPSS Modeler . . . .12
Launching from the Command Line . . . .13
Connecting to IBM SPSS Modeler Server . . . .13
Changing the Temp Directory . . . .16
Starting Multiple IBM SPSS Modeler Sessions . . . .17
IBM SPSS Modeler Interface at a Glance . . . .17
IBM SPSS Modeler Stream Canvas . . . .18
Nodes Palette . . . .18
IBM SPSS Modeler Managers. . . .19
IBM SPSS Modeler Projects . . . .20
IBM SPSS Modeler Toolbar . . . .21
Customizing the Toolbar . . . .23
Customizing the IBM SPSS Modeler Window. . . .23
Changing the icon size for a stream . . . .24
Using the Mouse in IBM SPSS Modeler . . . .26
Using Shortcut Keys . . . .26
Printing. . . .27
Automating IBM SPSS Modeler . . . .27
4
Understanding Data Mining
29
Data Mining Overview . . . .29Assessing the Data. . . .30
A Strategy for Data Mining . . . .32
The CRISP-DM Process Model . . . .32
Types of Models . . . .34
Data Mining Examples . . . .40
5
Building Streams
41
Stream-Building Overview . . . .41Building Data Streams . . . .41
Working with Nodes . . . .42
Working with Streams . . . .53
Stream Descriptions . . . .74
Running Streams . . . .77
Working with Models. . . .78
Adding Comments and Annotations to Nodes and Streams . . . .78
Saving Data Streams . . . .88
Loading Files . . . .90
Mapping Data Streams . . . .91
Tips and Shortcuts . . . .96
6
Handling Missing Values
99
Overview of Missing Values . . . .99Handling Missing Values. . . 100
Handling Records with Missing Values . . . 101
Handling Fields with Missing Values . . . 101
Imputing or Filling Missing Values. . . 102
CLEM Functions for Missing Values . . . 102
CLEM Examples . . . 108
Values and Data Types . . . 110
Expressions and Conditions . . . 111
Stream, Session, and SuperNode Parameters. . . 112
Working with Strings . . . 112
Handling Blanks and Missing Values. . . 113
Working with Numbers . . . 114
Working with Times and Dates . . . 114
Summarizing Multiple Fields . . . 115
Working with Multiple-Response Data . . . 117
The Expression Builder . . . 117
Accessing the Expression Builder . . . 119
Creating Expressions . . . 119
Selecting Functions . . . 120
Selecting Fields, Parameters, and Global Variables . . . 121
Viewing or Selecting Values. . . 122
Checking CLEM Expressions . . . 123
Find and Replace . . . 123
8
CLEM Language Reference
127
CLEM Reference Overview . . . 127CLEM Datatypes . . . 127
Integers. . . 128
Reals . . . 128
Characters . . . 128
Strings. . . 129
Lists. . . 129
Fields. . . 129
Dates. . . 129
Time . . . 130
CLEM Operators . . . 131
Functions Reference. . . 133
Conventions in Function Descriptions . . . 133
Information Functions . . . 134
Conversion Functions . . . 135
Comparison Functions . . . 135
Logical Functions. . . 137
Numeric Functions . . . 138
Trigonometric Functions . . . 139
Probability Functions . . . 139
Bitwise Integer Operations . . . 140
Random Functions . . . 141
String Functions. . . 141
SoundEx Functions . . . 146
Date and Time Functions . . . 146
Sequence Functions . . . 150
Global Functions . . . 155
Functions Handling Blanks and Null Values . . . 156
Special Fields . . . 157
9
Using IBM SPSS Modeler with a Repository
158
About the IBM SPSS Collaboration and Deployment Services Repository . . . 158Storing and Deploying Repository Objects . . . 160
Connecting to the Repository . . . 161
Entering Credentials for the Repository . . . 162
Browsing the Repository Contents . . . 162
Storing Objects in the Repository . . . 164
Setting Object Properties. . . 164
Storing Streams. . . 170
Storing Projects. . . 170
Storing Nodes . . . 171
Storing Output Objects. . . 171
Storing Models and Model Palettes . . . 172
Retrieving Objects from the Repository . . . 172
Choosing an Object to Retrieve . . . 173
Selecting an Object Version . . . 174
Searching for Objects in the Repository . . . 175
Modifying Repository Objects . . . 177
Creating, Renaming, and Deleting Folders . . . 177
Locking and Unlocking Repository Objects. . . 177
Deleting Repository Objects. . . 178
Managing Properties of Repository Objects . . . 179
Viewing Folder Properties . . . 179
Viewing and Editing Object Properties . . . 180
Managing Object Version Labels . . . 183
10 Exporting to External Applications
195
About Exporting to External Applications . . . 195
Opening a Stream in IBM SPSS Modeler Advantage. . . 195
Importing and Exporting Models as PMML . . . 196
Model Types Supporting PMML . . . 198
11 Projects and Reports
200
Introduction to Projects . . . 200CRISP-DM View. . . 201
Classes View . . . 202
Building a Project . . . 202
Creating a New Project . . . 202
Adding to a Project . . . 203
Transferring Projects to the IBM SPSS Collaboration and Deployment Services Repository . 204 Setting Project Properties . . . 205
Annotating a Project . . . 206
Object Properties. . . 208
Closing a Project . . . 209
Generating a Report . . . 209
Saving and Exporting Generated Reports . . . 212
12 Customizing IBM SPSS Modeler
215
Customizing IBM SPSS Modeler Options . . . 215Setting IBM SPSS Modeler Options . . . 215
System Options . . . 215
Setting Default Directories. . . 216
Setting User Options . . . 217
Setting User Information . . . 222
Customizing the Nodes Palette . . . 223
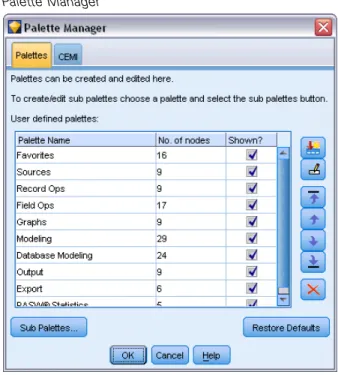
Customizing the Palette Manager . . . 223
Changing a Palette Tab View . . . 228
CEMI Node Management . . . 229
13 Performance Considerations for Streams and Nodes
230
Order of Nodes . . . 230Node Caches . . . 231
Performance: Process Nodes. . . 233
Performance: Modeling Nodes . . . 234
Performance: CLEM Expressions . . . 234
Appendices
A Accessibility in IBM SPSS Modeler
236
Overview of Accessibility in IBM SPSS Modeler . . . 236Types of Accessibility Support . . . 236
Accessibility for the Visually Impaired . . . 236
Accessibility for Blind Users . . . 237
Keyboard Accessibility . . . 238
Using a Screen Reader . . . 245
Tips for Use . . . 246
Interference with Other Software . . . 247
JAWS and Java . . . 247
Using Graphs in IBM SPSS Modeler . . . 247
B Unicode Support
248
Unicode Support in IBM SPSS Modeler . . . 248Index
252
Chapter
1
1
1
1
About IBM SPSS Modeler
IBM® SPSS® Modeler is a set of data mining tools that enable you to quickly develop predictive models using business expertise and deploy them into business operations to improve decision making. Designed around the industry-standard CRISP-DM model, SPSS Modeler supports the entire data mining process, from data to better business results.
SPSS Modeler offers a variety of modeling methods taken from machine learning, artificial intelligence, and statistics. The methods available on the Modeling palette allow you to derive new information from your data and to develop predictive models. Each method has certain strengths and is best suited for particular types of problems.
SPSS Modeler can be purchased as a standalone product, or used as a client in combination with SPSS Modeler Server. A number of additional options are also available, as summarized in the following sections. For more information, see http://www.ibm.com/software/analytics/spss/products/modeler/.
IBM SPSS Modeler Products
The IBM® SPSS® Modeler family of products and associated software comprises the following. IBM SPSS Modeler
IBM SPSS Modeler Server
IBM SPSS Modeler Administration Console IBM SPSS Modeler Batch
IBM SPSS Modeler Solution Publisher
IBM SPSS Modeler Server adapters for IBM SPSS Collaboration and Deployment Services
IBM SPSS Modeler
SPSS Modeler is a functionally complete version of the product that you install and run on your personal computer. You can run SPSS Modeler in local mode as a standalone product, or use it in distributed mode along with IBM® SPSS® Modeler Server for improved performance on large data sets.
With SPSS Modeler, you can build accurate predictive models quickly and intuitively, without programming. Using the unique visual interface, you can easily visualize the data mining process. With the support of the advanced analytics embedded in the product, you can discover previously hidden patterns and trends in your data. You can model outcomes and understand the factors that influence them, enabling you to take advantage of business opportunities and mitigate risks. SPSS Modeler is available in two editions: SPSS Modeler Professional and SPSS Modeler Premium. For more information, see the topicIBM SPSS Modeler Editionson p. 3.
IBM SPSS Modeler Server
SPSS Modeler uses a client/server architecture to distribute requests for resource-intensive operations to powerful server software, resulting in faster performance on larger data sets. SPSS Modeler Server is a separately-licensed product that runs continually in distributed analysis mode on a server host in conjunction with one or more IBM® SPSS® Modeler installations. In this way, SPSS Modeler Server provides superior performance on large data sets because memory-intensive operations can be done on the server without downloading data to the client computer. IBM® SPSS® Modeler Server also provides support for SQL optimization and in-database modeling capabilities, delivering further benefits in performance and automation.
IBM SPSS Modeler Administration Console
The Modeler Administration Console is a graphical application for managing many of the SPSS Modeler Server configuration options, which are also configurable by means of an optionsfile. The application provides a console user interface to monitor and configure your SPSS Modeler Server installations, and is available free-of-charge to current SPSS Modeler Server customers. The application can be installed only on Windows computers; however, it can administer a server installed on any supported platform.
IBM SPSS Modeler Batch
While data mining is usually an interactive process, it is also possible to run SPSS Modeler from a command line, without the need for the graphical user interface. For example, you might have long-running or repetitive tasks that you want to perform with no user intervention. SPSS Modeler Batch is a special version of the product that provides support for the complete analytical capabilities of SPSS Modeler without access to the regular user interface. An SPSS Modeler Server license is required to use SPSS Modeler Batch.
IBM SPSS Modeler Solution Publisher
SPSS Modeler Solution Publisher is a tool that enables you to create a packaged version of an SPSS Modeler stream that can be run by an external runtime engine or embedded in an external application. In this way, you can publish and deploy complete SPSS Modeler streams for use in environments that do not have SPSS Modeler installed. SPSS Modeler Solution Publisher is distributed as part of the IBM SPSS Collaboration and Deployment Services - Scoring service, for which a separate license is required. With this license, you receive SPSS Modeler Solution Publisher Runtime, which enables you to execute the published streams.
IBM SPSS Modeler Server Adapters for IBM SPSS Collaboration and Deployment
Services
A number of adapters for IBM® SPSS® Collaboration and Deployment Services are available that enable SPSS Modeler and SPSS Modeler Server to interact with an IBM SPSS Collaboration and Deployment Services repository. In this way, an SPSS Modeler stream deployed to the repository
3 About IBM SPSS Modeler can be shared by multiple users, or accessed from the thin-client application IBM SPSS Modeler Advantage. You install the adapter on the system that hosts the repository.
IBM SPSS Modeler Editions
SPSS Modeler is available in the following editions.
SPSS Modeler Professional
SPSS Modeler Professional provides all the tools you need to work with most types of structured data, such as behaviors and interactions tracked in CRM systems, demographics, purchasing behavior and sales data.
SPSS Modeler Premium
SPSS Modeler Premium is a separately-licensed product that extends SPSS Modeler Professional to work with specialized data such as that used for entity analytics or social networking, and with unstructured text data. SPSS Modeler Premium comprises the following components.
IBM® SPSS® Modeler Entity Analyticsadds a completely new dimension to IBM® SPSS® Modeler predictive analytics. Whereas predictive analytics attempts to predict future behavior from past data, entity analytics focuses on improving the coherence and consistency of current data by resolving identity conflicts within the records themselves. An identity can be that of an individual, an organization, an object, or any other entity for which ambiguity might exist. Identity resolution can be vital in a number offields, including customer relationship management, fraud detection, anti-money laundering, and national and international security.
IBM SPSS Modeler Social Network Analysistransforms information about relationships into fields that characterize the social behavior of individuals and groups. Using data describing the relationships underlying social networks, IBM® SPSS® Modeler Social Network Analysis identifies social leaders who influence the behavior of others in the network. In addition, you can determine which people are most affected by other network participants. By combining these results with other measures, you can create comprehensive profiles of individuals on which to base your predictive models. Models that include this social information will perform better than models that do not.
IBM® SPSS® Modeler Text Analyticsuses advanced linguistic technologies and Natural Language Processing (NLP) to rapidly process a large variety of unstructured text data, extract and organize the key concepts, and group these concepts into categories. Extracted concepts and categories can be combined with existing structured data, such as demographics, and applied to modeling using the full suite of SPSS Modeler data mining tools to yield better and more focused decisions.
IBM SPSS Modeler Documentation
Documentation in online help format is available from the Help menu of SPSS Modeler. This includes documentation for SPSS Modeler, SPSS Modeler Server, and SPSS Modeler Solution Publisher, as well as the Applications Guide and other supporting materials.
Complete documentation for each product (including installation instructions) is available in PDF format under the\Documentationfolder on each product DVD. Installation documents can also be downloaded from the web athttp://www-01.ibm.com/support/docview.wss?uid=swg27023172. Documentation in both formats is also available from the SPSS Modeler Information Center at http://publib.boulder.ibm.com/infocenter/spssmodl/v15r0m0/.
SPSS Modeler Professional Documentation
The SPSS Modeler Professional documentation suite (excluding installation instructions) is as follows.
IBM SPSS Modeler User’s Guide.General introduction to using SPSS Modeler, including how to build data streams, handle missing values, build CLEM expressions, work with projects and reports, and package streams for deployment to IBM SPSS Collaboration and Deployment Services, Predictive Applications, or IBM SPSS Modeler Advantage.
IBM SPSS Modeler Source, Process, and Output Nodes.Descriptions of all the nodes used to read, process, and output data in different formats. Effectively this means all nodes other than modeling nodes.
IBM SPSS Modeler Modeling Nodes.Descriptions of all the nodes used to create data mining models. IBM® SPSS® Modeler offers a variety of modeling methods taken from machine learning, artificial intelligence, and statistics.
IBM SPSS Modeler Algorithms Guide.Descriptions of the mathematical foundations of the modeling methods used in SPSS Modeler. This guide is available in PDF format only. IBM SPSS Modeler Applications Guide. The examples in this guide provide brief, targeted
introductions to specific modeling methods and techniques. An online version of this guide is also available from the Help menu. For more information, see the topicApplication Exampleson p. 5.
IBM SPSS Modeler Scripting and Automation.Information on automating the system through scripting, including the properties that can be used to manipulate nodes and streams. IBM SPSS Modeler Deployment Guide. Information on running SPSS Modeler streams and
scenarios as steps in processing jobs under IBM® SPSS® Collaboration and Deployment Services Deployment Manager.
IBM SPSS Modeler CLEF Developer’s Guide.CLEF provides the ability to integrate third-party programs such as data processing routines or modeling algorithms as nodes in SPSS Modeler. IBM SPSS Modeler In-Database Mining Guide.Information on how to use the power of your
database to improve performance and extend the range of analytical capabilities through third-party algorithms.
IBM SPSS Modeler Server Administration and Performance Guide. Information on how to configure and administer IBM® SPSS® Modeler Server.
5 About IBM SPSS Modeler
IBM SPSS Modeler Administration Console User Guide.Information on installing and using the console user interface for monitoring and configuring SPSS Modeler Server. The console is implemented as a plug-in to the Deployment Manager application.
IBM SPSS Modeler Solution Publisher Guide.SPSS Modeler Solution Publisher is an add-on component that enables organizations to publish streams for use outside of the standard SPSS Modeler environment.
IBM SPSS Modeler CRISP-DM Guide.Step-by-step guide to using the CRISP-DM methodology for data mining with SPSS Modeler.
IBM SPSS Modeler Batch User’s Guide.Complete guide to using IBM SPSS Modeler in batch mode, including details of batch mode execution and command-line arguments. This guide is available in PDF format only.
SPSS Modeler Premium Documentation
The SPSS Modeler Premium documentation suite (excluding installation instructions) is as follows.
IBM SPSS Modeler Entity Analytics User Guide. Information on using entity analytics with SPSS Modeler, covering repository installation and configuration, entity analytics nodes, and administrative tasks.
IBM SPSS Modeler Social Network Analysis User Guide.A guide to performing social network analysis with SPSS Modeler, including group analysis and diffusion analysis.
SPSS Modeler Text Analytics User’s Guide. Information on using text analytics with SPSS Modeler, covering the text mining nodes, interactive workbench, templates, and other resources.
IBM SPSS Modeler Text Analytics Administration Console User Guide.Information on installing and using the console user interface for monitoring and configuring IBM® SPSS® Modeler Server for use with SPSS Modeler Text Analytics . The console is implemented as a plug-in to the Deployment Manager application.
Application Examples
While the data mining tools in SPSS Modeler can help solve a wide variety of business and organizational problems, the application examples provide brief, targeted introductions to specific modeling methods and techniques. The data sets used here are much smaller than the enormous data stores managed by some data miners, but the concepts and methods involved should be scalable to real-world applications.
You can access the examples by clickingApplication Exampleson the Help menu in SPSS Modeler. The datafiles and sample streams are installed in theDemosfolder under the product installation directory. For more information, see the topicDemos Folderon p. 6.
Database modeling examples.See the examples in theIBM SPSS Modeler In-Database Mining Guide.
Demos Folder
The datafiles and sample streams used with the application examples are installed in theDemos folder under the product installation directory. This folder can also be accessed from theIBM SPSS Modeler 15program group on the Windows Start menu, or by clickingDemoson the list of recent directories in the File Open dialog box.
Figure 1-1
Chapter
2
2
2
2
New Features
New and Changed Features in IBM SPSS Modeler 15
From this release onwards, IBM® SPSS® Modeler has the following editions.
IBM® SPSS® Modeler Professionalis the new name for the existing SPSS Modeler product. IBM® SPSS® Modeler Premiumis a separately-licensed product that provides additional
features to those supplied by SPSS Modeler Professional.
The new features for these editions are described in the following sections.
New features in IBM SPSS Modeler Professional
The IBM® SPSS® Modeler Professional edition adds the following features in this release. GLMM modeling node.Generalized linear mixed models (GLMMs) extend the linear model so that: the target is linearly related to the factors and covariates via a specified link function; the target can have a non-normal distribution; and the observations can be correlated. Generalized linear mixed models cover a wide variety of models, from simple linear regression to complex multilevel models for non-normal longitudinal data. For more information, see the topicNew Nodes in This Releaseon p. 10.
Support for maps in the Graphboard node.The Graphboard node now includes support for a large number of map types. These include choropleths (where regions can be given different colors or patterns to indicate different values) and point overlay maps (where geospatial points are overlaid on the map).
IBM® SPSS® Modeler ships with several mapfiles, but you can use the Map Conversion Utility to convert your existing map shapefiles for use with the Graphboard Template Chooser.
Netezza Time Series and Generalized Linear nodes. Two new nodes are available for IBM® Netezza® Analytics in-database mining: Time Series and Generalized Linear. For more information, see the topicNew Nodes in This Releaseon p. 10.
Netezza nodes enabled through Helper Applications. The Netezza Analytics database modeling nodes are now enabled in the same way as the other database modeling nodes.
Zooming in and out on the stream view.It is now possible to scale the entire stream view up or down from the standard size. This feature is particularly useful for gaining an overall view of a complex stream, or for minimizing the number of pages needed to print a stream. For more information, see the topicChanging the icon size for a streamin Chapter 3 on p. 24.
Default settings for database connections. You can now specify default settings for SQL Server and Oracle database connections, as well as those already supported for IBM DB2 InfoSphere Warehouse.
Stream properties and optimization redesign.The Options tab on the Stream Properties dialog box has been redesigned to group the options into categories. The Optimization options have also moved from User Options to Stream Properties. For more information, see the topicSetting Options for Streamsin Chapter 5 on p. 54.
Node execution timing. You can now set an option to display individual execution times for the nodes in a stream. For more information, see the topicViewing Node Execution Timesin Chapter 5 on p. 67.
You can also set an option (time_ecode_execution_log) in the server configurationfile to record these execution times in the message log.
Stream parameters in SQL queries from Database source node.You can now include SPSS Modeler stream parameters in SQL queries that you enter in the Database source node.
Expression Builder supports in-database functions. If a stream connects to a database through a Database source node and you use the Expression Builder with a downstream node, you can include in-database functions from the connected database directly in the expression you are building. For more information, see the topicSelecting Functionsin Chapter 7 on p. 120. IBM Cognos BI node enhancements.The Cognos BI source node now supports importing Cognos list reports as well as data, and additionally supports the use of parameters andfilters.
For the Cognos BI source and export nodes, SPSS Modeler now automatically detects the version of IBM Cognos BI in use.
Enhancements to Aggregate node. The Aggregate node now supports several new aggregation modes for aggregatefields: median, count, variance, andfirst and third quartiles.
Merge node supports conditional merge.You can now perform input record merges that depend on satisfying a condition. You can specify the condition directly in the node, or build the condition using the Expression Builder.
Enhancements to in-database mining nodes for IBM DB2 InfoSphere Warehouse. For in-database mining with IBM DB2 InfoSphere Warehouse, the ISW Clustering node now supports the Enhanced BIRCH algorithm in addition to demographic and Kohonen clustering. In addition, the ISW Association node provides a choice of layout for non-transactional (tabular) data.
Table compression for database export. When exporting to a database, you can now specify table compression options for SQL Server and Oracle database connections, as well as those already supported for IBM DB2 InfoSphere Warehouse.
Bulk loading for database export.Additional help information is available for database bulk loading using an external loader program.
9 New Features SQL generation enhancements.The Aggregate node now supports SQL generation for date, time, timestamp, and string data types, in addition to integer and real. With IBM Netezza databases, the Sample node supports SQL generation for simple and complex sampling, and the Binning node supports SQL generation for all binning methods except Tiles.
In-database model scoring. For IBM DB2 for z/OS, IBM Netezza and Teradata databases, it is possible to enable SQL pushback of many of the model nuggets to carry out model scoring (as opposed to in-database mining) within the database. To do this, you can install a scoring adapter into the database. When you publish a model for the scoring adapter, the model is enabled to use the user-defined function (UDF) capabilities of the database to perform the scoring.
A new configuration option,db_udf_enabledinoptions.cfg, causes the SQL generation option to generate UDF SQL by default.
New format for database connection in batch mode.The format for specifying a database connection in batch mode has changed to a single argument, to be consistent with the way it is specified in scripting.
Enhancements to SPSS Statistics integration.On the Statistics Output node, additional procedures are available on the Syntax tab through theSelect a dialogbutton. The Regression submenu now supports Partial Least Squares regression, and there is a new Forecasting submenu with the following options: Spectral Analysis, Sequence Charts, Autocorrelations, and Cross-correlations. For more information, see the SPSS Statistics documentation.
The Syntax tab of the Statistics Output node also has a new option to generate a Statistics File source node for importing the data that results from running a stream containing the node. This is useful where a procedure writesfields such as scores to the active dataset in addition to displaying output, as thesefields would otherwise not be visible.
Non-root user on UNIX servers.If you have SPSS Modeler Server installed on a UNIX server, you can now install, configure, and start and stop SPSS Modeler Server as a non-root user without the need for a private password database.
Deployed streams can now access IBM SPSS Collaboration and Deployment Services model management features.When a stream is deployed to IBM SPSS Collaboration and Deployment Services as a stream, it can now use the same model management features as it could if deployed as a scenario. These features include evaluation, refresh, score, and champion/challenger.
Improved method of changing ODBC connection for SPSS Modeler stream and scenario job steps.For stream and scenario job steps in IBM SPSS Collaboration and Deployment Services, changes to an ODBC connection and related logon credentials apply to all related job steps. This means that you no longer have to change the job steps one by one.
Choice of execution branch in deployed streams. For stream job steps in IBM SPSS Collaboration and Deployment Services, if the stream contains branches you can now choose one or more stream branches to execute.
New features in IBM SPSS Modeler Premium
IBM® SPSS® Modeler Premium is a separately-licensed product that provides additional features to those supplied by IBM® SPSS® Modeler Professional. Previously, SPSS Modeler Premium included only IBM® SPSS® Modeler Text Analytics . The full set of SPSS Modeler Premium features is now as follows.
SPSS Modeler Text Analytics
IBM® SPSS® Modeler Entity Analytics
IBM® SPSS® Modeler Social Network Analysis
SPSS Modeler Text Analyticsuses advanced linguistic technologies and Natural Language Processing (NLP) to rapidly process a large variety of unstructured text data, extract and organize the key concepts, and group these concepts into categories. Extracted concepts and categories can be combined with existing structured data, such as demographics, and applied to modeling using the full suite of IBM® SPSS® Modeler data mining tools to yield better and more focused decisions.
IBM SPSS Modeler Entity Analyticsadds a completely new dimension to SPSS Modeler predictive analytics. Whereas predictive analytics attempts to predict future behavior from past data, entity analytics focuses on improving the coherence and consistency of current data by resolving identity conflicts within the records themselves. An identity can be that of an individual, an organization, an object, or any other entity for which ambiguity might exist. Identity resolution can be vital in a number offields, including customer relationship management, fraud detection, anti-money laundering, and national and international security.
IBM SPSS Modeler Social Network Analysistransforms information about relationships into fields that characterize the social behavior of individuals and groups. Using data describing the relationships underlying social networks, IBM SPSS Modeler Social Network Analysis identifies social leaders who influence the behavior of others in the network. In addition, you can determine which people are most affected by other network participants. By combining these results with other measures, you can create comprehensive profiles of individuals on which to base your predictive models. Models that include this social information will perform better than models that do not.
Note: SPSS Modeler Professional must be installed before installing any of the SPSS Modeler Premium features.
New Nodes in This Release
IBM SPSS Modeler ProfessionalA generalized linear mixed model (GLMM) extends the linear model so that the target can have a non-normal distribution, is linearly related to the factors and covariates via a specified link function, and so that the observations can be correlated. Generalized linear mixed models cover a wide variety of models, from simple linear regression to complex multilevel models for non-normal longitudinal data.
11 New Features The Netezza Time Series node analyzes time series data and can predict future behavior from past events.
The Netezza Generalized Linear model expands the linear regression model so that the dependent variable is related to the predictor variables by means of a specified link function. Moreover, the model allows for the dependent variable to have a non-normal distribution.
IBM SPSS Modeler Premium
The EA Export node is a terminal node that reads entity data from a data source and exports the data to a repository for the purpose of entity resolution.
The Entity Analytics(EA) source node reads the resolved entities from the repository and passes this data to the stream for further processing, such as formatting into a report.
The Streaming EA node compares new cases against the entity data in the repository.
The SNA Group Analysis node builds a model of a social network based on input data about the social groupings within the network. This technique identifies links between the group members, and analyzes the interactions within the groups to produce key performance indicators (KPIs). The KPIs can be used for purposes such as churn prediction, anomaly detection, or group leader identification.
The SNA Diffusion Analysis node models theflow of information from a group member to their social environment. A group member is assigned an initial weighting, which is propagated across the network as a gradually reducingfigure. This process continues until each member of the network has been assigned a weighting relative to the original group member, according to the amount of information that has reached them. The individual member scores are then derived directly from these weightings. In this way, for example, a service provider could identify customers that are at a higher risk of churn according to their relationship with a recent churner.
3
3
3
3
IBM SPSS Modeler Overview
Getting Started
As a data mining application, IBM® SPSS® Modeler offers a strategic approach tofinding useful relationships in large data sets. In contrast to more traditional statistical methods, you do not necessarily need to know what you are looking for when you start. You can explore your data, fitting different models and investigating different relationships, until youfind useful information.
Starting IBM SPSS Modeler
To start the application, click:Start > [All] Programs > IBM SPSS Modeler15 > IBM SPSS Modeler15
The main window is displayed after a few seconds. Figure 3-1
IBM SPSS Modeler main application window
13 IBM SPSS Modeler Overview
Launching from the Command Line
You can use the command line of your operating system to launch IBM® SPSS® Modeler as follows:
E On a computer where IBM® SPSS® Modeler is installed, open a DOS, or command-prompt, window.
E To launch the SPSS Modeler interface in interactive mode, type themodelerclientcommand followed by the required arguments; for example:
modelerclient -stream report.str -execute
The available arguments (flags) allow you to connect to a server, load streams, run scripts, or specify other parameters as needed.
Connecting to IBM SPSS Modeler Server
IBM® SPSS® Modeler can be run as a standalone application, or as a client connected to IBM® SPSS® Modeler Server directly or to an SPSS Modeler Server or server cluster through the Coordinator of Processes plug-in from IBM® SPSS® Collaboration and Deployment Services. The current connection status is displayed at the bottom left of the SPSS Modeler window.
Whenever you want to connect to a server, you can manually enter the server name to which you want to connect or select a name that you have previously defined. However, if you have IBM SPSS Collaboration and Deployment Services, you can search through a list of servers or server clusters from the Server Login dialog box. The ability to browse through the Statistics services running on a network is made available through the Coordinator of Processes.
Figure 3-2
To Connect to a Server
E On the Tools menu, clickServer Login. The Server Login dialog box opens. Alternatively, double-click the connection status area of the SPSS Modeler window.
E Using the dialog box, specify options to connect to the local server computer or select a connection from the table.
ClickAddorEditto add or edit a connection. For more information, see the topicAdding and Editing the IBM SPSS Modeler Server Connectionon p. 14.
ClickSearchto access a server or server cluster in the Coordinator of Processes. For more information, see the topicSearching for Servers in IBM SPSS Collaboration and Deployment Serviceson p. 16.
Server table. This table contains the set of defined server connections. The table displays the default connection, server name, description, and port number. You can manually add a new connection, as well as select or search for an existing connection. To set a particular server as the default connection, select the check box in the Default column in the table for the connection. Default data path.Specify a path used for data on the server computer. Click the ellipsis button(...) to browse to the required location.
Set Credentials.Leave this box unchecked to enable thesingle sign-onfeature, which attempts to log you in to the server using your local computer username and password details. If single sign-on is not possible, or if you check this box to disable single sign-on (for example, to log in to an administrator account), the followingfields are enabled for you to enter your credentials. User ID.Enter the user name with which to log on to the server.
Password. Enter the password associated with the specified user name.
Domain.Specify the domain used to log on to the server. A domain name is required only when the server computer is in a different Windows domain than the client computer.
E ClickOKto complete the connection.
To Disconnect from a Server
E On the Tools menu, clickServer Login. The Server Login dialog box opens. Alternatively, double-click the connection status area of the SPSS Modeler window.
E In the dialog box, select the Local Server and clickOK.
Adding and Editing the IBM SPSS Modeler Server Connection
You can manually edit or add a server connection in the Server Login dialog box. By clicking Add, you can access an empty Add/Edit Server dialog box in which you can enter server connection details. By selecting an existing connection and clicking Edit in the Server Login dialog box, the Add/Edit Server dialog box opens with the details for that connection so that you can make any changes.
15 IBM SPSS Modeler Overview Note: You cannot edit a server connection that was added from IBM® SPSS® Collaboration and Deployment Services, since the name, port, and other details are defined in IBM SPSS Collaboration and Deployment Services.
Figure 3-3
Server Login Add/Edit Server dialog box
To Add Server Connections
E On the Tools menu, clickServer Login. The Server Login dialog box opens. E In this dialog box, clickAdd. The Server Login Add/Edit Server dialog box opens.
E Enter the server connection details and clickOKto save the connection and return to the Server Login dialog box.
Server.Specify an available server or select one from the list. The server computer can be identified by an alphanumeric name (for example,myserver) or an IP address assigned to the server computer (for example, 202.123.456.78).
Port.Give the port number on which the server is listening. If the default does not work, ask your system administrator for the correct port number.
Description.Enter an optional description for this server connection.
Ensure secure connection (use SSL).Specifies whether an SSL (Secure Sockets Layer) connection should be used. SSL is a commonly used protocol for securing data sent over a network. To use this feature, SSL must be enabled on the server hosting IBM® SPSS® Modeler Server. If necessary, contact your local administrator for details.
To Edit Server Connections
E On the Tools menu, clickServer Login. The Server Login dialog box opens.
E In this dialog box, select the connection you want to edit and then clickEdit. The Server Login Add/Edit Server dialog box opens.
E Change the server connection details and clickOKto save the changes and return to the Server Login dialog box.
Searching for Servers in IBM SPSS Collaboration and Deployment Services
Instead of entering a server connection manually, you can select a server or server cluster available on the network through the Coordinator of Processes, available in IBM® SPSS® Collaboration and Deployment Services. A server cluster is a group of servers from which the Coordinator of Processes determines the server best suited to respond to a processing request.
Although you can manually add servers in the Server Login dialog box, searching for available servers lets you connect to servers without requiring that you know the correct server name and port number. This information is automatically provided. However, you still need the correct logon information, such as username, domain, and password.
Note: If you do not have access to the Coordinator of Processes capability, you can still manually enter the server name to which you want to connect or select a name that you have previously defined. For more information, see the topicAdding and Editing the IBM SPSS Modeler Server Connectionon p. 14.
Figure 3-4
Search for Servers dialog box
To search for servers and clusters
E On the Tools menu, clickServer Login. The Server Login dialog box opens.
E In this dialog box, clickSearchto open the Search for Servers dialog box. If you are not logged on to IBM SPSS Collaboration and Deployment Services when you attempt to browse the Coordinator of Processes, you will be prompted to do so. For more information, see the topicConnecting to the Repositoryin Chapter 9 on p. 161.
E Select the server or server cluster from the list.
E ClickOKto close the dialog box and add this connection to the table in the Server Login dialog box.
Changing the Temp Directory
Some operations performed by IBM® SPSS® Modeler Server may require temporaryfiles to be created. By default, IBM® SPSS® Modeler uses the system temporary directory to create temp files. You can alter the location of the temporary directory using the following steps.
17 IBM SPSS Modeler Overview E Editoptions.cfg, located in the/configdirectory of your SPSS Modeler installation directory. Edit
thetemp_directoryparameter in thisfile to read: temp_directory, "C:/spss/servertemp".
E After doing this, you must restart the SPSS Modeler Server service. You can do this by clicking theServicestab on your Windows Control Panel. Just stop the service and then start it to activate the changes you made. Restarting the machine will also restart the service.
All tempfiles will now be written to this new directory.
Note: The most common error when you are attempting to do this is to use the wrong type of slashes. Because of SPSS Modeler’s UNIX history, forward slashes are used.
Starting Multiple IBM SPSS Modeler Sessions
If you need to launch more than one IBM® SPSS® Modeler session at a time, you must make some changes to your IBM® SPSS® Modeler and Windows settings. For example, you may need to do this if you have two separate server licenses and want to run two streams against two different servers from the same client machine.
To enable multiple SPSS Modeler sessions: E Click:
Start > [All] Programs > IBM SPSS Modeler15
E On the IBM SPSS Modeler15 shortcut (the one with the icon), right-click and selectProperties. E In theTargettext box, add-noshareto the end of the string.
E In Windows Explorer, select: Tools > Folder Options...
E On the File Types tab, select the SPSS Modeler Stream option and clickAdvanced. E In the Edit File Type dialog box, selectOpen with SPSS Modelerand clickEdit.
E In theApplication used to perform actiontext box, add-nosharebefore the-streamargument.
IBM SPSS Modeler Interface at a Glance
At each point in the data mining process, IBM® SPSS® Modeler’s easy-to-use interface invites your specific business expertise. Modeling algorithms, such as prediction, classification, segmentation, and association detection, ensure powerful and accurate models. Model results can easily be deployed and read into databases, IBM® SPSS® Statistics, and a wide variety of other applications.
Working with SPSS Modeler is a three-step process of working with data. First, you read data into SPSS Modeler.
Next, you run the data through a series of manipulations. Finally, you send the data to a destination.
This sequence of operations is known as adata streambecause the dataflows record by record from the source through each manipulation and,finally, to the destination—either a model or type of data output.
Figure 3-5 A simple stream
IBM SPSS Modeler Stream Canvas
The stream canvas is the largest area of the IBM® SPSS® Modeler window and is where you will build and manipulate data streams.
Streams are created by drawing diagrams of data operations relevant to your business on the main canvas in the interface. Each operation is represented by an icon ornode, and the nodes are linked together in astreamrepresenting theflow of data through each operation.
You can work with multiple streams at one time in SPSS Modeler, either in the same stream canvas or by opening a new stream canvas. During a session, streams are stored in the Streams manager, at the upper right of the SPSS Modeler window.
Nodes Palette
Most of the data and modeling tools in IBM® SPSS® Modeler reside in theNodes Palette, across the bottom of the window below the stream canvas.
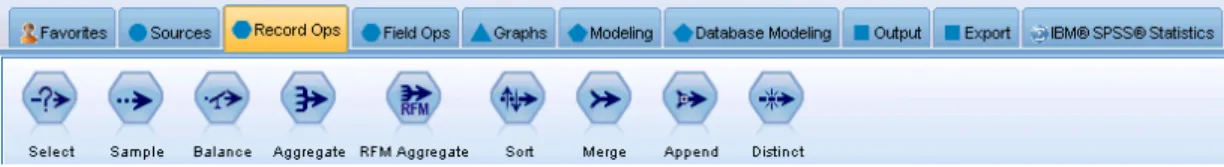
For example, the Record Ops palette tab contains nodes that you can use to perform operations on the datarecords, such as selecting, merging, and appending.
To add nodes to the canvas, double-click icons from the Nodes Palette or drag and drop them onto the canvas. You then connect them to create astream, representing theflow of data. Figure 3-6
Record Ops tab on the nodes palette
Each palette tab contains a collection of related nodes used for different phases of stream operations, such as:
Sources. Nodes bring data into SPSS Modeler.
Record Ops. Nodes perform operations on datarecords, such as selecting, merging, and appending.
19 IBM SPSS Modeler Overview
Field Ops.Nodes perform operations on datafields, such asfiltering, deriving newfields, and determining the measurement level for givenfields.
Graphs. Nodes graphically display data before and after modeling. Graphs include plots, histograms, web nodes, and evaluation charts.
Modeling. Nodes use the modeling algorithms available in SPSS Modeler, such as neural nets, decision trees, clustering algorithms, and data sequencing.
Database Modeling. Nodes use the modeling algorithms available in Microsoft SQL Server, IBM DB2, and Oracle databases.
Output. Nodes produce a variety of output for data, charts, and model results that can be viewed in SPSS Modeler.
Export. Nodes produce a variety of output that can be viewed in external applications, such as IBM® SPSS® Data Collection or Excel.
SPSS Statistics.Nodes import data from, or export data to, IBM® SPSS® Statistics, as well as running SPSS Statistics procedures.
As you become more familiar with SPSS Modeler, you can customize the palette contents for your own use. For more information, see the topicCustomizing the Nodes Palettein Chapter 12 on p. 223.
Located below the Nodes Palette, a report pane provides feedback on the progress of various operations, such as when data is being read into the data stream. Also located below the Nodes Palette, a status pane provides information on what the application is currently doing, as well as indications of when user feedback is required.
IBM SPSS Modeler Managers
At the top right of the window is the managers pane. This has three tabs, which are used to manage streams, output and models.
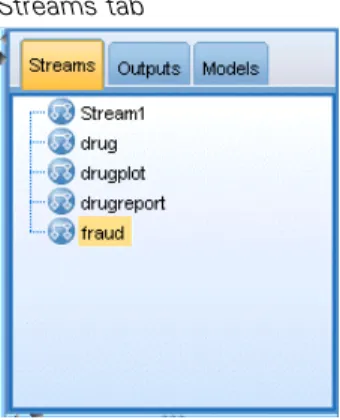
You can use the Streams tab to open, rename, save, and delete the streams created in a session. Figure 3-7
Streams tab
The Outputs tab contains a variety offiles, such as graphs and tables, produced by stream operations in IBM® SPSS® Modeler. You can display, save, rename, and close the tables, graphs, and reports listed on this tab.
Figure 3-8 Outputs tab
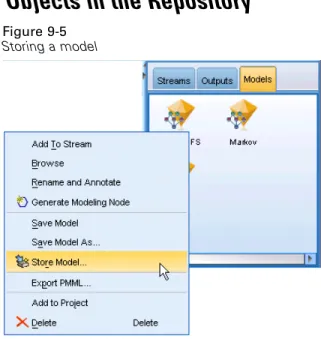
The Models tab is the most powerful of the manager tabs. This tab contains all modelnuggets, which contain the models generated in SPSS Modeler, for the current session. These models can be browsed directly from the Models tab or added to the stream in the canvas.
Figure 3-9
Models tab containing model nuggets
IBM SPSS Modeler Projects
On the lower right side of the window is the project pane, used to create and manage data mining projects(groups offiles related to a data mining task). There are two ways to view projects you create in IBM® SPSS® Modeler—in the Classes view and the CRISP-DM view.
The CRISP-DM tab provides a way to organize projects according to the Cross-Industry Standard Process for Data Mining, an industry-proven, nonproprietary methodology. For both experienced andfirst-time data miners, using the CRISP-DM tool will help you to better organize and communicate your efforts.
21 IBM SPSS Modeler Overview Figure 3-10
CRISP-DM view
The Classes tab provides a way to organize your work in SPSS Modeler categorically—by the types of objects you create. This view is useful when taking inventory of data, streams, and models.
Figure 3-11 Classes view
IBM SPSS Modeler Toolbar
At the top of the IBM® SPSS® Modeler window, you willfind a toolbar of icons that provides a number of useful functions. Following are the toolbar buttons and their functions.
Create new stream Open stream
Cut & move to clipboard Copy to clipboard
Paste selection Undo last action
Redo Search for nodes
Edit stream properties Preview SQL generation
Run current stream Run stream selection
Stop stream (Active only while
stream is running) Add SuperNode
Zoom in (SuperNodes only) Zoom out (SuperNodes only)
No markup in stream Insert comment
Hide stream markup (if any) Show hidden stream markup
Open stream in IBM® SPSS® Modeler Advantage
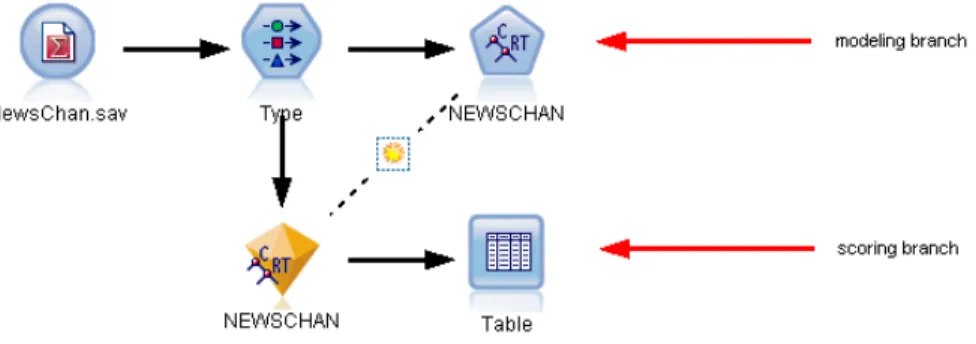
Stream markup consists of stream comments, model links, and scoring branch indications. For more information on stream comments, seeAdding Comments and Annotations to Nodes and Streams on p. 78.
For more information on scoring branch indications, seeThe Scoring Branch on p. 188. Model links are described in theIBM SPSS Modeling Nodesguide.
23 IBM SPSS Modeler Overview
Customizing the Toolbar
You can change various aspects of the toolbar, such as: Whether it is displayed
Whether the icons have tooltips available Whether it uses large or small icons To turn the toolbar display on and off: E On the main menu, click:
View > Toolbar > Display
To change the tooltip or icon size settings: E On the main menu, click:
View > Toolbar > Customize
ClickShow ToolTipsorLarge Buttonsas required.
Customizing the IBM SPSS Modeler Window
Using the dividers between various portions of the IBM® SPSS® Modeler interface, you can resize or close tools to meet your preferences. For example, if you are working with a large stream, you can use the small arrows located on each divider to close the nodes palette, managers pane, and project pane. This maximizes the stream canvas, providing enough work space for large or multiple streams.
Alternatively, on the View menu, clickNodes Palette,Managers, orProjectto turn the display of these items on or off.
Figure 3-12
Maximized stream canvas
As an alternative to closing the nodes palette, and the managers and project panes, you can use the stream canvas as a scrollable page by moving vertically and horizontally with the scrollbars at the side and bottom of the SPSS Modeler window.
You can also control the display of screen markup, which consists of stream comments, model links, and scoring branch indications. To turn this display on or off, click:
View > Stream Markup
Changing the icon size for a stream
You can change the size of the stream icons in the following ways. Through a stream property setting
Through a pop-up menu in the stream Using the keyboard
You can scale the entire stream view to one of a number of sizes between 8% and 200% of the standard icon size.
25 IBM SPSS Modeler Overview Figure 3-13
Changing the icon size
To scale the entire stream (stream properties method) E From the main menu, choose
Tools > Stream Properties > Options > Layout. E Choose the size you want from the Icon Size menu. E ClickApplyto see the result.
E ClickOKto save the change.
To scale the entire stream (menu method)
E Right-click the stream background on the canvas. E ChooseIcon Sizeand select the size you want.
To scale the entire stream (keyboard method)
E Press Ctrl + [-] on the main keyboard to zoom out to the next smaller size. E Press Ctrl + Shift + [+] on the main keyboard to zoom in to the next larger size.
This feature is particularly useful for gaining an overall view of a complex stream. You can also use it to minimize the number of pages needed to print a stream.
Using the Mouse in IBM SPSS Modeler
The most common uses of the mouse in IBM® SPSS® Modeler include the following: Single-click. Use either the right or left mouse button to select options from menus, open
pop-up menus, and access various other standard controls and options. Click and hold the button to move and drag nodes.
Double-click. Double-click using the left mouse button to place nodes on the stream canvas and edit existing nodes.
Middle-click. Click the middle mouse button and drag the cursor to connect nodes on the stream canvas. Double-click the middle mouse button to disconnect a node. If you do not have a three-button mouse, you can simulate this feature by pressing the Alt key while clicking and dragging the mouse.
Using Shortcut Keys
Many visual programming operations in IBM® SPSS® Modeler have shortcut keys associated with them. For example, you can delete a node by clicking the node and pressing the Delete key on your keyboard. Likewise, you can quickly save a stream by pressing the S key while holding down the Ctrl key. Control commands like this one are indicated by a combination of Ctrl and another key—for example, Ctrl+S.
There are a number of shortcut keys used in standard Windows operations, such as Ctrl+X to cut. These shortcuts are supported in SPSS Modeler along with the following application-specific shortcuts.
Note: In some cases, old shortcut keys used in SPSS Modeler conflict with standard Windows shortcut keys. These old shortcuts are supported with the addition of the Alt key. For example, Ctrl+Alt+C can be used to toggle the cache on and off.
Table 3-1
Supported shortcut keys Shortcut
Key
Function Ctrl+A Select all Ctrl+X Cut Ctrl+N New stream Ctrl+O Open stream Ctrl+P Print Ctrl+C Copy Ctrl+V Paste Ctrl+Z Undo
Ctrl+Q Select all nodes downstream of the selected node Ctrl+W Deselect all downstream nodes (toggles with Ctrl+Q) Ctrl+E Run from selected node
Ctrl+S Save current stream Alt+Arrow
keys
Move selected nodes on the stream canvas in the direction of the arrow used
27 IBM SPSS Modeler Overview Table 3-2
Supported shortcuts for old hot keys Shortcut
Key
Function Ctrl+Alt+D Duplicate node Ctrl+Alt+L Load node Ctrl+Alt+R Rename node
Ctrl+Alt+U Create User Input node Ctrl+Alt+C Toggle cache on/off Ctrl+Alt+F Flush cache Ctrl+Alt+X Expand SuperNode Ctrl+Alt+Z Zoom in/zoom out Delete Delete node or connection
Printing
The following objects can be printed in IBM® SPSS® Modeler: Stream diagrams
Graphs Tables
Reports (from the Report node and Project Reports)
Scripts (from the stream properties, Standalone Script, or SuperNode script dialog boxes) Models (Model browsers, dialog box tabs with current focus, tree viewers)
Annotations (using the Annotations tab for output)
To print an object:
To print without previewing, click the Print button on the toolbar. To set up the page before printing, selectPage Setupfrom the File menu. To preview before printing, selectPrint Previewfrom the File menu.
To view the standard print dialog box with options for selecting printers, and specifying appearance options, selectPrintfrom the File menu.
Automating IBM SPSS Modeler
Since advanced data mining can be a complex and sometimes lengthy process, IBM® SPSS® Modeler includes several types of coding and automation support.
Control Language for Expression Manipulation(CLEM) is a language for analyzing and manipulating the data thatflows along SPSS Modeler streams. Data miners use CLEM extensively in stream operations to perform tasks as simple as deriving profit from cost and
revenue data or as complex as transforming web log data into a set offields and records with usable information. For more information, see the topicAbout CLEMin Chapter 7 on p. 105. Scriptingis a powerful tool for automating processes in the user interface. Scripts can
perform the same kinds of actions that users perform with a mouse or a keyboard. You can set options for nodes and perform derivations using a subset of CLEM. You can also specify output and manipulate generated models.
Chapter
4
4
4
4
Understanding Data Mining
Data Mining Overview
Through a variety of techniques,data miningidentifies nuggets of information in bodies of data. Data mining extracts information in such a way that it can be used in areas such as decision support, prediction, forecasts, and estimation. Data is often voluminous but of low value and with little direct usefulness in its raw form. It is the hidden information in the data that has value.
In data mining, success comes from combining your (or your expert’s) knowledge of the data with advanced, active analysis techniques in which the computer identifies the underlying relationships and features in the data. The process of data mining generates models from historical data that are later used for predictions, pattern detection, and more. The technique for building these models is calledmachine learningormodeling.
Modeling Techniques
IBM® SPSS® Modeler includes a number of machine-learning and modeling technologies, which can be roughly grouped according to the types of problems they are intended to solve.
Predictive modeling methods include decision trees, neural networks, and statistical models. Clustering models focus on identifying groups of similar records and labeling the records
according to the group to which they belong. Clustering methods include Kohonen,k-means, and TwoStep.
Association rules associate a particular conclusion (such as the purchase of a particular product) with a set of conditions (the purchase of several other products).
Screening models can be used to screen data to locatefields and records that are most likely to be of interest in modeling and identify outliers that may notfit known patterns. Available methods include feature selection and anomaly detection.
Data Manipulation and Discovery
SPSS Modeler also includes many facilities that let you apply your expertise to the data:
Data manipulation.Constructs new data items derived from existing ones and breaks down the data into meaningful subsets. Data from a variety of sources can be merged andfiltered. Browsing and visualization.Displays aspects of the data using the Data Audit node to perform
an initial audit including graphs and statistics. Advanced visualization includes interactive graphics, which can be exported for inclusion in project reports.
Statistics. Confirms suspected relationships between variables in the data. Statistics from IBM® SPSS® Statistics can also be used within SPSS Modeler.
Hypothesis testing. Constructs models of how the data behaves and verifies these models.
Typically, you will use these facilities to identify a promising set of attributes in the data. These attributes can then be fed to the modeling techniques, which will attempt to identify underlying rules and relationships.
Typical Applications
Typical applications of data mining techniques include the following:
Direct mail. Determine which demographic groups have the highest response rate. Use this information to maximize the response to future mailings.
Credit scoring. Use an individual’s credit history to make credit decisions.
Human resources. Understand past hiring practices and create decision rules to streamline the hiring process.
Medical research. Create decision rules that suggest appropriate procedures based on medical evidence.
Market analysis. Determine which variables, such as geography, price, and customer characteristics, are associated with sales.
Quality control. Analyze data from product manufacturing and identify variables determining product defects.
Policy studies. Use survey data to formulate policy by applying decision rules to select the most important variables.
Health care.User surveys and clinical data can be combined to discover variables that contribute to health.
Terminology
The termsattribute,field, andvariablerefer to a single data item common to all cases under consideration. A collection of attribute values that refers to a specific case is called arecord, an example, or acase.
Assessing the Data
Data mining is not likely to be fruitful unless the data you want to use meets certain criteria. The following sections present some of the aspects of the data and its application that you should consider.
Ensure that the data is available
This may seem obvious, but be aware that although data might be available, it may not be in a form that can be used easily. IBM® SPSS® Modeler can import data from databases (through ODBC) or fromfiles. The data, however, might be held in some other form on a machine that cannot be directly accessed. It will need to be downloaded or dumped in a suitable form before it can be used. It might be scattered among different databases and sources and need to be pulled