The Optimum Level of Well-Being
Can People Be Too Happy?
Shigehiro Oishi,
1Ed Diener,
2and Richard E. Lucas
31
University of Virginia,
2University of Illinois, and
3Michigan State University
ABSTRACT—Psychologists, self-help gurus, and parents all work to make their clients, friends, and children happier. Recent research indicates that happiness is functional and generally leads to success. However, most people are al-ready above neutral in happiness, which raises the ques-tion of whether higher levels of happiness facilitate more effective functioning than do lower levels. Our analyses of large survey data and longitudinal data show that people who experience the highest levels of happiness are the most successful in terms of close relationships and volunteer work, but that those who experience slightly lower levels of happiness are the most successful in terms of income, education, and political participation. Once people are moderately happy, the most effective level of happiness appears to depend on the specific outcomes used to define success, as well as the resources that are available.
Despite the fact that most people are already satisfied with their lives (Diener & Diener, 1996), many people aspire to be even happier. There are hundreds of self-help books, motivational speakers, and life coaches whose primary goal is to improve sub-jective well-being. In light of these attempts to boost well-being, it is necessary to question whether being happier is always better. Is it sensible for a society to encourage already happy people to aspire to even higher levels of well-being?1The present article focuses on the differences between moderately happy and very happy people to address questions about the optimal level of happiness.
The issues of optimal happiness are not merely academic. In recent years, psychologists and economists have increasingly called for large-scale projects that track national levels of well-being over time. The ultimate goal of these proposed national indexes of well-being is to enable decision-makers to use in-formation about a population’s well-being to guide public policy
(Diener & Seligman, 2004; Kahneman, Kruger, Schkade, Schwarz, & Stone, 2004). However, these proposals implicitly raise the question of how happy nations should be. Policies may be put in place that reliably increase positive emotions and life satisfaction, but if these increases result in negative conse-quences for the individuals who experience them, then the policies would not effectively fulfill their original purpose. Similarly, issues regarding optimal levels of happiness affect individual decision makers. People often make important life decisions (such as the decisions to get married, divorce their current partner, change jobs, or move across the country) based in part on the predicted level of life satisfaction that would re-sult. Numerous studies have shown that these predictions can be wrong (Wilson & Gilbert, 2003). But an even more basic ques-tion concerns the practicality of the initial desire. Can people’s expectations for happiness sometimes be set too high, and can these expectations lead to negative outcomes for the individual? We will begin our review by addressing the concept of hap-piness. We will also summarize why people seek happiness and discuss its various benefits. Then, we will develop the argument that although happiness has positive consequences in general, being happier is not always better. Once a moderate level of happiness is achieved, further increases can sometimes be detrimental. In support of our argument, we report empirical findings from a large cross-sectional project, an intense data collection study, and four large longitudinal studies.
THE CONCEPT OF HAPPINESS
Philosophers have debated the definition of happiness for mil-lennia without reaching a definitive consensus (see Sumner, 1996, for review). The concept of happiness differs, sometimes substantially, across theorists. For Aristotle, the realization of one’s potential was a critical ingredient of happiness, or eudaimonia(Waterman, 1990), whereas for Bentham, happiness consisted of the presence of pleasure and absence of pain (Tatarkiewicz, 1976). Similarly, according to some contempo-rary theorists, happiness emerges when several specific life conditions are met, such as self-acceptance, environmental mastery, personal growth, and relatedness (Ryan & Deci, 2001; Address correspondence to Shigehiro Oishi, Department of
Psy-chology, University of Virginia, P.O. Box 400400, Charlottesville, VA 22904-4400; e-mail: soishi@virginia.edu.
1There is a similar debate on the dark side of excessively high self-esteem
(see Baumeister, Campbell, Krueger, & Vohs, 2003, Crocker & Park, 2004; Pyszczynski & Cox, 2004).
Ryff, 1989). Others, however, fall in line with the tradition of Bentham by defining happiness as the average online experi-ence of pleasure and pain, (Kahneman, 1999). In this article, we use the termhappinessinterchangeably with subjective well-being or the subjective evaluation of one’s life. We conceptualize happiness as being hierarchically organized to emphasize complexity of the concept (see Diener, Scollon, & Lucas, 2003, for more detail). The highest level of the abstraction is happi-ness, which is a summary judgment of one’s life. That is, we do not use the termhappinessto refer to the momentary feeling state of happiness. Rather, we use this term to refer to a relatively stable feeling of happiness one has towards his or her life. Al-though we review the studies on the momentary mood of hap-piness below, when doing so, we will note this fact to distinguish it from the relatively stable feeling of happiness. At the next level of hierarchy, there are four components of happiness: pleasant emotions, unpleasant emotions, life satisfaction, and domain satisfaction. Each of these can be further dissected into specific aspects of life experiences (e.g., love, worry, meaning, health). Although these four components are correlated with one another (e.g., individuals who often feel pleasant emotions tend to be satisfied with their lives as a whole), they are distin-guishable from one another (e.g., Lucas, Diener, & Suh, 1996). Similarly, none of the individual components can be equated with overall happiness or subjective well-being. However, because we analyzed data that had been already collected, we use specific components of happiness as proxies to the concept of happiness in the empirical part of this article.
HAPPINESS AS THE OBJECTIVE OF LIFE: WHY DO PEOPLE PURSUE HAPPINESS?
People seek happiness for a multiplicity of reasons. In his chapter on ‘‘The Objective of Life,’’ Aristotle reasoned that happiness is the ultimate goal of life because ‘‘we choose it for itself, and never for any other reason’’ (Thomson, 1953, p. 73). In contrast, all other aspirations (e.g., money, health, reputation, friendship) are instrumental goals pursued in order to meet higher goals, including happiness. Thus, according to Aristotle, it is only rational that happiness is the ultimate objective in life. Once we have happiness, we have all that we want. Although it is possible to debate the extent to which Aristotle’s concept of eudaimonia maps on to modern ideas of happiness, it is certainly the case that he included felicitous spirits as one component of the state (i.e., when an individual has fulfilled one’s potentials, she is likely to feel happy as well). In addition, later philoso-phers explicitly equated pleasurable experience with well-being and quality of life. In particular, the utilitarian theorists, such as Jeremy Bentham and J.S. Mill, went so far as to suggest that the principle of promoting the greatest amount of pleasure for the greatest number of people should be the bedrock of morality.
Yet there are also more practical reasons why people pursue happiness. For instance, happiness is believed to reflect the
extent to which one’s life is going well (Sumner, 1996). Being happy implies success, whereas not being happy implies failure (King & Napa, 1998). It is no surprise then that many Americans strive for happiness and even feel pressure to be happy (Suh & Koo, in press). There are also hedonic reasons to value happi-ness. Ordinary citizens, including many who have not read Aristotle, recognize that happiness is pleasant and that unhap-piness is unpleasant (Diener, 2000). People consider hapunhap-piness and pleasantness to be conceptually similar, and indeed, they usually experience these two emotions together (Schimmack, 2006). It simply feels good to be happy, and all organisms are motivated to approach things that bring pleasure and to avoid things that bring pain. Not surprisingly, lay people also recog-nize the importance of the emotion in their lives. In a recent large international survey led by Ed Diener and with over 10,000 respondents from 48 nations (Diener & Oishi, 2006), the average importance rating of happiness was the highest of the 12 possible attributes, with a mean of 8.03 on a 1 to 9 scale (compared with 7.54 for ‘‘success,’’ 7.39 for ‘‘intelligence/ knowledge,’’ and 6.84 for ‘‘material wealth’’).
Because both moral philosophers and lay people point to happiness as the ultimate goal that drives more immediate de-sires, initial research in the area focused on identifying the factors that would allow people to achieve this important goal. Specifically, early research focused on identifying predictors of high subjective well-being (see Diener, Suh, Lucas, & Smith, 1999, for review). Yet more recently, psychologists have begun to acknowledge that happiness is not just an end state that results when things go well. Instead, happiness may also be functional. On the basis of this theory, researchers have begun to system-atically examine the consequences of happiness beyond simply feeling good. Lyubomirsky, King, and Diener (2005) conducted a meta-analysis of 225 papers on diverse life outcomes in the domains of work, love, and health and found that, in all three domains, happy people did better on average than did unhappy people. For instance, happy people receive higher job perfor-mance assessments from their supervisors (Cropanzano & Wright, 1999) and have more prestigious jobs (Roberts, Caspi, & Moffitt, 2003). In addition, happy people earn higher incomes than do unhappy people, even many years after the initial as-sessment (Diener, Nickerson, Lucas, & Sandvik, 2002). Happy people are more likely to get married than are their unhappy counterparts (Lucas, Clark, Georgellis, & Diener, 2003), and they are also more satisfied with their marriages (Ruvolo, 1998). Psychologists even live longer if they express more positive emotions and humor in their autobiographies (Pressman, Cohen, & Kollnesher, 2006).
OPTIMAL LEVELS OF HAPPINESS: IS HAPPIER ALWAYS BETTER?
As summarized above, happiness is associated with many desir-able life outcomes (Lyubomirsky et al., 2005). However, is
happier always better? Emotions likely evolved to solve specific problems that humans faced in their lives (Damasio, 1994; Darwin, 1872; Frijda, 1988; Schwarz, 1990). For example, fear helps people avoid danger (Mowrer, 1939) and prepare for stressful situations (Janis, 1968), anxiety can motivate people to work harder and to perform better (Norem & Cantor, 1986; Svanum & Zody, 2001), and guilt and shame can motivate people to avoid moral transgressions (Baumeister, Stillwell, & Heath-erton, 1994). Indeed, although negative affect is unpleasant and often avoided, individuals who experience an absence of neg-ative affect often suffer negneg-ative consequences. For instance, it has been suggested that psychopaths (who show little startle reflex; Patrick, Bradley, & Lang, 1993) may have a deficit of certain negative emotions, which leads to moral deficiencies and poor social functioning.
Even when we move beyond specific emotions, it is possible to find examples where unpleasant states motivate beneficial action. Consider the work domain. Job dissatisfaction can be thought of as a signal that the work environment does not fit one’s personality and skills. Thus, job dissatisfaction might motivate job change. In fact, a longitudinal study in Switzerland showed that work dissatisfaction predicted job turnover (Semmer, Tsc-han, Elfering, Ka¨lin, & Grebner, in press) and that those who changed jobs experienced a subsequent increase in job satis-faction in their new job. This study suggests that individuals who are dissatisfied but make efforts to change their life circum-stances can improve their satisfaction. Conversely, individuals who consistently experience positive affect and never experi-ence dissatisfaction might be less likely to make a change to improve their life circumstances. Thus, a very high level of satisfaction might lead individuals to fail to attain their full potential.
Although positive moods induced in the laboratory are gen-erally associated with more creativity and better cognitive per-formance (see Fredrickson, 2001; Isen, 1999, for review), in some circumstances, positive moods are associated with inferior cognitive performance. For instance, in a syllogism task, par-ticipants in a positive mood condition performed significantly worse than did participants in the control condition (Melton, 1995). Participants in a positive mood condition also performed more poorly at a moral reasoning task than did those in neutral or sad mood conditions (Zarinpoush, Cooper, & Moylan, 2000). Similarly, participants in a positive mood condition performed worse than did participants in control or negative mood condi-tions in an estimation of correlation task (Sinclair & Marks, 1995). Finally, participants in a positive mood condition were repeatedly shown to use stereotypes in a person-perception task more frequently than did those in a neutral mood condition (e.g., Bodenhausen, Kramer, & Su¨sser, 1994).
It is clear that positive moods can occasionally have an ad-verse influence on life outcomes. In addition, negative moods can help individuals deal with specific problems that require distinct cognitive approaches to arrive at an optimal solution
(see Schwarz, 2002, for review). Thus, these studies suggest that people who experience appropriate amounts of negative affect can adopt their cognitive strategy to the task at hand. The question then becomes whether these short-term effects of induced mood translate into long-term differences among those who tend to experience very high levels of these feelings. For instance, in the mood studies, there is an experimentally induced change in participant’s affect (e.g., from neutral to happy or from neutral to sad). Thus, the effect of induced mood can be driven mainly by the shift in one’s mood. Because indi-vidual differences in stable levels of happiness do not involve the temporary shift in mood, the translation of these induced mood effects to individual differences in chronic levels of happiness is problematic. Indeed, few studies have addressed this complex issue explicitly. However, several have provided results that support the idea that very high levels of happiness could be detrimental if they produce positive moods in situations where those feelings provide inappropriate cues to thought and action. For instance, although positive affect has been found to be predictive of longevity among nuns (Danner, Snowdon, & Friesen, 2001), psychologists (Pressman et al., 2006), and nu-merous other populations (Pressman & Cohen, 2005), a longi-tudinal study of the intellectually gifted participants in the Terman project showed that childhood cheerfulness rated by teachers and parents was inversely associated with risk of mortality (Friedman et al., 1993). Specifically, individuals who were in the 75th percentile of cheerfulness when they were 10 or 11 years old were estimated to be 21% more likely to die at any given time than were those who were in the 25th percentile. Moreover, childhood cheerfulness in this sample was associated with more drinking, cigarette smoking, and risky hobbies and activities in adulthood (Martin et al., 2002).
In the only study we know of that has directly addressed the detrimental effects of high levels of positive affect, Fredrickson and Losada (2005) found that students who were flourishing experienced more positive emotions than negative ones at a ratio of 3.2 to 1 in one study and 3.4 to 1 in a second sample. However, these researchers also cautioned that positive-to-negative ratios that were too high were also detrimental. According to their computer simulation based on Lorenz’s (1993) chaos theory, ratios above 11.6 led to performance that is suboptimal. Specifically, behavioral repertoires became more and more rigid. This study points to potential undesirable out-comes associated with an excessive amount of positive affect combined with an extreme lack of negative affect (see also Schwartz, 1997; Schwartz & Garamoni, 1989, for a similar idea). In addition, it is not difficult to find anecdotes that could be explained by this account of the detrimental effect of overly positive evaluations. For instance, an active 77-year-old California woman went out to bike during a deadly heat wave, even though her family begged her not to go. She was later found dead of heat stroke (Steinhauer, 2006). Similarly, Maurice Wilson, a man with no mountain climbing experience decided
to climb Mount Everest by first crashing a plane on the side of the mountain and then making his way to the top. However, he was later found frozen with his tent wrapped around him, and experts seriously doubt that he made it to the peak. In short, although positive affect and optimism are generally associated with positive outcomes, extreme levels of happiness might have a detrimental effect. These findings and anecdotes point to the possibility that the benefits of positive affect may vary, depending on individuals’ life circumstances and the life out-come in consideration (see Kaufman & Baer, 2002, for the link between bipolar depression and poetry). Moreover, the literature summarized above suggests that the relation between happiness and various life outcomes may be nonlinear; that is, happier is not always better.
WHEN SHOULD HAPPIER BE BETTER?
To gain a better understanding of the optimal level of happiness, we first examine the positive consequences of happiness for in various life domains. According to most models of ideal func-tioning, successful individuals are characterized as those who have loving relationships and contribute to society via their work and civic engagements (e.g., Allport, 1961; Keyes & Haidt, 2002; Maslow, 1971; Peterson & Seligman, 2004; Rogers, 1961; Ryan & Deci, 2001; Ryff & Singer, 1998; Sheldon, 2004). Al-though no perfect measures of success in these domains exist, numerous proxy variables can be obtained. Close relationships, volunteer work, and political participation are believed to capture loving relationships and the civic engagement of well-functioning individuals. Personal income and educational achievement can be thought of as imperfect proxies for the degree to which society values a person’s work.
We first predict that a moderate level of happiness is best for life outcomes that require self-improvement motivation and analytical skills. These include such outcomes as academic achievement, job performance, and income. In these domains, slight dissatisfaction with the current situation can serve as motivation to achieve more, earn more money, and obtain more education. For instance, individuals who are completely satis-fied with their current job situations might be less likely to acquire additional schooling to improve their credentials or apply for a new, more challenging job that has higher pay. Furthermore, being moderately happy may allow for optimal flexibility when dealing with novel situations. For example, the moderately happy individual may more readily experience worry when a mental heuristic is not working. Thus, he or she may adapt more quickly to new tasks when old strategies do not succeed. We also predict that outcomes related to political participation and civic engagement will be highest when hap-piness is moderate. Because political participation is motivated in part by dissatisfaction with current political situations (Klandermans, 1989), those who are completely satisfied may feel little motivation to effect change. Similarly, volunteer work
is motivated by the desire to improve the status quo. Thus, we predict that the optimal level of happiness in this domain will not be the highest level of happiness, but a moderate level of happiness.
In contrast, we predict that the optimal level of happiness for a stable intimate relationship is the highest level of happiness (rather than a more moderate level). Individuals who are not completely satisfied with their current lives are more likely to actively change their life circumstances, such as by searching for alternative partners, than are those who are extremely sat-isfied with their lives (e.g., Rusbult, 1980). Indeed, positive illusions about one’s partner are instrumental in establishing and maintaining intimacy and relationship stability (Murray, Holmes, & Griffin, 2003). Thus, it might be that the highest levels of happiness lead to the best social relationships.
One other possibility that we explore is whether the optimal level of happiness depends not just on the domain, but on one’s circumstances. A happy person in relatively bad circumstances could experience very different outcomes than would a happy person in desirable circumstances. Being very happy in a rela-tively bad environment might lead to complacency, just as happy workers in less-than-ideal working conditions did not seek to improve their situations (Semmer et al., in press). Because hap-piness signals that things are going well (Schwarz, 1990), happy individuals are less likely to initiate changes in life circum-stances. When life conditions are indeed ideal, this situation is not a problem. However, if life circumstances are far from ideal and some of the circumstances can be changed, too much hap-piness might become an impediment to positive changes in life. Few, if any, studies have been specifically designed to explore optimal level of happiness (however, see Maslow, 1971; Rogers, 1961; Sheldon, 2004, for insightful discussions). The current investigation extends previous work on the benefits of happiness (such as Lyubomirsky et al., 2005) by asking for the first time the question ‘‘How much happiness is optimal?’’ (however, see Oishi & Koo, in press, for a preliminary effort). We will next analyze several data sets that allow us to empirically test the optimal level of happiness for various life domains.
OPTIMAL LEVEL OF HAPPINESS FOR CURRENT SUCCESS
World Values Survey Data
To examine optimal levels of happiness in broad samples, we first analyzed the World Values Survey, which was administered in 1981, 1990, 1995, and 2000. The sample included 118,519 respondents from 96 countries and regions around the world (see www.worldvaluessurvey.org for more information about the survey questions and samples). Respondents rated their overall life satisfaction on a 10-point scale (in response to the question, ‘‘All things considered, how satisfied are you with your life as a whole these days?’’). They also indicated their income (in deciles from the lowest 10% in the nation to the highest 10% of
the nation), highest education completed, their relationship status (i.e., whether they were currently in a stable long-term relationship), volunteer work they participated in (respondents indicated which, if any, of the 15 types of volunteer work they were involved in), and political actions they had taken (e.g., signing a petition, joining in boycotts). These questions were embedded in more than 200 questions about values and beliefs. Here, we consider income, highest education completed, rela-tionship status, volunteer work, and political participation. Despite imperfections, these measures provide indicators of success and successful functioning (see Lyubomirsky et al., 2005, for similar criteria).
For analysis of these data, we used a regression analysis in which each outcome variable was predicted from the linear well-being score (i.e., the original responses provided by partici-pants) and a dummy variable that tests nonlinearity at the highest end of happiness. Specifically, the dummy variable was coded such that the highest level of well-being is 1 and the rest are coded 0. In the World Values Survey, the linear well-being score was the 10-point life satisfaction score, ranging from 1 to 10. The key dummy code here treated scores of 1 to 9 as 0 and 10 as 1. If the dummy variable is significantly lower than 0, this indicates that extremely satisfied individuals scored signifi-cantly lower than expected based on the linear model.
Our predictions concerning income, education, and political participation were supported, as the highest levels of income, education, and political participation were reported not by the most satisfied individuals (10 on the 10-point scale), but by moderately satisfied individuals (8 or 9 on the 10-point scale, see Table 1). Our prediction regarding close relationships was also supported, as the highest proportion of respondents in a stable intimate relationship was observed among both the very satisfied (10 on the 10-point scale) and satisfied individuals (9 on the 10-point scale). Contrary to our prediction, the highest level of volunteer activities was observed among the very sat-isfied individuals. This suggests that the motivations that drive volunteer work may be more similar to those that drive rela-tionship variables than to those the drive political action (see Discussion for more detail).
We next tested the linear and nonlinear models by the re-gression analysis described above. As predicted, respondents who were very satisfied with their lives (10 on the 10-point scale) earned significantly less money than expected based on a pure linear model,B5 0.92,SE50.03,b5 .13,t(101860)5
35.70,p<.001. In addition, very satisfied individuals com-pleted significantly less education than expected based on the linear model,B5 0.78,SE50.02,b5 .12,t(116330)5
34.30, p < .001. Furthermore, very satisfied respondents engaged in political activity significantly less than expected based on the linear model,B5 0.24,SE50.01,b5 .09, t(110759)5 24.09,p<.001. In contrast, the nonlinear effect of happiness on stable intimate relationship was not significant, B5 0.01,SE50.01,b5 .004,t(40677)5 0.78,p5.44.
Likewise, the respondents who were very satisfied with their lives engaged in even more volunteer activities than expected based on the linear model, B 5 0.20, SE5 0.02, b 5 .04, t(75721)510.31,p<.001. In sum, the highest possible level of life satisfaction was superior in terms of volunteer work and relationship status, whereas moderately high levels of life sat-isfaction were best in terms of income, education, and political participation.
Illinois Data
As a second approach to testing the optimal level of happiness, we turned to a semester-long intensive data collection project conducted with students from the University of Illinois. As in the World Values Survey, participants completed a number of measures related to achievement and conscientiousness. In addition, they completed a variety of measures in the social relationships domain. Finally, respondents reported their affect on a daily basis over a period of approximately 7 weeks. Using these reports, we divided participants into groups based on affect balance—the degree to which positive affect was expe-rienced more frequently than negative affect. The very happy subjects reported feeling positive emotions most of the time and rarely feeling negative emotions, whereas the unhappy respon-dents reported feeling negative emotions more frequently than positive ones. Unhappy respondents were defined as individuals with a negative affect balance score (reporting feeling more negative emotions than positive ones), and this group was only 5% of the sample. The slightly happy group comprised individuals whose positive emotion score exceeded their nega-tive emotion score by 0 or 1 point. Similarly, the preponderance of positive to negative feelings for the other groups was as fol-lows: moderately happy51.01–2.00 points; happy52.01–3.00 points; and very happy5above 3.00 points (12% of the sample). We replicated the findings from the World Values Survey in this college data set. As expected, the second happiest group (labeled ‘‘Happy’’ in Table 2) performed best on all four achievement/conscientiousness measures such as grades and number of missed classes. In contrast, the happiest group (la-beled ‘‘Very happy’’ in Table 2) scored highest in all five social measures such as time spent dating and the number of close friends. Significance testing mostly confirmed the visual in-spection of the data above, showing that the nonlinear pattern for the highest affect-balance group held for three of the four achievement/conscientiousness measures but did not hold for any of the social measures. Grade point average (GPA) showed a significant linear trend for affect balance,B50.18,SE50.05, b5.32,t(191)53.40,p<.001, as well as a significant non-linear trend for the happiest group,B5 0.43,SE50.16,b5
.25,t(191)52.64,p<.01. Namely, general affect balance was positively associated with GPA except at the highest end of happiness. Very happy people did not receive as high a GPA as expected from the linear model. Similarly, affect balance was positively associated with the event balance score (i.e., how
TABLE 1
The Optimal Level of Happiness Life satisfaction
rating
Men Women
N M SD N M SD
Income
1 2,815 3.25 2.142 2,887 3.09 2.040
2 2,034 4.20 2.379 2,167 3.99 2.343
3 3,039 3.82 2.137 2,975 3.64 2.141
4 3,043 4.06 2.150 2,997 3.88 2.194
5 7,259 4.22 2.120 7,600 4.02 2.181
6 4,812 4.65 2.312 5,063 4.34 2.286
7 6,748 5.07 2.418 6,400 4.73 2.400
8 8,516 5.37 2.532 8,472 5.03 2.526
9 5,406 5.58 2.568 5,623 5.23 2.581
10 6,620 4.88 2.530 7,355 4.61 2.531
Total 50,292 4.71 2.457 51,540 4.44 2.442
Education
1 3,092 3.90 2.110 3,192 3.82 2.180
2 2,233 4.06 2.303 2,398 3.68 2.269
3 3,279 4.19 2.258 3,266 3.91 2.286
4 3,321 4.32 2.190 3,306 4.16 2.255
5 8,066 4.38 2.262 8,610 4.05 2.270
6 5,432 4.53 2.203 5,788 4.20 2.253
7 7,733 4.75 2.222 7,475 4.49 2.268
8 9,824 4.82 2.198 10,011 4.66 2.252
9 6,242 4.79 2.285 6,709 4.56 2.321
10 7,565 4.22 2.272 8,756 4.05 2.252
Total 56,786 4.49 2.251 59,512 4.25 2.283
Political action
1 2,935 0.5373 0.97701 2,995 0.3846 0.79472
2 2,128 0.5787 0.94007 2,251 0.4505 0.78661
3 3,068 0.6888 1.09811 3,006 0.4298 0.84078
4 3,115 0.6400 1.02667 3,108 0.4933 0.86507
5 7,596 0.5964 1.01525 8,087 0.4535 0.84837
6 5,131 0.6963 1.02778 5,440 0.5286 0.87792
7 7,372 0.8070 1.07284 7,096 0.6298 0.92708
8 9,501 0.8682 1.09412 9,597 0.7190 0.97449
9 6,094 0.8603 1.08530 6,483 0.7401 0.96393
10 7,313 0.6718 1.01723 8,407 0.5480 0.88636
Total 54,254 0.7257 1.05330 56,468 0.5721 0.90592
Volunteer work
1 2,105 0.9610 2.09955 2,217 0.7432 1.77238
2 1,051 0.6681 1.46975 1,206 0.5965 1.41521
3 2,180 0.6835 1.55950 2,256 0.5212 1.31047
4 2,114 0.7174 1.47918 2,182 0.5144 1.16532
5 5,282 0.8270 1.76464 5,658 0.6468 1.47731
6 3,602 0.7200 1.49506 3,817 0.5546 1.22231
7 5,493 0.7576 1.54235 5,295 0.5955 1.24198
8 6,736 0.7668 1.38692 6,957 0.6590 1.28102
9 3,704 0.7920 1.33510 4,075 0.7514 1.38403
10 4,452 1.0145 1.83718 5,306 0.8187 1.58798
Total 36,719 0.8026 1.59975 38,968 0.6566 1.39065
Relationship status
1 868 0.68 0.468 1,055 0.52 0.500
2 506 0.67 0.471 642 0.50 0.500
3 973 0.66 0.474 1,121 0.55 0.498
many objectively positive relative to negative events partici-pants experienced),b5.38,t(191)54.34,p<.001, except at the highest end of happiness,b5 .24,t(191)52.78,p<.01. Very happy people did not experience as many positive events relative to negative events as expected from the linear model. Likewise, affect balance was positively associated with the Big Five factor of Conscientiousness,B51.75,SE50.37,b5.41, t(191)54.73,p<.001, except at the highest end of happiness, B5 3.60,SE51.20,b5 .26,t(191)5 3.01,p<.01. Very happy people were not as conscientious as expected from
the linear model. The extent to which participants missed class showed a significant linear trend,B5 0.12,SE50.04,b5
.30,t(191)5 3.35,p<.001, but not a significant nonlinear effect. In terms of the social variables, there was an expected significant linear trend for close friends,B50.36,SE50.11, b5.29,t(191)53.28,p<.001, self-confidence,B50.48,SE
50.12,b5.36,t54.16,p<.001, energy,B50.50,SE5
0.09,b5.45,t(191)55.28,p<.001, and time spent dating,B
50.52,SE50.17,b5.26,t(191)53.03,p<.01. In short, the happier person tended to score high on social domain measures Table 1. (Cont’d.)
Life satisfaction rating
Men Women
N M SD N M SD
5 2,192 0.70 0.459 2,543 0.63 0.483
6 1,769 0.67 0.471 2,036 0.62 0.487
7 3,014 0.70 0.460 3,022 0.64 0.481
8 4,278 0.73 0.442 4,345 0.69 0.463
9 2,407 0.76 0.429 2,747 0.72 0.447
10 2,259 0.76 0.428 2,770 0.72 0.449
Total 19,258 0.71 0.452 21,413 0.65 0.478
Note.Data from World Values Surveys. Income was assessed with the self-report item, ‘‘Please indicate your income on the 10-point scale, ranging from 15the lowest 10% in the nation to 105the highest 10% of the nation.’’ The highest education attained was assessed with the following scale: 15don’t know/not applicable, 25no formal education, 35inadequately completed elementary school; 45completed (compulsory) elementary school; 55incomplete secondary school: technical, vocational type; 65complete secondary school: technical, vocational type; 75incomplete secondary school: university prep type; 85
complete secondary school: university prep type; 95some university without degree; 105university with degree or higher. Political action was assessed by taking the sum of the following type of political actions taken by respondents: signing a petition, joining in boycotts, attending lawful demonstrations, joining unofficial strikes, and occupying buildings or factories (range50–5). Volunteer work was assessed by summing the number of the unpaid work conducted by respondents for the following types of organizations: social welfare service for elderly, church organization, cultural activities, labor union, political parties, local political organization, human rights, environment, conservation, animal rights, professional associations, youth work, sports or recreation, women’s group, peace movement, health-related, or other groups (range50–15). Relationship status was assessed by 0 (not in a stable relationship) or 1 (in a stable relationship). Values in bold face indicate highest level of life satisfaction.
TABLE 2
College Student Success
Outcome
Affect balance Unhappy
(N58)
Slightly happy (N543)
Moderately happy (N575)
Happy (N542)
Very happy (N525)
Grade point average 3.2 (0.6) 3.9 (0.5) 3.9 (0.6) 4.1(0.5) 3.8 (0.7)
Missed class 0.8 (0.9) 0.4 (0.3) 0.5 (0.4) 0.3(0.3) 0.4 (0.3)
Event balance 0.6 (2.8) 0.4 (2.5) 1.5 (3.1) 2.9(3.6) 1.3 (2.5)
Conscientiousness 15.6 (2.9) 17.5 (4.1) 19.3 (4.8) 20.7(3.7) 18.6 (4.7)
Gregarious 18.8 (4.9) 17.2 (5.2) 19.8 (4.3) 18.7 (4.3) 20.5(3.7)
Close friends 4.4 (1.6) 4.7 (1.3) 5.1 (1.2) 5.5 (1.3) 5.8(1.0)
Self-confidence 3.9 (1.7) 4.2 (1.6) 4.9 (1.4) 5.0 (1.3) 5.6(0.8)
Energy 4.0 (2.0) 4.2 (1.1) 4.7 (1.0) 5.1 (1.1) 5.3(1.0)
Time dating 2.8 (1.5) 3.1 (1.8) 4.1 (2.1) 4.3 (1.9) 5.3(2.0)
Note.Data are means with standard deviations in parentheses. Affect balance was the frequency of five positive affects (joy, affection, contentment, happy, and satisfaction) minus the frequency of negative emotions (anger, anxiety, sadness, guilt, and boredom). Grade point average was a 5-point scale (where 55A). Missed class was the average number of classes missed on class days, where students had an average of about three classes per day. Event balance was the number of 20 specific objective positive events experienced minus the number of 29 objective negative life events experienced, with scores ranging from 9 to110. Examples of positive events were ‘‘getting into graduate school’’ and ‘‘got a car,’’ whereas examples of negative events were ‘‘got a traffic ticket’’ and ‘‘had an operation.’’ Conscientiousness and gregariousness were the NEO scale and facet scores for these concepts. Close friends, confidence, and energy were self-ratings of these resources on a 7-point scale. Time dating was the amount of time spent socializing with date or romantic partner, where 2.8 indicates about 4 min and 5.3 is about 40 min per day.
but did not always score high on achievement/conscientiousness measures.
OPTIMAL LEVELS OF HAPPINESS FOR FUTURE SUCCESS Although the World Values Survey and the University of Illinois data provide initial support for our hypotheses, the data on life satisfaction and outcome measures were measured concurrently. Thus, it is unclear whether a particular level of happiness is predictive of later success. To address this limitation, we review four longitudinal studies in which well-being was initially assessed and life outcomes were obtained many years later. College and Beyond Data and American Freshman Data Diener et al. (2002) analyzed a large set of longitudinal data from participants who had entered one of 25 mostly elite colleges in 1976. In this study, participants reported their cheerfulness when they were incoming college freshman, on a 5-point scale (15lowest 10%, 25below average, 35average, 45above average, 55highest 10%). Nineteen years later, at about age 37, these participants reported their annual income. The effects of a cheerful disposition on income were substantial. As seen in Table 3, the participants in the highest 10% of cheerfulness in 1976 earned an average of $62,681 in 1995, whereas the par-ticipants in the lowest 10% of cheerfulness in 1976 earned an average of $54, 318. Furthermore, the most cheerful students at college entry were approximately two thirds as likely to ever be unemployed as were the least cheerful participants. Thus, cheerfulness was associated with both increased earnings later in life and a lower likelihood of unemployment. In keeping with our predictions, however, we found that those who were moderately cheerful (rated above average on cheerfulness) earned the most ($66,144; see Table 3). Thus, if we use income as a criterion, the best level of cheerfulness was not the highest level, but a more moderate level. We next tested the linear and nonlinear models with a regression analysis similar to that described earlier. As predicted, respondents who reported being in the highest 10% in cheerfulness in 1976 earned significantly less money in 1995 than was expected from the linear model,B5 6,063.92,SE5
2,178.08,b 5 .04,t(7889) 5 2.78,p<.01. However, in terms of unemployment history, there was no nonlinear effect.
It is also interesting to note that Diener et al. (2002) found a significant interaction between cheerfulness and parental in-come, such that the association between cheerfulness upon
entering college and later income was stronger among individ-uals from affluent families than those from poor families. Figure 1 shows the income by cheerfulness interaction for those with the poorest and most affluent parents. For instance, among in-dividuals from well-off families (whose parental income was one standard deviation above the mean), the difference between the least cheerful individual and the most cheerful individual was more than $20,000: that is, those who rated themselves in the lowest 10% in cheerfulness earned $55,951,2whereas those who rated themselves in the highest 10% earned $76,948. In con-trast, among individuals from poor families (whose parental income was one standard deviation below the mean), the difference in income between the very cheerful and the least cheerful people was less than $10,000; those who rated them-selves in the lowest 10% in cheerfulness earned $43,589, whereas those who rated themselves in the highest 10% earned $53,097. In addition, when examined separately, the optimal level of cheerfulness for income among individuals from wealthy families was the highest 10%, whereas the optimal level was above average among individuals from poor families. In sum, the interaction between cheerfulness of the participants and their family background nicely illustrates that the effect of cheerful disposition on future income varies depending on individuals’ life circumstances. High parental income suggests a benevolent TABLE 3
19-Year Longitudinal Study of Cheerfulness and Income
Cheerfulness in 1976 Income in 1995
1 (lowest 10%) $54,318 2 (below average) $61,664 3 (average) $63,509 4 (above average) $66,144 5 (highest 10%) $62,681
30,000 35,000 40,000 45,000 50,000 55,000 60,000 65,000 70,000 75,000 80,000
1 2 3 4 5
Cheerfulness in 1976
Income in 1995 ($)
From Low Income Family From High Income Family
Fig 1. Cheerfulness and parental income interaction on later income. Data are from individuals from low income families (one standard deviation below mean) and high income families (one standard deviation above mean).
2The incomes described in this paragraph are based on a regression equation
(i.e., estimated income for those who were one standard deviation above or below the mean).
environment. In a benevolent environment, boldness often re-sults in positive outcomes. Cheerfulness is adaptive in a be-nevolent environment perhaps because optimism and sociability associated with cheerfulness help individuals to be bold. In contrast, low parental income suggests a harsh envi-ronment. Cheerfulness in a harsh environment might not be as adaptive, because it could lead individuals to be content with their less-than-ideal conditions and does not motivate them to improve their life circumstances. The interaction between cheerfulness and parental income on the future income seems to illustrate that the maximal success is obtained when one’s level of cheerfulness is matched with their circumstances.
Australian Youth Data
The Australian Youth in Transition study, a longitudinal study of nationally representative cohorts of young people in Australia, also showed that life satisfaction predicts later earning (Marks & Fleming, 1999). To determine whether the nonlinear effect could be replicated, however, we obtained data for the 1961 birth cohorts and analyzed these data in a way analogous to those presented above. The Australian respondents indicated their life satisfaction (‘‘satisfaction with life as a whole’’) when they were 18 years old (in 1979). They also reported their gross in-come in 1994, when they were 33 years old (N51,166). The Australian data replicated Diener et al.’s (2002) findings. In-come in 1994 increases linearly from those reporting to be least satisfied in 1979 to those reporting the average level of satis-faction, peaks at those reporting the moderately satisfied level (4 on the 5-point scale), and then decreases for those at the very high level of satisfaction. In keeping with our prediction and the
findings of Diener et al. (2002), ‘‘very satisfied’’ respondents in 1979 did not earn as much money in 1994 as expected from the linear model,b5 .07,t(1163)5 1.78,p5.076, although this did not reach the .05 level of significance.
Respondents from the Australian Youth in Transition Study also reported the number of years of schooling they completed beyond primary education in 1987, when they were 26 years old. Similar to the income findings, the highest levels of education were reported by those individuals who had moderate levels of satisfaction in 1979. The individuals who reported that they were very satisfied in 1979 did not obtain as much education as would be expected based on the linear model,b5 .19,t(776)
5 3.52,p<.01. Respondents also reported the length of their current intimate relationship in 1994. In contrast to the income and education findings, individuals from the very satisfied group in 1979 were involved in longer intimate relationships in 1994 than were individuals from the second and third most-satisfied groups (see Figure 3). Indeed, although the linear trend was again significantb5.14,t(1468)53.91,p<.01, the nonlinear parameter was not,b5 .03,t(1468)5 .88,p5.38. In short, the Australian Youth in Transition study supports the prediction that the optimal level of happiness is not the highest level of happiness in the domains of educational achievement and in-come later in life. However, the highest level of satisfaction may in fact be optimal in terms of relationship stability.
German and British Panel Data
The two longitudinal data sets that we analyzed above relied on a single-item measure assessed at a single time point. To address the weaknesses associated with these data sets, we next ana-lyzed data from two long-running panel studies, the German
0.00 10,000.00 20,000.00 30,000.00 40,000.00 50,000.00 60,000.00 70,000.00
least (4)
3 2 1
(0) Life Satisfaction in 1979
Income in 1994 ($)
Men Women
most
Fig 2. Australian Longitudinal Study: Life satisfaction and income. Data are from men and women surveyed in 1979 (for life satisfaction) and again in 1994 (for income). Error bars represent standard error.
0 2 4 6 8 10 12
least (4)
3 2 1
(0) Life Satisfaction in 1979
Length of Relationship
Men Women
most
Fig 3. Australian Longitudinal Study: Life satisfaction and relationship duration. Data are from men and women first surveyed in 1979. Error bars represent standard error.
Socio-Economic Panel Study (GSOEP; for details see Haisken-De New & Frick, 2005) and the British Household Panel Study (BHPS; for details see Taylor, Brice, Buck, & Prentice-Lane, 2005; University of Essex Institute for Social and Economic Research, 2006), which allowed us to aggregate a single-item life satisfaction item across multiple assessment points. The GSOEP study began in 1984 and initially included a nationally representative sample of households in West Germany. Twenty waves of data were available for this analysis. The BHPS began in 1991 and, again, a nationally representative sample of household was selected for participation. In both studies, par-ticipants answered a single-item life satisfaction item, and this question was administered in every year of the GSOEP and in 7 out of the last 8 years of the BHPS.
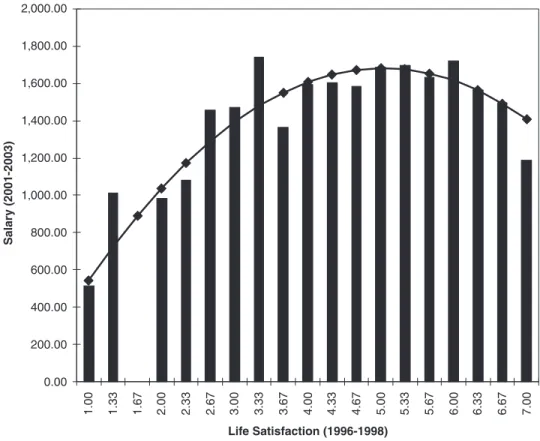
For each study, we constructed an aggregate life-satisfaction measure by averaging across multiple waves. For the longer GSOEP, we aggregated across the first 4 years; for the shorter BHPS, we aggregated across the first 3 years. We then predicted respondents’ income in the most recent waves of the study from these initial life satisfaction measures. These two data sets clearly support our hypothesis regarding happiness and future earning, as the pattern of declining income among the happiest people again emerges (see Figures 4 and 5). Individuals with moderately high levels of satisfaction reported higher incomes
than did individuals with low levels of life satisfaction. However, as predicted, after this point, salary levels drop for the happiest individuals. Regression analyses (reflected in the regression lines in Figures 4 and 5) show that this drop-off is significant:
BQuadratic5 481.84,SE592.49,b5 .08,t(4906)5 5.21,
p<.001, for the GSOEP, andBQuadratic5 70.42,SE515.91,
b5 .09,t(2844)5 4.43,p<.001, for the BHPS. Further-more, this effect is still significant even after controlling for salary in the first 4 years of the survey (i.e., controlling for initial success),BQuadratic5 312.98,SE588.17,b5 .05,t(4905) 5 3.55,p<.001, for the GSOEP, andBQuadratic5 30.25,SE 513.79,b5 .04,t(2273)5 2.19,p<.05, for the BHPS. The fact that the drop-off in income occurs not just among those individuals who consistently use the topmost (10) response op-tion suggests that the suboptimal effect of a very high level of happiness on future income that we identified is not due to the way that people use response scales.
DISCUSSION
The findings from our analyses of a very large cross-sectional survey, an intense data collection project with college students, and four large longitudinal data sets revealed a consistent pat-tern of results. As expected, the optimal level of happiness
0 5,000 10,000 15,000 20,000 25,000
3.50 3.75 4.00 4.25 4.50 4.75 5.00 5.25 5.50 5.75 6.00 6.25 6.50 6.75 7.00 7.25 7.50 7.75 8.00 8.25 8.50 8.75 9.00 9.25 9.50 9.75
10.00
Life Satisfaction (1984-1987)
Salary (2000-2003)
Fig 4. Life satisfaction and salary in the German Socioeconomic Panel Study. Bars reflect average income at the listed life satisfaction level. The line reflects the estimated quadratic effect of life satisfaction on salary. Values lower than 3.50 are not shown because of the small number of participants (<10) per cell.
varies across domains and contexts. The optimal level of hap-piness in the domains of volunteer work and relationships is the highest possible level of happiness. In contrast, the optimal level of happiness for achievement outcomes including income and education is a moderate (but still high) level of happiness. Be-fore discussing our main findings further, we would like to make clear what we are not saying. We are not saying that it is bad to be very happy. We are also not saying that it is desirable to be unhappy. The results reported in this article do not support ei-ther of these views. Although it is true that the very happy people tend to be worse off than the moderately happy in certain do-mains, they still tend to report more successful functioning than do those individuals who are at the midpoint of the distribution, and they are usually better off than are those at the lowest ends. Fully functioning individuals are often described as those who have loving relationships and contribute to society via work, family, volunteer work, and political engagement (e.g., Keyes & Haidt, 2002; Peterson & Seligman, 2004; Ryan & Deci, 2001; Ryff & Singer, 1998; Sheldon, 2004). Given that no specific level of happiness is associated with all of these positive outcomes, there is no single level of happiness that is optimal for every individual and every activity. The optimal level of happiness is likely to vary across individuals, depending on their value pri-orities (cf. Oishi, Diener, Suh, & Lucas, 1999). For those whose primary values center on achievement, moderately high levels of
happiness may be optimal; for those individuals whose values give priority to close relationships and volunteer work, it is the highest level of happiness that appears to be optimal. In addi-tion, functional levels of happiness might vary across individ-uals, depending on their personality dispositions. Tamir (2005), for instance, found that neurotics were more likely than were nonneurotics to choose to increase their levels of worry when performing a demanding task. Furthermore, Tamir offered pre-liminary evidence that this might have been beneficial for their performance. Thus, the benefit of happy mood might be mod-erated by individuals’ values and personality (see also Norem & Illingworth, 1993). In addition, the optimal level of happiness is likely to differ across cultures, as individuals from different cultures seek different types of positive emotions (e.g., Eid & Diener, 2001; Kitayama, Markus, & Kurokawa, 2000; Tsai, Knutson, & Fung, 2006) and the consequence of positive affect differs across cultures (e.g., Oishi & Diener, 2003).
Why Do Optimal Levels of Happiness Differ in Various Domains?
Complete satisfaction with current conditions might prevent individuals from energetically pursuing change in achievement domains such as education and income. After all, the defining characteristics of need for achievement are high standards of
0.00 200.00 400.00 600.00 800.00 1,000.00 1,200.00 1,400.00 1,600.00 1,800.00 2,000.00
1.00 1.33 1.67 2.00 2.33 2.67 3.00 3.33 3.67 4.00 4.33 4.67 5.00 5.33 5.67 6.00 6.33 6.67 7.00 Life Satisfaction (1996-1998)
Salar
y (2001-2003)
Fig 5. Life satisfaction and salary in the British Household Panel Study. Bars reflect average income at the listed life satisfaction level. The line reflects the estimated quadratic effect of life satisfaction on salary.
excellence and constant striving for perfection (McClelland, 1961). Similarly, if individuals are completely satisfied with the current political situation, they might be less likely to actively participate in the political process. Whereas wanting more may be an important motivation for income, education, and political participation, in the domain of intimate relationships, wanting more might be detrimental because it prompts individuals to search for alternative partners (e.g., Rusbult, 1980) and to more readily see the faults of others. Indeed, Murray and her col-leagues repeatedly found that the idealization of partners and positive illusions about partners are beneficial to relationship quality and stability (see Murray et al., 2003, for review). In-dividuals who are fully satisfied with their current lives are more likely to view their partner in an idealistic fashion than are others who are not fully satisfied with their lives. In contrast to the achievement situation in which hard work (and wanting more) is usually essential, in the social situation, it may be the case that being content is most beneficial. Thus, the optimal mindset for an intimate relationship might be to see mostly the positive aspects of the partner and relationship, whereas the optimal mindset for income, education, and political partici-pation might be to simultaneously consider the empty part of the glass as well as the fullness of it.
Whereas the patterns of optimal happiness levels for the various outcomes discussed above were consistent with our theoretical predictions, the optimal level of happiness for vol-unteer work was, unexpectedly, the highest possible level of happiness. Our expectation that above-average happiness would prove optimal was based on the assumption that individuals are motivated to engage in volunteer work in order to make the world a better place and that individuals completely satisfied with their lives and the world might not engage in these activities as much as others who are moderately satisfied. However, there are many motivations for volunteer work, from humanitarian values to self-esteem to social networking (Omoto & Snyder, 1995). Previous research has shown that volunteer work is associated with sociability and agreeableness (Graziano & Eisenberg, 1997), which in turn are positively associated with life satis-faction (e.g., Schimmack, Oishi, Furr, & Funder, 2004). The level of happiness is linearly associated with volunteer work perhaps because it is also linearly associated with agreeable-ness and sociability. In short, volunteer work might be more similar to close relationships than to achievement domains in terms of its motivational mechanism.
Optimal Variability in Happiness and Other Remaining Issues
Our analyses and discussion so far have focused exclusively on the optimal mean level of happiness. It is important to explore the optimal variability in happiness in the future, as humans are expected to act in accordance with highly variable contexts and there might be an optimal level of variability in happiness. Some
might believe that our arguments suggest that flexibility in feelings of positive and negative moods and emotions is the key to effective functioning. Although this is undoubtedly true, as being locked into any specific emotion would be dysfunctional, Eid and Diener (1999) found that people with a large range in their emotions tended to be neurotic. It is interesting that people who were variable on positive emotions were also variable on negative emotions. Thus, variability by itself is probably not sufficient for optimal functioning, and a tendency to experience primarily positive emotions seems functional, at least in many circumstances in the modern world. However, there may also be an optimal level of flexibility in one’s emotions, with extreme values in either direction being dysfunctional.
Our analysis has treated subjective well-being as a single entity, whereas there are in fact clearly separable components of happiness (Lucas et al., 1996; Ryan & Deci, 2001; Ryff, 1989). In some of our analyses, we analyzed life satisfaction or cheer-fulness, and in other analyses, we used affect balance (the difference between people’s experience of positive and negative emotions). We were limited in this endeavor by the subjective well-being variables that were included in the data sets we used. However, it will be important in future research to explore the optimal levels of various types of well-being and discrete emo-tions. For example, very high levels of purpose and meaning might be beneficial to all kinds of success, whereas very high levels of pleasant emotions, especially intense or aroused ones, may be mixed in their effects. Another important direction for the future is to analyze the combination and interaction of var-ious forms of well-being. For example, most Americans report positive life satisfaction, but a substantial percentage also report being stressed (Pomerantz, Saxon, & Oishi, 2000). Perhaps this combination is functional for a group with American values, in a society where people ‘‘want it all’’ rather than taking a more relaxed view of life. Finally, it is important to identify mediating processes of the connection between a particular level of hap-piness and success. For instance, the link between the moderate level of happiness and the maximal earning in the future might be mediated by need for achievement, whereas the link between the highest level of happiness and relationship stability might be mediated by variables such as optimism and agreeableness. Conclusion
Happiness has become a major goal in life around the world (Diener & Oishi, 2006). However, there are dangers involved in searching for ultrahappiness. Because adaptation occurs (Die-ner, Lucas, & Scollon, 2006; Wilson & Gilbert, 2003) and people’s happiness is influenced in part by their temperaments (Lykken & Tellegen, 1996), obtaining continuously high levels of happiness could require risky behaviors such as thrill-seek-ing activities and the use of drugs. Seekthrill-seek-ing very high levels of positive affect might also stimulate novelty seeking, in which the person continually seeks new partners and new activities so that aroused levels of positive affect can be maintained. However,
this type of search for intense happiness is likely to lead to in-stability in a person’s life.
Ryff (1989) raised the issue of whether subjective well-being has been overemphasized in our conceptions of psychological well-being (see also Ryan & Deci, 2001). In keeping with her analysis, our findings suggest that extremely high levels of happiness might not be a desirable goal and that there is more to psychological well-being than high levels of happiness. It is up to psychologists to educate lay people about optimal levels of happiness and the levels of happiness that are realistic. How-ever, psychologists have not yet been able to give much advice with confidence because no data have existed on these issues. This article represents a first effort to answer the question, ‘‘How much happiness is enough?’’.
As people in modern societies seek higher levels of happi-ness, a concerted effort is needed to determine the intricate patterns of outcomes resulting from being happy, very happy, or extremely happy. The effects of moods on behavior have been studied by psychologists, but little research has been aimed at uncovering the effects of long-term, more chronic levels of affect and satisfaction on functioning. The optimal levels of happiness are likely to depend on a person’s resources, the challenges and dangers they face, the behavioral domain in question, and the type of well-being under consideration. Despite the complexity that is involved, the question of how much happiness is optimal is worth vigorously pursuing because it is a key issue for both scientific and applied psychology.
Acknowledgments—Because of the editor’s coauthorship, this article was assigned to an outside editor, Christopher Peterson of the University of Michigan. Professor Peterson obtained outside reviewers whose identity was masked from the editor, and he had full editorial authority over the article. We want to thank the guest editor and the reviewers for their work on this article and for their very helpful suggestions.
The data used in this article were made available by the German Institute for Economic Research and by the United Kingdom Data Archive. The British Household Panel Study data were originally collected by the Economic and Social Research Council Research Centre on Micro-Social Change at the Uni-versity of Essex, now incorporated within the Institute for Social and Economic Research. Neither the original collectors of the data nor the Archive bear any responsibility for the analyses or interpretations presented here.
We would like to thank Gary N. Marks for making the Aus-tralian Youth Study data available to us. We would also like to thank Carol Nickerson for her help with the data concerning cheerfulness and later income/unemployment history and Frank Fujita for his help with the Illinois data.
Finally, it should be noted that the descriptive statistics for the World Values Survey and Australian Youth Study reported
here are also reported in Oishi and Koo (in press). Shigehiro Oishi was supported by National Institute of Mental Health Grant R01MH066857-01A1 and Richard E. Lucas was sup-ported by National Institute on Aging Grants 1R03AG026028-01 and 1R03AG028744-1R03AG026028-01 during the preparation of this article.
REFERENCES
Allport, G.W. (1961).Pattern and growth in personality. New York: Holt, Rinehart, & Winston.
Baumeister, R.F., Campbell, J.D., Krueger, J.I., & Vohs, K.D. (2003). Does high self-esteem cause better performance, interpersonal success, happiness, or healthier lifestyles?Psychological Science in the Public Interest,4, 1–44.
Baumeister, R.F., Stillwell, A.M., & Heatherton, T.E. (1994). Guilt: An interpersonal approach.Psychological Bulletin,115, 243–267. Bodenhausen, G.V., Kramer, G.P., & Su¨sser, K. (1994). Happiness and
stereotypic thinking in social judgment. Journal of Personality and Social Psychology,66, 621–632.
Crocker, J., & Park, L.E. (2004). The costly pursuit of self-esteem.
Psychological Bulletin,130, 392–414.
Cropanzano, R., & Wright, T.A. (1999). A 5-year study of change in the relationship between well-being and job performance.Consulting Psychology Journal: Practice and Research,51, 252–265. Damasio, A.R. (1994).Descartes’ error: Emotion, reason, and the
hu-man brain. New York: Putnam.
Danner, D.D., Snowdon, D.A., & Friesen, W.V. (2001). Positive emo-tions in early life and longevity: Findings from the nun study.
Journal of Personality and Social Psychology,80, 804–813. Darwin, C. (1872).The expression of emotions in man and animals.
Chicago: University of Chicago Press.
Diener, E. (2000). Subjective well-being: The science of happiness and a proposal for a national index.American Psychologist,55, 34–43.
Diener, E., & Diener, C. (1996). Most people are happy.Psychological Science,7, 181–185.
Diener, E., Lucas, R., & Scollon, C.N. (2006). Beyond the hedonic treadmill: Revising the adaptation theory of well-being.American Psychologist,61, 305–314.
Diener, E., Nickerson, C., Lucas, R.E., & Sandvik, E. (2002). Dispo-sitional affect and job outcomes.Social Indicators Research,59, 229–259.
Diener, E., & Oishi, S. (2006). The desirability of happiness across cultures. Unpublished manuscript, University of Illinois, Urbana– Champaign.
Diener, E., Scollon, C.N., & Lucas, R.E. (2003). The evolving concept of subjective well-being: The multifaceted nature of happiness.
Advances in Cell Aging and Gerontology,15, 187–219.
Diener, E., & Seligman, M.E.P. (2004). Beyond money: Toward an economy of well-being. Psychological Science in the Public In-terest,5, 1–31.
Diener, E., Suh, E.M., Lucas, R.E., & Smith, H.L. (1999). Subjective well-being: Three decades of progress. Psychological Bulletin,
125, 276–302.
Eid, M., & Diener, E. (1999). Intraindividual variability in affect; Reliability, validity, and personality correlates.Journal of Per-sonality and Social Psychology,76, 662–676.
Eid, M., & Diener, E. (2001). Norms for experiencing emotions in different cultures: Inter- and intranational differences.Journal of Personality and Social Psychology,81, 869–885.
Fredrickson, B.L. (2001). The role of positive emotions in positive psychology: The broaden-and-build theory of positive emotions.
American Psychologist,56, 218–226.
Fredrickson, B.L., & Losada, M.F. (2005). Positive affect and the complex dynamics of human flourishing.American Psychologist,
60, 678–686.
Friedman, H.S., Tucker, J.S., Tomlinson-Keasey, C., Schwartz, J.E., Wingard, D.L., & Criqui, M.H. (1993). Does childhood person-ality predict longevity?Journal of Personality and Social Psy-chology,65, 176–185.
Frijda, N. (1988). The laws of emotion.American Psychologist, 43, 349–358.
Graziano, W.G., & Eisenberg, N. (1997). Agreeableness: A dimension of personality. In R. Hogan, R. Johnson, & S. Briggs (Eds.),
Handbook of personality psychology(pp. 795–824). San Diego, CA: Academic.
Haisken-De New, J.P., & Frick, R. (2005).Desktop companion to the German Socio-Economic Panel Study (GSOEP). Berlin, Germany: German Institute for Economic Research (DIW).
Isen, A.M. (1999). Positive affect. In T. Dalgleish & M. Powers (Eds.),
The handbook of cognition and emotion (pp. 75–94). Hillsdale, NJ: Erlbaum.
Janis, I. (1968). When fear is healthy.Psychology Today,11, 46–49, 60–61.
Kahneman, D. (1999). Objective happiness. In D. Kahneman, E. Diener, & N. Schwarz (Eds.),Well-being: The foundations of he-donic psychology(pp. 3–25). New York: Russell Sage Foundation. Kahneman, D., Krueger, A.B., Schkade, D.A., Schwarz, N., & Stone, A.A. (2004). A survey method for characterizing daily life ex-perience: The day reconstruction method.Science, 306, 1776– 1780.
Kaufman, J.C., & Baer, J. (2002). I bask in dreams of suicide: Mental illness, poetry, and women.Review of General Psychology,6, 271– 286.
Keyes, C.L.M., & Haidt, J. (2002).Flourishing: Positive psychology and the life well-lived. Washington, DC: American Psychological Association.
King, L.A, & Napa, C.K. (1998). What makes a life good?Journal of Personality and Social Psychology,75, 156–165.
Kitayama, S., Markus, H.R., & Kurokawa, M. (2000). Culture, emo-tion, and well-being: Good feelings in Japan and the United States.Cognition and Emotion,14, 93–124.
Klandermans, B. (1989). Does happiness soothe political protest? The complex relation between discontent and political unrest. In R. Veenhoven (Ed.), How harmful is happiness? Consequences of enjoying life or not. Rotterdam, The Netherlands: Universitaire Pers Roterdam.
Lorenz, E.N. (1993). The essence of chaos. Seattle: University of Washington Press.
Lucas, R.E., Clark, A.E., Georgellis, Y., & Diener, E. (2003). Reex-amining adaptation and the set point model of happiness: Re-actions to changes in marital status.Journal of Personality and Social Psychology,84, 527–539.
Lucas, R.E, Diener, E., & Suh, E. (1996). Discriminant validity of well-being measures. Journal of Personality and Social Psy-chology,71, 616–628.
Lykken, D., & Tellegen, A. (1996). Happiness is a stochastic phe-nomenon.Psychological Science,7, 186–189.
Lyubomirsky, S., King, L., & Diener, E. (2005). The benefits of fre-quent positive affect: Does happiness lead to success? Psycho-logical Bulletin,131, 803–855.
Marks, G.N., & Fleming, N. (1999). Influences and consequences of well-being among Australian young people: 1980–1995.Social Indicators Research,46, 301–323.
Martin, L.R., Friedman, H.S., Tucker, J.S., Tomlinson-Keasey, C., Criqui, M.H., & Schwartz, J.E. (2002). A life course perspective on childhood cheerfulness and its relation to mortality risk.
Personality and Social Psychology Bulletin,28, 1155–1165. Maslow, A.H. (1971).The farther reaches of human nature. New York:
Viking.
McClelland, D.C. (1961).The achieving society. New York: D. Van Nostrand.
Melton, R.J. (1995). The role of positive affect in syllogism perfor-mance.Personality and Social Psychology Bulletin,21, 788–794. Mowrer, O.H. (1939). A stimulus-response analysis of anxiety and its role as a reinforcing agent.Psychological Review,46, 553–565. Murray, S.L., Holmes, J.G., & Griffin, D.W. (2003). Reflections on the
self-fulfilling effects of positive illusions.Psychological Inquiry,
14, 289–295.
Norem, J.K., & Cantor, N. (1986). Defensive pessimism: Harnessing anxiety as motivation. Journal of Personality and Social Psy-chology,51, 1208–1217.
Norem, J.K., & Illingworth, K.S.S. (1993). Strategy dependent effects of reflecting on self and tasks: Some implications of optimism and defensive pessimism.Journal of Personality and Social Person-ality,65, 822–835.
Oishi, S., & Diener, E. (2003). Culture and well-being: The cycle of action, evaluation and decision. Personality and Social Psy-chology Bulletin,29, 939–949.
Oishi, S., Diener, E., Suh, E., & Lucas, R.E. (1999). Value as a moder-ator in subjective well-being.Journal of Personality,67, 157–184. Oishi, S., & Koo, M. (in press). Two new questions about happiness: ‘‘Is happiness good?’’ and ‘‘Is happier better?’’. In M. Eid & R.J. Larsen (Eds.), Handbook of subjective well-being. New York: Guilford.
Omoto, A.M., & Snyder, M. (1995). Sustained helping without obli-gation: Motivation, longevity of service, and perceived attitude change among AIDS volunteers. Journal of Personality and Social Psychology,68, 671–687.
Patrick, C.J., Bradley, M.M., & Lang, P.J. (1993). Emotion in the criminal psychopath: Startle reflex modulation. Journal of Ab-normal Psychology,102, 82–92.
Peterson, C., & Seligman, M.E.P. (2004). Character strengths and virtues: A handbook and classification. Washington, DC: American Psychological Association.
Pomerantz, E.M., Saxon, J.L., & Oishi, S. (2000). The psychological tradeoffs of goal investment. Journal of Personality and Social Psychology,79, 617–630.
Pressman, S.D., & Cohen, S. (2005). Does positive affect influence health?Psychological Bulletin,131, 925–971.
Pressman, S.D., Cohen, S., & Kollnesher, M. (2006, March).Positive emotion and social word use in autobiography predicts increased longevity in psychologists. Paper presented at the 64th annual Scientific Meeting of the American Psychosomatic Society, Denver, CO.
Pyszczynski, T., & Cox, C. (2004). Can we really do without self-esteem?Psychological Bulletin,130, 425–429.
Roberts, B.W., Caspi, A., & Moffitt, T.E. (2003). Work experiences and personality development in young adulthood.Journal of Person-ality and Social Psychology,84, 582–593.
Rogers, C. (1961).On becoming a person: A therapist’s view of psy-chotherapy. Boston: Houghton Mifflin.