Using Ethereal
Solutions in this Chapter:
■ Getting Started with Ethereal ■ Exploring the Main Window ■ Other Window Components ■ Exploring the Menus
■ Using Command Line Options
Chapter 4
125 Summary
Solutions Fast Track
Introduction
Ethereal is an invaluable tool for providing insight into what is really happening on your network.This kind of insight is useful when implementing protocols, debugging network applications, testing networks, or trying to debug live net-works. In almost any situation that involves interaction with the network at a technical level you can enhance your understanding of your problem by using Ethereal to see what is really going on.
Ethereal is also an excellent pedagogical aid. Being able to see and analyze actual network traffic is extremely instructive. It’s one thing to read about the functioning of a protocol, it’s quite another to be able to watch it in action and explore how it’s really operating
This chapter covers the main components of the Ethereal Graphical User Interface (GUI).These parts are the Main Window and it’s subcomponents the Menu Bar,Tool Bar, Summary Window, Protocol Tree Window, Data View Window, Filter Bar, and Information field.This chapter will also cover use of the context-sensitive pop-up windows available in the Summary Window, Protocol Tree Window, and Data View Window, and will also explain the various dialog boxes that are launched by the menus and toolbars.
You will learn how to perform basic tasks in Ethereal such as capturing net-work traffic, loading and saving capture files, performing basic filtering, printing packets, and using some of the more involved tools provided by Ethereal. Examples have been provided to show you step-by-step how some of the less obvious areas of Ethereal work.
All of the screenshots for this chapter were taken on Linux, and so they may look slightly different in terms of fonts or window decorations than the screen-shots in some of the other chapters in this book, which were taken on Windows.
Getting Started with Ethereal
In order to use Ethereal you must first acquire Ethereal and install it. If you are running a Linux distribution it is likely that your distribution shipped with Ethereal. If you are running Windows or some version of UNIX (Solaris, HP-UX, AIX, etc) you will have to download Ethereal and install it.
You can download binary packages for Ethereal from the Ethereal website at www.ethereal.com. If there are no binary packets there for your platform, if they are not up to date, or compiled without options you need, you may download
the source code from the Ethereal website and compile Ethereal yourself. Installing Ethereal is covered in detail in Chapter 3.
You may also wish to download the bgp.pcap.gz capture at
www.ethereal.com/sample/bgp.pcap.gz, as it is used in many examples in this chapter.You can follow along through the examples with your own copy of Ethereal. Once you have installed Ethereal on the computer you wish to capture with, execute at the command line:
ethereal.
To launch Ethereal on Windows, select Start | Programs | Ethereal | Ethereal.The Main Window of the Ethereal application will now be displayed.
Exploring the Main Window
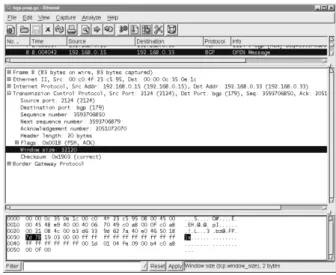
It is important for us to define a common set of labels for the different compo-nents of the Main Window so that we can speak clearly about them. Figure 4.1 shows the Main Window of Ethereal with its major components labeled. Figure 4.1 Main Window
The Main Window components are described in Table 4.1: Table 4.1 Main Window Components
Window Component Description
Menu Bar A typical application menu bar containing
drop-down menu items.
Tool Bar A toolbar containing buttons for some
commonly used functions of Ethereal. The Tool Bar icons have tool tips that are displayed when you pause the mouse pointer over them.
Summary Window A window providing a one-line summary for each packet in the capture.
Protocol Tree Window A window providing a detailed decode of the packet selected in the Summary Window.
Data View Window A window providing a view of the raw data in the packet selected in the Summary Window.
Filter Bar A tool for applying filters to the Summary Window to restrict which packets in the capture are displayed, based upon their attributes.
Information Field A small display area to provide informa-tion about the capture or field selected in the Protocol Tree Window.
Summary Window
The Summary Window displays a summary of each packet in the capture, one per line. One or more columns of summary data for each packet will be dis-played.Typical columns are shown in Table 4.2.
Table 4.2 Summary Window Columns
Column Name Description
No. Frame number within the capture.
Time The time from beginning of the capture to the time when the packet was captured (in seconds). Source Highest level source address. This will frequently
be the IP (Internet Protocol) source address, but may also be the Media Access Control (MAC) address for layer 2 (L2) Ethernet protocols (see the Ethereal Name Resolution sidebar for a dis-cussion of MAC addresses), or other address types for other protocols (IPX, AppleTalk, etc ). Destination Highest level destination address. This will fre-quently be the IP destination address, but may also be the MAC address for L2 Ethernet proto-cols, or other address types for other protocols (IPX, AppleTalk, etc).
Protocol Typically the highest level protocol decoded. Examples include user level protocols such as HyperText Transfer Protocol (HTTP), File Transfer Protocol (FTP), Simple Mail Transfer Protocol (SMTP).
Info This field contains information that was deter-mined by the highest level decode to be useful or informative as part of a summary for this packet.
You can use the Preferences feature to select which columns are displayed in the Summary Window (select Edit | Preferencesfrom the Menu Bar).
The summary information for the packet selected in the Summary Window in Figure 4.1 is shown in Table 4.3.
Table 4.3 Summary Window Column Example
Column Name Value
No. 8
Time 8.004042 seconds since the capture started
Source IP number 192.168.0.15
Destination IP number 192.168.0.33
Table 4.3 Summary Window Column Example
Column Name Value
Protocol BGP (Border Gateway Protocol)
Info OPEN Message
We can immediately see that this is a packet carrying a message for opening a Border Gateway Protocol session between 192.168.0.15 and 192.168.0.33. More information on Border Gateway Protocol is available in RFC (Request for Comment) 1771 at www.ietf.org/rfc/rfc1771.txt?number=1771. RFCs are the documents that describe the protocols in use on the Internet. Many RFCs define protocol standards (although not all RFCs do).
You can select packets in the Summary Window by clicking on the row summarizing a given packet.The information for the selected packet will then be displayed in the Protocol Tree Window and the Data View Window. Once you have selected a packet in the Summary Window you can use the Protocol Tree Window to drill down into it in greater detail.
Protocol Tree Window
We can conceptualize a packet as a tree of fields and subtrees. For each protocol there is a tree node summarizing the protocol, which can be expanded to pro-vide the values in that protocol’s fields. Within some protocols there may be tree nodes summarizing more complicated data structures in the protocol.These tree nodes can be expanded to show those data structures. For any given node that has a subtree, we can expand it’s subtree to reveal more information, or collapse it to only show the summary.The Protocol Tree Window allows you to examine the tree created by Ethereal from decoding a packet.
We’ll take a moment now to drill down through the Protocol Tree Window into the packet we selected in the previous example (Figure 4.2).
In the Protocol Tree Window, you can see that for each layer in the protocol stack for this packet we have a one-line summary of that layer (see Table 4.4). Table 4.4 Protocol Layer Example
Layer Protocol Description
Packet Meta Data Frame 83 bytes on wire, 83 bytes captured
Datalink ( Layer 2/L2 ) Ethernet II Src Addr: 00:c0:4f:23:c5:95, Dst Addr: 00:00:0c:35:0e:1c Network ( Layer 3 / L3 ) Internet Protocol (IP) Src Addr: 192.168.0.15, Dst
Addr: 192.168.0.33 Transport ( Layer 4/ L4) Transmission Control Src Port: 2124, Dst Port:
Protocol (TCP) bgp(179), Seq: 2593706850, Ack …
Application Layer Border Gateway ( Layer 7 /L7) Protocol (BGP)
Each of these layers have little boxed plus (+) signs next to them indicating that they have a subtree that can be expanded to provide more information about that particular protocol.
In Figure 4.3, we have expanded the Border Gateway Protocoltree to reveal that it contains one OPEN Message, and further expanded that OPEN Messageto reveal the fields contained within it.
By selecting the Typefield in the Protocol Tree Window, we’ve caused the
Information field in the lower right corner to display the message BGP message type (bgp.type), 1byte.This indicates the long name of this field (BGP message type) and the display filter field name used to identify this field for filtering and col-orization (bgp.type), as well as the size of this field in the packet (1 byte).
Data View Window
The Data View Window contains a series of rows, as show in Figure 4.4. Each row begins with a four-digit number representing the number of bytes the first octet (an octet is eight bits or one byte or two hexadecimal – also known as hex
- digits) in that row is offset from the beginning of the packet.This offset is then followed by sixteen two-character hexadecimal bytes.The last item in each row is a series of sixteen ASCII (American Standard Code for Information Interchange, a common character encoding) characters representing the same 16 bytes from the packet. Not all bytes are conveniently displayable in ASCII. For those bytes a period (.) is substituted as a placeholder.
www.syngress.com
When a field in the Protocol Tree Window is selected, the bytes corre-sponding to that field are highlighted in the Data View Window. In our example we have selected the BGP message typefield in the Protocol Tree Window. In the Data View Window we find that byte highlighted in the row with offset 0040 representing 0x40 hex or 64 bytes into the packet.The ninth byte in the row is highlighted, and has a value of 01 hex. In the ASCII representation we have a period (.) because the value 0x01 is not conveniently represented in ASCII.
When you click on a hex byte or ASCII character in the Data View Window, Ethereal will highlight the field in the Protocol Tree Window corre-sponding to the selected byte, and all bytes in the Data View Window associated with that Protocol field.
In Figure 4.5 we’ve clicked on the 7d at the beginning of row 0030. It just so happens that the 48th byte (0030 or hex 0x30) is the first byte of the two-byte Transmission Control Protocol (TCP) Window Size field. As a result, the TCP tree was automatically expanded and the Window sizefield was high-lighted. Additionally the second byte, with value 78 hex, in the 0030 row, was also selected, since TCP Window Size is a two-byte field.
This feature of Ethereal makes it very easy to use the Protocol Tree Window and the Data View Window together to obtain a solid grasp of the relationships between the fields in a protocol and the actual bits on the wire.
Other Window Components
Filter Bar
The Filter Bar (Figure 4.6) allows you to enter a filter string restricting which packets are displayed in the Summary Window. Only packets that match the dis-play filter string will be disdis-played in the Summary Window. A disdis-play filter string is a string defining some conditions on a packet that may or may not match a packet. For example, the display filter string (ip.addr == 10.15.162.1 && bgp)
would match all packets with an IP address (source or destination) of 10.15.162.1 that are BGP protocol packets. Filtering will be explored in much greater depth in Chapter 5, but we will examine the basic functions of the Filter Bar briefly here.
www.syngress.com
You can see in Figure 4.6 that we have applied a bgp filter.To apply a filter, enter the desired string into the Filter: text field and press Enter(or click the
Applybutton). Please note that your filter string will not be applied until you hit Enteror click the Applybutton.In addition, note that filter strings are case-sensitive and the filter string BGP (uppercase) will not work.Traditionally, filter string labels like bgp are entirely in lowercase.
Once the display filter string bgpis applied, you will note that only BGP packets are displayed in the Summary Window.You should also note that the
No.column displays jumps between the frame numbers of the displayed packets. This is because there are packets in the capture that are not being displayed, but are rather being suppressed by the bgpfilter string. Previously used filters can be easily recalled, as shown in Figure 4.7.
By clicking the drop-down arrow at the right end of the Filter field, you can access a list of previously applied filters.To use one of these filters, select it from the list and press Enteror click theApply button.
To remove the currently displayed filter string and re-display all packets, click the Reset button.
If you click the Filter: button itself, the Display Filter dialog box will be dis-played.This feature is described in the section entitled “Analyze”.
Information Field
The Information field displays the name of the capture file or information about the protocol field selected in the Protocol Tree Window.
Exploring the Menus
All of the functionality available within Ethereal is accessible from the Menu Bar. In this section we will systematically explore that functionality and provide examples of its use.
File
The File menu provides access to loading, saving and printing capture files, as seen in Figure 4.8.File menu options are defined in Table 4.5.
www.syngress.com
Table 4.5 File Menu Options
Menu Option Description
Open… Open a capture file.
Close Close the current capture file.
Save Save the current capture file.
Save As… Save the current capture file with a different file-name/format.
Export Display the Exportsubmenu allowing the por-tion of the packet highlighted in the Data View Window to be exported as a hexadecimal dump. Print… Print the current capture file.
Quit Quit the Ethereal application.
Open
To open a file (Figure 4.9),select File | Open.
The Open dialog box provides normal mechanisms for navigation in selecting a file. Additionally, it provides a Filter:field where an Ethereal display filter string can be entered to filter which packets are read from the capture file. Clicking the Filter:button will open the Display Filter dialog box.The Display Filter dialog box is described in the section entitled “Analyze”.
The Open dialog box also has checkboxes to enable name resolution for MAC addresses, network names, and transport names.To open a file, browse to the correct location and select the desired file, optionally provide a filter string, and enable or disable the name resolutions you wish to use. Finally, click the OK
button.
www.syngress.com
Ethereal Name Resolution
Ethereal provides three kinds of name resolution to make some of the numbers found in network protocols more comprehensible. You can choose to enable or disable MAC name resolution, network name reso-lution, and transport name resoreso-lution, when opening a file, starting a capture, or while a capture is running. It is useful to understand what the different name resolutions mean.
Every host on a LAN is identified by a unique six-byte MAC address. These addresses are used in Ethernet frames to provide source and destination addresses at the Datalink Layer. MAC addresses are sup-posed to be globally unique. To achieve this end the IEEE (Institute of Electrical and Electronic Engineers), assigns blocks of MAC addresses to manufacturers. The first three bytes of every MAC address designate the manufacturer who produced the device. Ethereal is shipped with a list of the assigned prefixes and the manufacturers to whom they’ve been assigned. When you select the Enable MAC name resolutioncheckbox in the Open dialog box, Ethereal will resolve the first three bytes of the MAC address to a manufacturer and display that information for each MAC address. For example the prefix 00:00:0c has been assigned to Cisco Systems. When MAC address resolution is enabled Ethereal will display the MAC address 00:00:0c:35:0e 1c as 00:00:0c:35:0e:1c (Cisco_35:0e:1c).
Every node on an IP network has an IP address. If you select the
Enable network name resolution checkbox Ethereal will perform a reverse Domain Name System (DNS) lookup when it encounters an IP address to determine its associated domain name (like www.syngress.com). Ethereal will then display this domain name with the IP address. For example, the IP address 66.35.250.150 can be resolved via reverse DNS to the domain name slashdot.org. If network name resolution is enabled, Ethereal will display it as slashdot.org (66.35.250.150).
Transport layer protocols like TCP and UDP (User Datagram Protocol, a connectionless transport protocol over IP defined in RFC 768 and viewable at www.ietf.org/rfc/rfc0768.txt?number=768) typically provide some form of multiplexing by allowing a source and destination
Notes from the Underground…
Save As
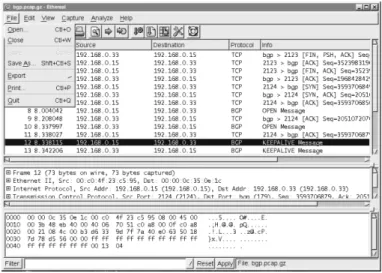
The Save As dialog box, shown in Figure 4.10, is displayed by selecting File |
Save As, or by selecting File | Save for a capture that has not previously been saved to file.
The Save As dialog box allows you to perform normal tasks for saving a cap-ture file in the desired place and with the desired name.You can choose to save only the packets that pass the currently active display filter by enabling the Save only packets currently being displayed checkbox, or to save only marked packets by enabling the Save only marked packets checkbox. Marking packets
www.syngress.com
port to be specified. As a result, two hosts can have multiple clearly delineated conversations between them at the same time, as long as they have unique source port/destination port pairs for each conversa-tion. Many protocols that use TCP or UDP for their transport layer have well-known ports that servers for those protocols traditionally listen on. When you select the Enable transport name resolution checkbox, Ethereal will display the name of the service that traditionally runs over each port. This behavior can be seen in many of our examples, where the port 179has been labeled by the protocol that is well known to run over that port: bgp. It’s important to note that most ports have no protocols associated with them.
will be explained later in the “Edit” section. Selecting both checkboxes will save only those marked packets that match the current display filter.
Finally, you can choose to save the file in one of a large number of supported capture file formats (Figure 4.11).
The Print dialog box is displayed by selecting File | Print (Figure 4.12). Figure 4.11 Save As Dialog: File Formats
The Print dialog box allows you to provide answers to the three questions relevant to printing in Ethereal:
1. How are you going to print?
2. Which packets are you going to print?
3. What information are you going to print for each packet?
The Printer section allows you to choose which packets you are going to print.You can choose as your output format either Plain Textor Postscript. Once you have selected your output format you may choose to print the output to a file by enabling the Output to File: checkbox and providing a filename in the Output to File: textbox. If you do not choose to print to file then you may provide a command to be executed to print in the Print command:textbox.
The Print Rangesection allows you to choose which packets you are going to print.You may choose to print only the packet currently selected in the Summary Window, only packets that are marked in the Summary Window (marked packets are discussed later in the “Edit” section), all packets displayed in the Summary Window by the currently applied filter, or all packets captured.You can choose to print only the packet currently selected in the Summary Window by selecting the Selected packet only radio button.To print only the packets that have been marked in the Summary Window, select the Marked packets onlyradio button. And, to print all packets displayed in the Summary Window by the currently applied display filter, selecting the All packets displayedradio button. Printing all packets displayed means that all packets that pass the currently applied filter will print, not just the packets that are currently visible in the Summary Window. If you are able to scroll up or down to a packet in the Summary Window,it is considered to be “displayed” for the purposes of this print range option.You can print all packets in the capture by selecting the All packets captured radio button.
The Packet Format section allows you to choose which information you are going to print for each packet. If you do not enable the Print packet detailscheckbox, then for each packet a one-line summary consisting of the columns currently being displayed in the Summary Window will be printed. Consider, for example, the state of Ethereal in Figure 4.3. Packet 8 is selected. If the Print packet details checkbox is unselected, the result of printing only the selected packet (packet 8) would be:
No. Time Source Destination Protocol Info
8 8.004042 192.168.0.15 192.168.0.33 BGP OPEN Message www.syngress.com
This output had some whitespace removed to contract it to fit the space. If you do enable the Print packet details checkbox, then more detailed informa-tion will be printed.
The Detailssection allows you to choose which details are printed for a packet when you have enabled the Print packet details checkbox.You may choose to print the protocol tree with all subtrees collapsed, the protocol tree with subtrees expanded (but only if those subtrees are expanded in the Protocol Tree Window), or with all subtrees in the protocol tree expanded. If you select the All dissections collapsedoption, the protocol tree will be printed with all subtrees collapsed. For the situation shown in Figure 4.3, printing only the selected packet, the output would look like:
Frame 8 (83 bytes on wire, 83 bytes captured)
Ethernet II, Src: 00:c0:4f:23:c5:95, Dst: 00:00:0c:35:0e:1c
Internet Protocol, Src Addr: 192.168.0.15 (192.168.0.15), Dst Addr: 192.168.0.33 (192.168.0.33)
Transmission Control Protocol, Src Port: 2124 (2124), Dst Port: bgp (179), Seq: 3593706850, Ack: 2051072070, Len: 29
Border Gateway Protocol
If you select the Dissections as displayedoption, the protocol tree will be printed with those subtrees expanded that would be expanded in the Protocol Tree Window if that packet was selected in the Summary Window. Using this option to print only the selected packet from Figure 4.3 would produce output like:
Frame 8 (83 bytes on wire, 83 bytes captured)
Ethernet II, Src: 00:c0:4f:23:c5:95, Dst: 00:00:0c:35:0e:1c
Internet Protocol, Src Addr: 192.168.0.15 (192.168.0.15), Dst Addr: 192.168.0.33 (192.168.0.33)
Transmission Control Protocol, Src Port: 2124 (2124), Dst Port: bgp (179), Seq: 3593706850, Ack: 2051072070, Len: 29
Border Gateway Protocol OPEN Message
Marker: 16 bytes Length: 29 bytes Type: OPEN Message (1) Version: 4
My AS: 65033 Hold time: 180
BGP identifier: 192.168.0.15
Optional parameters length: 0 bytes
If you select the All dissections expanded option, the protocol tree will be printed with all subtrees expanded. Printing just the selected packet in Figure 4.8 with this option would produce the output:
Frame 8 (83 bytes on wire, 83 bytes captured) Arrival Time: Mar 29, 2000 23:56:56.957322000
Time delta from previous packet: 0.000088000 seconds Time since reference or first frame: 8.004042000 seconds Frame Number: 8
Packet Length: 83 bytes Capture Length: 83 bytes
Ethernet II, Src: 00:c0:4f:23:c5:95, Dst: 00:00:0c:35:0e:1c Destination: 00:00:0c:35:0e:1c (Cisco_35:0e:1c)
Source: 00:c0:4f:23:c5:95 (DellComp_23:c5:95) Type: IP (0x0800)
Internet Protocol, Src Addr: 192.168.0.15 (192.168.0.15), Dst Addr: 192.168.0.33 (192.168.0.33)
Version: 4
Header length: 20 bytes
Differentiated Services Field: 0x00 (DSCP 0x00: Default; ECN: 0x00) 0000 00.. = Differentiated Services Codepoint: Default (0x00) .... ..0. = ECN-Capable Transport (ECT): 0
.... ...0 = ECN-CE: 0 Total Length: 69
Identification: 0x48e9 (18665) Flags: 0x04
.1.. = Don't fragment: Set ..0. = More fragments: Not set Fragment offset: 0
Time to live: 64 Protocol: TCP (0x06)
Header checksum: 0x7049 (correct) Source: 192.168.0.15 (192.168.0.15) Destination: 192.168.0.33 (192.168.0.33)
Transmission Control Protocol, Src Port: 2124 (2124), Dst Port: bgp (179), Seq: 3593706850, Ack: 2051072070, Len: 29
Source port: 2124 (2124) Destination port: bgp (179) Sequence number: 3593706850 Next sequence number: 3593706879 Acknowledgement number: 2051072070 Header length: 20 bytes
Flags: 0x0018 (PSH, ACK)
0... .... = Congestion Window Reduced (CWR): Not set .0.. .... = ECN-Echo: Not set
..0. .... = Urgent: Not set ...1 .... = Acknowledgment: Set .... 1... = Push: Set
.... .0.. = Reset: Not set .... ..0. = Syn: Not set .... ...0 = Fin: Not set Window size: 32120
Checksum: 0x1903 (correct) Border Gateway Protocol
OPEN Message
Marker: 16 bytes Length: 29 bytes Type: OPEN Message (1) Version: 4
My AS: 65033 Hold time: 180
BGP identifier: 192.168.0.15
Optional parameters length: 0 bytes
Regardless of the option you choose for expanding protocol tree subtrees, if you enable the Packet hex datacheckbox, following the protocol tree for each packet will be a hex dump of that packet. Printing only the packet selected in Figure 4.3, with the All dissections collapsed checkbox enabled and the
Packet hex data checkbox enabled would produce this output: Frame 8 (83 bytes on wire, 83 bytes captured)
Internet Protocol, Src Addr: 192.168.0.15 (192.168.0.15), Dst Addr: 192.168.0.33 (192.168.0.33)
Transmission Control Protocol, Src Port: 2124 (2124), Dst Port: bgp (179), Seq: 3593706850, Ack: 2051072070, Len: 29
Border Gateway Protocol
0000 00 00 0c 35 0e 1c 00 c0 4f 23 c5 95 08 00 45 00 ...5....O#....E. 0010 00 45 48 e9 40 00 40 06 70 49 c0 a8 00 0f c0 a8 .EH.@[email protected]... 0020 00 21 08 4c 00 b3 d6 33 9d 62 7a 40 e0 46 50 18 [email protected]. 0030 7d 78 19 03 00 00 ff ff ff ff ff ff ff ff ff ff }x... 0040 ff ff ff ff ff ff 00 1d 01 04 fe 09 00 b4 c0 a8 ... 0050 00 0f 00 ...
www.syngress.com
Ghost of Ethereal Future: Print Dialog Improvements
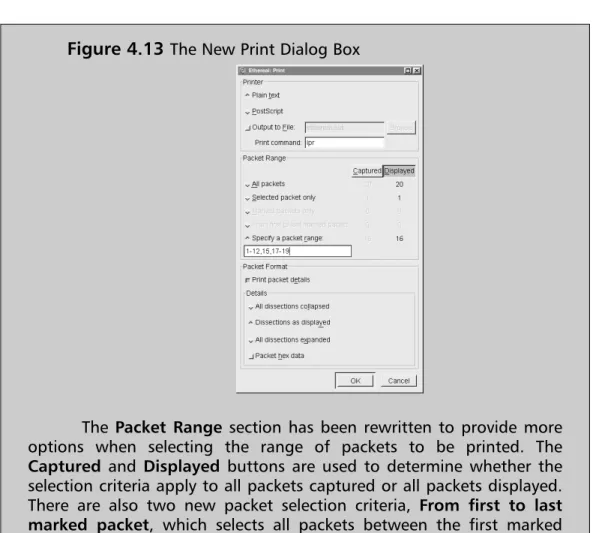
Ethereal evolves very rapidly. It is not uncommon for there to be a new release of the software every four to six weeks. As a result, some things will change over time. An example of this is the Print dialog box, which has already been changed in CVS (Concurrent Version System, the source code control mechanism used by Ethereal) since the release of the 0.10.0a version of Ethereal (the latest release version as of the writing of this book). The new Print dialog box, which will likely be in Ethereal version 0.10.1, is shown in Figure 4.13Notes from the Underground…
Edit
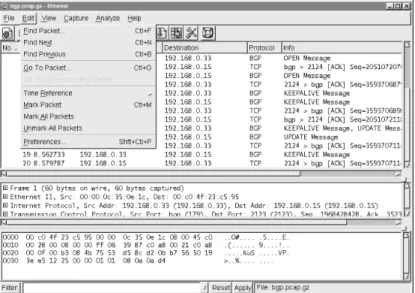
The Edit menu, shown in Figure 4.14, allows you to find and mark packets, as well as set user preferences. Descriptions of the Edit menu options are given in Table 4.6.
The Packet Range section has been rewritten to provide more options when selecting the range of packets to be printed. The
Captured and Displayed buttons are used to determine whether the selection criteria apply to all packets captured or all packets displayed. There are also two new packet selection criteria, From first to last marked packet, which selects all packets between the first marked packet and the last marked packet, and Specify a packet range, which will allow you to specify a packet range like the one shown in Figure 4.13: 1-12,15,17,17-19.
Table 4.6 Edit Menu Options
Menu Option Description
Find Packet… Search for a packet using a display filter or by searching for a matching hexadecimal string or character string.
Find Next Find the next packet that matches the search defined in the Find Packet dialog box.
Find Previous Find the previous packet that matches the search defined in the Find Packet dialog box.
Go To Packet… Go to a packet by frame number.
Go To Corresponding Packet When a field that refers to another frame is selected in the Protocol Tree Window,select the packet being referred to in the Summary
Window.
Time Reference A submenu for manipulating time references (for more details, see the section entitled “Time Reference Submenu”.
Mark Packet Mark the packet currently selected in the
Summary Window. If the selected packet is already marked, then unmark it. Marking pro-vides a mechanism for manually selecting a packet or group of packets to be subsequently printed or saved.
www.syngress.com
Figure 4.14 Edit Menu
Table 4.6 Edit Menu Options
Menu Option Description
Mark All Packets Marks all packets that match the currently applied display filter.
Unmark All Packets Unmark all packets that match the currently applied display filter.
Preferences… Change user preferences, including preferences for packet decodes.
Find Packet
The Find Packet dialog box, show in Figure 4.15, is displayed when you select
Edit | Find Packet….
The Find Packet dialog box allows you to answer the three questions relevant to finding a packet in Ethereal:
1. What are we trying to find?
2. Which direction should we search in? 3. What type of thing are we trying to find? Figure 4.15 Find Packet Dialog Box
The Filter:textbox allows you to define a search criteria by entering a string such as a display filter string, hex string, or ASCII string. If you need assistance constructing a filter string you can click the Filter: button to display the Display Filter dialog box.The Display Filter dialog box is described in more detail in the in the section entitled “Analyze”.
The Directionsection allows you to choose which direction you wish to search in–Forward from the packet currently selected in the Summary Window, or Backward from the packet currently selected in the Summary Window.
The Find Syntax section allows you define your search criteria.You may choose to search for packets that match a display filter string, packets that contain a hex string, or packets that contain a character string. If you select the Display Filteroption, the string in the Filter:textbox will be interpreted as a display filter string and you will search for matches to that display filter string. If you select the Hex option, the string in the Filter: textbox will be interpreted as a hex string and you will search for packets that contain that hex string.
If you select the String option, the string in the Filter:will be interpreted as a character string and you will search for packets that contain that character string.
The search for character strings is handled differently than the search for hex strings. Hexadecimal string searches attempt to search for a packet containing a particular sequence of bytes anywhere in the raw data of that packet.The search for character strings will not look for a packet that contains a string anywhere in the packet. Instead, you can use the Search Insection to specify whether to look for the string in the Packet data left over after decoding all possible fields, look for the character string in the Decoded packet displayed in the Protocol Tree Window, or look for the character string in the one-line Packet summary
in the Summary Window. If you select the Packet data option, Ethereal will search for the character string in the packet data. By packet data, we mean the data in the packet that is left over after decoding the protocol fields. Selecting the
Find Decoded packet will cause Ethereal to search for the character string in the protocol field strings that are displayed in the Protocol Tree Window. It does not matter if the subtree of the protocol tree containing the character string is collapsed or expanded. If you use the Decoded packetoption, you must also use the Character Set drop-down list to select the character set for the char-acter string you are trying to find.To make your charchar-acter string search case-insensitive, enable the Case Insensitive Searchcheckbox.
Go To Packet
The Go To Packet dialog box, shown in Figure 4.16, can be displayed by selecting Edit | Go To Packet Dialog.
Enter a packet number in the Packet Numbertextbox and click OK.The packet with that packet number will be selected in the Summary Window.
Time Reference Submenu
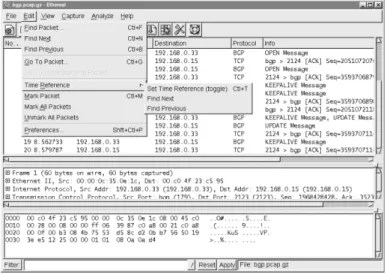
The Time Reference submenu, shown in Figure 4.17, is displayed when you select Edit | Time Reference.The Time Reference submenu options are described in Table 4.7.
Figure 4.16 Go To Packet Dialog Box
Table 4.7 Time Reference Submenu Options
Menu Option Description
Set Time Reference (toggle) Sets the packet currently selected in the Summary Window as a time reference packet. Find Next Finds the next time reference packet after the
packet currently selected in the Summary Window.
Find Previous Find the previous time reference packet before the packet currently selected in the Summary Window.
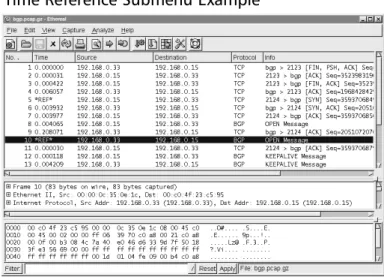
When the Timecolumn in the Summary Window is configured to display the time that has elapsed since the beginning of the capture, then the time dis-played is the number of seconds since the beginning of the capture or the last time reference packet.
In Figure 4.18 , we have set packets 5 and 10 as time reference packets.This is indicated by their Timecolumn value (*REF*). Packets 1-4 are marked with the time since the beginning of the capture in which they were captured. Packets 6-9 are marked with the time since the time referencepacket 5. Packets 11 and greater are marked with the time since the time reference packet 10.
www.syngress.com
Preferences
The Preferences dialog box, shown in Figure 4.19, is displayed when you select
Edit | Preferences….
The Preferences dialog box allows you to set preferences for various subsys-tems of Ethereal, including setting preferences for decodes of various protocols. To edit preferences for an area of Ethereal, like Columnsin Figure 4.19, select that area from the box on the left and change the settings displayed in the box on the right. It is strongly recommended that you browse through the protocol preferences for any protocol you use frequently, as protocol preferences can change the way a protocol is decoded or displayed.
When you have made your changes to Ethereal’s preferences you can choose to apply them without closing the Preference dialog box by clicking the Apply
button.To apply your settings and close the Preferences dialog box, click the OK
button.To save your preferences for use in a different Ethereal session, click the
Save button.
N
OTEThe Columnspreference, selected in Figure 4.19, is subtly broken in Ethereal. You can add, delete, or reorder columns in the Preferences dialog box, but your changes will not take effect unless you save them, then exit and restart Ethereal.
View
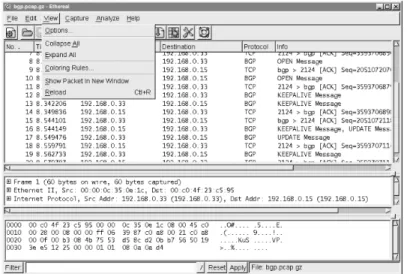
The View menu, shown in Figure 4.20, allows you to control how packets are displayed in the Summary Window, and the Protocol Tree Window.You can also set up color filters to color the packets in the Summary Window.The View
menu options are described in Table 4.8.
Table 4.8 View Menu Options
View Submenu Options
Menu Option Description
Options… Set the View options.
Collapse All Collapse all subtrees in the Protocol Tree Window Expand All Expand all subtrees in the Protocol Tree Window www.syngress.com
Figure 4.20 View Menu
Table 4.8 View Menu Options
View Submenu Options
Menu Option Description
Coloring Rules… Create and edit color filters to colorize the packets in the Summary Window that match a given display filter string.
Show Packet In For the packet currently selected in the Summary New Window Window display it’s Protocol Tree Window and Data
View Window in a new window. Reload Reload the current capture file.
Display Options
The Display Options dialog box, shown in Figure 4.21, is displayed when you select View | Options….
The Display Options dialog box allows you to choose which time value will be displayed in the Timecolumn of the Summary Window, whether automatic scrolling will be enabled for live captures, and what type of name resolution will be enabled.
For a given packet, you may choose to have the Timecolumn in the Summary Window display the Time of day when that packet was captured,
Date and time of day when that packet was captured,Seconds since begin-ning of capture (or the last time reference packet) that packet was captured, or the Seconds since the previous framethat matched the current display filter. Figure 4.21 Display Options Dialog Box
In a live capture, you can choose to have old packets scroll up and out of view as new packets are captured and appended to the end of the Summary Window.To do so, enable the Automatic scrolling in live capture checkbox. You may choose your name resolution options in the Display Options dialog box as well. Refer back to the section entitled “Open” for more information about name resolution choices.
Apply Color Filters
The Apply Color Filters dialog box, shown in Figure 4.22, can be displayed by selecting View | Coloring Rules….
Ethereal has the ability to color packets in the Summary Window that match a given display filter string, making patterns in the capture data more visible.This can be immensely useful when trying to follow request response protocols where variations in the order of requests or responses may be interesting.You can color such traffic into as many categories as you’d like and will be able to see at a glance what is going on from the Summary Window instead of having to go through the Protocol Tree Window for each packet.
To create a color filter click the Newbutton in the Apply Color Filters dialog box.The Edit Color Filter dialog box will be displayed (Figure 4.23).
www.syngress.com
When the Edit Color Filter dialog box is first opened, the Nametextbox will have the string namein it, and the String field will contain the string filter. To create a color filter you should first fill in a name for it in the Nametextbox. Then, you should enter a filter string in the String textbox.You may use the
Add Expressionbutton to display the Filter Expression dialog box to assist you in constructing a filter string.The Filter Expression dialog box is described in the section entitled “Analyze”. Once you have a name and filter string you are happy with, you need to select the foreground and background color to colorize the packets matching your filter string. Click the Background Color… button to set the foreground color, as shown in Figure 4.24.
When you are happy with the color you have selected click the OKbutton. The Edit Color Filter dialog box (Figure 4.25) will be displayed.
Figure 4.23 Edit Color Filter Dialog Box
In Figure 4.25 we have created a filter named BGP Update with a filter string
bgp.type == 2.The name and filter string will be colored to match our back-ground color choice. Click the Foreground Color… button to set the fore-ground color and proceed as you did with the backfore-ground color. When you are happy with your name, filter string, and text coloring click the OKto close the Edit Color Filter dialog box.
www.syngress.com
Figure 4.25 Edit Color Filter
Ghost of Ethereal Future: GTK+2
Ethereal uses a widget set to provide its GUI elements (buttons, menus, radio buttons, file dialogs, color selection dialogs, etc.) called GTK+ (Gimp Tool Kit, www.gtk.org). By default, Ethereal builds with GTK+1, and so all of the screenshots you’ve seen in this book use GTK+1. There is already code in place in Ethereal for GTK+2, the next version of the GTK+ library. Many elements look very similar in GTK+2, just slightly cleaner, but a few things look very different. One of them is the color selection widget used in the Foreground Color and Background Color dialog boxes.You can see the new GTK+2 Foreground Color dialog box for Ethereal in Figure 4.26:
Notes from the Underground…
Figure 4.27 shows the Apply Color Filters dialog box now populated with the new BGP Update entry and a BGP filter.
Click the OKbutton to apply the changes and close the dialog box. Click
Applyto apply the changes and leave the dialog box open. If you wish to use your color filters with another Ethereal session, click Save.
If you click the Revert button, all coloring will be removed from the Summary Window, the color filters will be removed from the Filterlist, and the
Figure 4.26 GTK+2 Foreground Color Dialog Box
saved color file will be deleted. Use the Export or Import buttons to export your color filters to another file or import the color filters from a file of your choice.This is very useful for sharing color filters with coworkers or between different machines on which you have Ethereal installed.Notice the order of the color filters in the Filter list in Figure 4.27. For every packet in the Summary View the color filters strings will be tried in order until one is matched. At that point, its associated color will be applied.The filters in the Filter list are applied from the top down, so the BGP Updatecolor filter will be tried first. Only if the
BGP Updatecolor filter does not match a packet will Ethereal proceed to try the
BGP color filter to that packet. An example of the application of these color fil-ters can be seen in Figure 4.28.
In Figure 4.28, the BGP Update messages (lines 16 and 17) are black text on light blue, not white text on dark blue, even though they would also match the white text on dark blue BGP color filter.This is because the black text on light blue BGP Updatefilter is applied first, and since it matches, no further color filter is tried.
Show Packet in New Window
You can display a packet’s Protocol Tree Window and Data View Window in a new window by selecting a packet in the Summary Window and selecting View | Show Packet in New Window (see Figure 4.29).This is useful when you would like to be able to see detailed information about more than one packet at
www.syngress.com
once. Note that the title bar shows the same information as the summary line for this packet in the Summary Window.
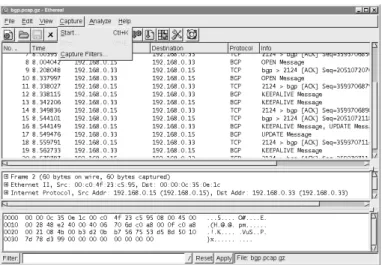
Capture
The Capturemenu is shown in Figure 4.30, and the menu entries are explained in Table 4.9.
Figure 4.29 Show Packet in New Window
Table 4.9 Capture Menu Options
Menu Option Description
Start… Start a capture.
Stop Stop a running packet capture.
Capture Filters… Edit the capture filters.
Capture Options
The Capture Options dialog box, shown in Figure 4.31, can be displayed by selecting Capture | Start….
This dialog box allows us to answer the basic questions about capturing data: 1. What traffic are we capturing?
2. Where are we saving it? 3. How are we displaying it? 4. When do we stop capturing?
www.syngress.com
The Capturesection allows us to choose which traffic we are capturing. When choosing what traffic to capture we can ask:
1. Which interface are we capturing from? 2. How much of each packet are we capturing?
3. Which packets arriving at the interface are we capturing?
The Interface drop-down list allows us to choose which interface we are going to be capturing from.You can choose from the interfaces listed in the drop–down list, or if the interface you are seeking isn’t listed there, you can enter it manually in the textbox. If both libpcap and the interface you select support multiple link layers for that interface, you can choose which link layer header type to capture using the Link-layer header type:selector.
The Limit each packet to field allows you to choose to capture less than the entire packet. If you enable the Limit each packet to checkbox and pro-vide a number in the Limit each packet to textbox, then only the first
number of bytes you indicate will be captured from each packet. Be aware that if you choose to capture less than the full packet Ethereal may mark many of your packets as fragments.This is because all of the data expected by the dissectors in Ethereal may not be present due to the packets having been truncated.
The Capture packets in promiscuous modecheckbox and the Filter:
textbox allow you to choose which packets arriving at the interface will be cap-tured. If you enable the Capture packets in promiscuous mode checkbox, Ethereal will put the interface into promiscuous mode before capturing data. Normally, an interface only passes onto the operating system packets that are addressed to the link layer address assigned to that interface. When an interface is in promiscuous mode it passes on all packets arriving at the interface to the operating system. So, if you choose not to capture in promiscuous mode, you will only capture packets addressed to or being sent by the interface on which you are capturing. If you choose to capture in promiscuous mode you will capture all packets arriving at the interface. Entering a tcpdump-style capture filter in the
Filter textbox will cause Ethereal to only capture packets matching that capture filter. If you click on the Filter button then the Edit Capture Filter List dialog box will be displayed to allow you to choose among previously defined capture filters. See the section entitled “Edit Capture Filter List” for more details.
The Capture File(s)section allows you to choose where to save the capture. If you choose to leave this section blank, Ethereal will save the capture to a tempo-rary file, and you can choose to save the capture at some later point by selecting
File | SaveAs. If you enter a filename in the Filetextbox, Ethereal will save the capture to that file. Clicking the File button will open the Save As dialog box. If you enable the Use ring buffer checkbox, you can save your capture to a ring buffer. Saving to a ring buffer will be dealt with in a separate section.
The Display optionssection allows you to choose how you are going to display packets as they are captured. By default, Ethereal does not update the list of packets in the Summary Window during capture, but only once the capture is stopped. If you enable the Update list of packets in real timecheckbox, Ethereal will update the Summary Window as soon as a packet is captured and processed. By default, when Ethereal is updating the Summary Window during live capture, new packets are appended to the end of the Summary Window, and the Summary Window does not scroll up old packets to reveal new ones.To have the Summary Window scroll up to display the most recent packets, enable the
Automatic scrolling in live capture checkbox. If you change your mind about whether you want automatic scrolling once a capture has started, you can select View | Optionsto enable or disable this feature.
The Capture limits section allows you to choose when to stop capturing. You can, of course, always manually stop a capture by selecting Capture | Stop, but it is sometimes convenient to set conditions under which the capture will automatically stop.There are three types of automatic limits to a capture sup-ported by Ethereal:
1. Capture a specified number of packets.
2. Capture a specified number of kilobytes of traffic. 3. Capture for a specified number of seconds.
Ethereal will allow you to set up any combination of these three limits simul-taneously–it is possible to limit the number of packets, the number of kilobytes, and the number of seconds at the same time. Whenever one of the limits is satis-fied, the capture will stop.
If you enable the Stop capture after… packet(s) captured checkbox and enter a number of packets in the Stop capture after… packet(s) captured
textbox, the capture will stop when it has reached the specified number of packets. If you enable the Stop capture after… kilobyte(s) captured
checkbox and enter a number of kilobytes in the Stop capture after… kilo-bytes(s) captured textbox, the capture will stop once it has reached the speci-fied number of kilobytes. If you enable the Stop capture after… seconds(s)
checkbox and enter a number of packets in the Stop capture after…
onds(s)textbox, the capture will stop when the specified number of seconds have elapsed since the beginning of the capture.
The Name resolutionsection allows you to choose the name resolution options for the capture. Name resolution options are described earlier in the chapter in the section entitled “Open”.
When you have specified your capture choices via the Capture Options dialog box, you can start the capture by clicking the OK button.The Capture Dialog will then be displayed, as shown in Figure 4.32.
The Capture dialog box displays the number of packets of various protocols that have been captured, and the percentage of all captured traffic consisting of those protocols. In Figure 4.32 a total of 707 packets have been captured, of which 363 (51.3%) are TCP packets, 4 (0.6%) are UDP packets, and 340 (48.1%) are ARP (Address Resolution Protocol) packets.You can stop the capture at any time by clicking the Stop button.
Ring Buffer Captures
There are applications in which it makes sense to capture network traffic to a series of smaller files. Frequently, you may want to limit the number of such smaller files, and delete the oldest when starting a new one. Such a structure is called a ring buffer, because conceptually the data fills up a buffer and when it reaches the end it loops back to the beginning.
There are certain questions that need to be answered about using ring buffer files:
1. How many capture files in the ring buffer? 2. What are those capture files named?
3. When do we rotate to the next capture file?
To enable ring buffer captures, access the Capture Options dialog box and enable the Use ring buffercheckbox.The appearance of the Capture Options dialog box will change, as shown in figure 4.33.
The Rotate capture file every… second(s)checkbox becomes available and the Stop capture after… kilobytes captured checkbox is renamed
Rotate capture file very… kilobyte(s)and becomes unavailable.
The Number of filestextbox allows you to choose how many files are in the ring buffer. If you choose zero, the number of ring buffer files is assumed to be infinite–no old files will be deleted to make room for new files.
The File textbox provides the base name for the filenames in the capture ring buffer.The base name is broken up into a prefix and a suffix.The filename of a ring buffer capture file is prefix_NNNNN_YYYYMMDDhhmmss.suffix. Where NNNNN is a five-digit zero-padded count indicating the sequence number of the ring buffer file,YYYY is a four-digit year, MM is the two-digit
www.syngress.com
padded month, DD is a two-digit padded date, hh is a two-digit padded hour, mm is a two-digit padded minute, and ss is a two-digit zero-padded second. For example, if the file foo.bar.libpcap was the fifth capture file in the ring buffer created at 23:21:01 on January 8, 2004, it would be named
foo.bar_00005_20040108232101.libpcap. It is important to note that the sequence numbers in the filenames increase monotonically. If a ring buffer has three files in it, when the fourth capture file is started it will have the sequence number
00004, and the file with the sequence number 00001 will be deleted.The sequence numbers are not recycled as we loop through the ring.
The Rotate capture file every… kilobyte(s)textbox and the optional
Rotate capture file every… second(s)textbox allow you to choose when the capture files will be rotated.You must provide a kilobyte limit to the size of a cap-ture file in the ring buffer by entering a number (or accepting the default value) in the Rotate capture file every… kilobyte(s) textbox. If a capture file reaches the number of kilobytes you have specified, a new capture file will be created to store any new packets captured, and the oldest capture file in the ring buffer may be deleted if the new capture file puts you over the limit specified in the Number of filestextbox. If you enable the Rotate capture file every… second(s)
checkbox and enter a number of seconds in the Rotate capture file every… second(s)textbox, if a capture file has been open for the number of seconds you specify, a new capture file will be created to store any new packets captured.The oldest capture file in the ring buffer may then be deleted if the new capture file puts you over the limit specified in the Number of files textbox.
N
OTEThe Use ring buffer checkbox is incompatible with the Update list of packets in real time checkbox, and Ethereal will not allow you to enable Use ring buffer if you have already enabled Update list of packets in real time. Unfortunately, the reverse is not true–Ethereal will allow you to select Update list of packets in real timeif Use ring buffer has already been selected. When this occurs, the Use Ring buffer
checkbox will automatically (and without warning) be disabled. This, in turn, causes the Rotate capture file every… kilobyte(s)checkbox to revert to Stop capture after… kilobyte(s), but it is left still selected, and with a value set (1 kilobyte by default). The net result is that not only do you not get a ring buffer capture in such a situation, but you also get your capture stopped after 1 byte.
www.syngress.com
Handling Large Captures
Into everyone’s life eventually falls a problem that involves enormous amounts of network data to analyze. Maybe it’s an intermittent problem that happens only every couple of days where you need to see the mes-sage exchange that leads up to the problem. Maybe it’s a problem on a fairly active network. Whatever the reason, the issue of capturing and analyzing large amounts of network traffic is a common one. As cap-tures become larger, Ethereal consumes more memory, and filtering or finding packets begins to take a very long time.
In these situations it is best to use Tethereal, the console-based ver-sion of Ethereal, to do the actual capture and initial processing of the data. To capture to from an interface <interface> to a file <savefile> use this command:
tethereal –i <interface> -w <savefile>
If you have a limited amount of space and/or want to limit the size of your capture files, you can use the ring buffer functionality with Tethereal to capture from interface <interface> to <num_capture_files> capture files with maximum size each <filesize> and base filename <savefile> by executing the following at the com-mand line:
tethereal –i <interface> -w <savefile> -b <num_capture_files> -a filesize:<filesize>
Once you have captured the data you need, you can then use Tethereal to prune down the capture to a more manageable size. To use a display filter string <filter string> to filter a capture file <savefile> and save the results to a new capture file <newsavefile>, you would execute the following at the command line:
tethereal –r <savefile> -w <newsavefile> -R <filter string>
An example might be if you needed to extract all packets from the capture file that were captured between Jan 8, 2004 22:00 and Jan 8, 2004 23:00. To perform this feat you would execute the following at the command line:
Tools & Traps…
Edit Capture Filter List
The Edit Capture Filter List dialog box is displayed by selecting Capture | Capture Filters…(Figure 4.34).
This dialog box allows you to create new tcpdump-style capture filters, described in Chapter 5, and to save them for later use.To create a new capture filter, provide a name for your filter in the Filter name textbox, provide a tcp-dump style capture filter string in the Filter string textbox, and click the New
button. In Figure 4.35 we have created a capture filter named HTTP Traffic that provides filter string port 80.
tethereal –r <savefile> -w <newsavefile> -R '(frame.time >= "Jan 8, 2004 22:00:00.00" ) && (frame.time <= "Jan 8, 2004 23:00:00.00")'
Once you have pruned the data down to a size where Ethereal’s performance is workable, open the capture file in Ethereal to perform more involved analysis.
You can select an existing capture filter from the Capture Filterslist and choose to change, delete, or copy it.To change an existing capture filter, select it from the Capture Filters list, change its name in the Filter name textbox and/or change its tcpdump style capture filter string in the Filter string textbox and then click the Changebutton.To copy an existing capture filter, select the capture filter from the Capture Filterslist and click the Copy, as shown in Figure 4.36.
You can delete a capture filter by selecting it from the Capture Filterslist and clicking the Delete button. If you wish to have your list of capture filters available in a subsequent Ethereal session, then you must click the Save button to save them to disk.
www.syngress.com
Figure 4.35 Edit Capture Filter List Dialog Box Example
Analyze
The Analyze Menu is shown in Figure 4.37, and it’s options are explained in Table 4.10.
Table 4.10 Analyze Menu Options
Menu Option Description
Display Filters… Edit the display filters.
Match Submenu for preparing and applying a display filter based upon the protocol field selected in the Protocol Tree Window.
Prepare Submenu for preparing a display filter based upon the protocol field selected in the Protocol Tree Window.
Enabled Protocols… Enable and disable the decoding of individual protocols.
Decode As… Specify decoding certain packets as being part of a particular protocol.
User Specified Decodes Report which user specified decodes are currently in force.
Follow TCP Stream Display an entire TCP stream at once.
TCP Stream Analysis Submenu for choosing a TCP Stream Analysis tool.
Figure 4.37 Analyze Menu
Table 4.10 Analyze Menu Options
Menu Option Description
Summary Display a summary of the capture file.
Protocol Hierarchy Display statistics in a tree view for the protocols
Statistics in the capture.
Statistics Submenu for choosing a Statistics tool.
Edit Display Filter List
The Edit Display Filter List dialog box, shown in Figure 4.38, can be displayed by selecting Analyze | Display Filter....
This dialog box is designed to help you construct a filter string.To create a new filter string, click the Add Expressionbutton.The Filter Expression dialog box (Figure 4.39) will be displayed.
www.syngress.com
Select the protocol you are interested in for your filter expression and expand it to show which of its fields can be filtered. Select the desired filter field. When you pick a relation other than is present, the Filter Expression dialog box will change to show your options for that field, as shown in Figure 4.40.
In this case, we have chosen the equality (==) relation.You can choose the value you wish to match and click the Acceptbutton.The result will be to Figure 4.39 Filter Expression Dialog Box
insert the filter expression you just constructed into the Filter string: textbox (Figure 4.41)
If you wish to save the filter string you have just created, type a name in the
Filter nametextbox and click the New button.The filter string will be added to the Display Filters List dialog box (Figure 4.42)
You can select an existing display filter from the list and choose to change, delete, or copy it.To change an existing display filter, select it from the list,
www.syngress.com
Figure 4.41 Edit Display Filter List Dialog Box: Filter String
change its name in the Filter name textbox and/or change its display filter string in the Filter string textbox and then click the Changebutton.To copy an existing display filter, select it from the list and click the Copybutton.
You can save the list for use in later Ethereal sessions by clicking the Save
Button.
If you have accessed the Edit Display Filter List dialog box from the filter bar or some other part of Ethereal from which you can apply a display filter, then an
OK button will also be available. Use this button to apply the filter and close the dialog box. Use the Applybutton to apply your filter and leave the dialog box open (see Figure 4.43).
This has only been a very rudimentary introduction to display filtering; a more in-depth discussion can be found in the Chapter 5.
Match and Prepare Submenus
The Match and Preparesubmenus have the same options and behave in the same way with one exception; the Prepare submenu items prepare a display filter string and place it in the Filter textbox.The Match submenu items pre-pare a display filter string, place it in the Filter textbox and apply it to the cap-ture. Because of their close similarity we will only discuss the Match submenu. The Match submenu becomes available when you have selected a field in the Protocol Tree Window with an associated filter name that can be used in a display filter string. An example is shown in Figure 4.44.
In Table 4.11, we can see the filter string that would be put in the Filter:
textbox for each of the Match submenu options for the example in Figure 4.44. Table 4.11 Match Submenu Option Examples
Menu Option Display Filter String
Selected bgp.type == 1
Not Selected !(bgp.type == 1)
And Selected (ip.addr == 192.168.0.15) && ( bgp.type == 1 ) Or Selected (ip.addr == 192.168.0.15) || ( bgp.type == 1) And Not Selected (ip.addr == 192.168.0.15) && !( bgp.type == 1 ) Or Not Selected (ip.addr == 192.168.0.15) || !( bgp.type == 1 )
Enabled Protocols
The Enabled Protocols dialog box, shown in Figure 4.45, is displayed by selecting
Analyze | Enabled Protocols….
www.syngress.com
This dialog box allows you to enable or disable the decoding of one or more protocols.You can do this by clicking its Status column to toggle its status between Enabled and Disabled. Additionally, you can enable all protocols by clicking the Enable All button, disable all protocols by clicking the Disable All
button, or enable all disabled protocols and disable all enabled protocols by clicking the Invert button.You can apply these settings to all Ethereal sessions by clicking the Save button.
Decode As
To force the decode of a packet, select it in the Summary Window and then select Analyze | Decode As….The Decode As dialog box will be displayed, as shown in Figure 4.46.
Figure 4.45 Enabled Protocols Dialog Box
When Ethereal is decoding a packet it uses magic numbers in each protocol to decide which dissector to use to decode subsequent parts of the packet. Magic numbers are values that specify some higher-level protocol, like Ethertype
0x0800 specifying that an Ethernet packet contains an IP packet, or IP protocol 6 specifying that an IP packet contains a TCP payload, or TCP port 179 speci-fying that a TCP packet is carrying a BGP payload.There are occasions when you want to override Ethereal’s choices in how to decode subsequent parts of the packet based on these magic numbers.The most common examples involve TCP ports. Ethereal frequently decides which dissector to call next for a TCP packet based upon the source or destination port. We may be running a protocol over a non-standard port, like running HTTP over port 7000 for example.The Decode As feature allows us to tell Ethereal about such non-standard cases.
Ethereal allows the user to force decodes based upon the magic numbers in the link layer, network layer, or transport layer. For the transport layer we have the option of decoding based on source, destination or both, as shown in Figure 4.47.
To force a particular decode you need to answer the questions: 1. After which layer do I want to start forcing my custom decode?
2. Which magic number do I want to key off of to determine whether to decode a packet with my custom decode?
3. Which protocol do I want the remaining traffic in the packet decoded as? To choose the layer at which you want to start forcing your custom decode, select the appropriate tab (Link,Network, or Transport).You have a choice of which magic numbers to pick for the transport layer, where you can pick source
port,destination port, or both.Then, you may select from the list of protocols as to how you want the remaining traffic in the packet decoded.
www.syngress.com
Click the Show Currentbutton to open the Decode As: Show dialog box in order to see which decodes are currently being forced.
Decode As: Show
The Decode As: Show dialog box (Figure 4.48) can also be displayed by selecting
Analyze | User Specified Decodesfrom the menu bar.
This dialog box displays the decodes you have specified through the Decode As Dialog box, one per line.The Table column shows the type of magic number for which we are showing the alternate decode, in this case the TCP port.The
Portcolumn shows the magic number for which we are providing an alternate decode, in this case 179.The Initial column shows the dissector that would nor-mally be used to decode the payload of a packet with this magic number and magic number type, in this case BGP. And, finally, the Current column shows the dissector currently being used to decode the payload of packets having this magic number and magic number type, in this case HTTP.
Contents of TCP Stream
The Contents of TCP Stream window (Figure 4.49) can be displayed by
selecting a TCP packet in the Summary Window and then selecting Analyze | Follow TCP Streamfrom the menu bar.
In this example, a TCP packet that was part of an HTTP conversation with the web server for www.syngress.com is shown. By default, one side of the con-versation is shown in red (the upper portion), the other in blue (the lower por-tion). For readability purposes the side of the conversation that is normally blue has been changed to white text on a dark blue background, using the TCP Streamscolor selector. By scrolling down in this window you are able to see all of the data exchanged during this TCP conversation. If you click the Entire conversationselector you can choose between displaying the entire conversa-tion, or one of the directions (Figure 4.50).
www.syngress.com
Figure 4.49 Contents of TCP Stream Window